You are not logged in.
This means you
CAN ONLY VIEW reports that were published prior to Tuesday, February 18, 2025.
You
MUST UPGRADE YOUR MEMBERSHIP if you want to see any current reports.
AFTER MARKET UPDATE - MONDAY, DECEMBER 2ND, 2024
Previous After Market Report Next After Market Report >>>
|
|
|
|
DOW |
-128.65 |
44,782.00 |
-0.29% |
|
Volume |
982,866,883 |
+50% |
|
Volume |
6,516,957,300 |
+60% |
|
NASDAQ |
+185.78 |
19,403.95 |
+0.97% |
|
Advancers |
1,194 |
44% |
|
Advancers |
2,272 |
52% |
|
S&P 500 |
+14.77 |
6,047.15 |
+0.24% |
|
Decliners |
1,515 |
56% |
|
Decliners |
2,075 |
48% |
|
Russell 2000 |
-0.59 |
2,434.14 |
-0.02% |
|
52 Wk Highs |
128 |
|
|
52 Wk Highs |
236 |
|
|
S&P 600 |
+4.83 |
1,537.44 |
+0.32% |
|
52 Wk Lows |
33 |
|
|
52 Wk Lows |
88 |
|
|
 |
Nasdaq Composite Outpaced S&P 500 as Dow Industrials Edged Lower
Kenneth J. Gruneisen - Passed the CAN SLIM® Master's Exam
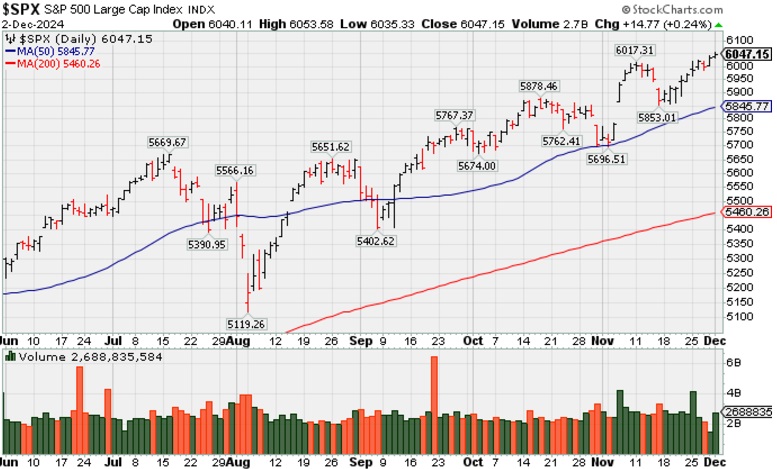
The S&P 500 (+0.2%) and Nasdaq Composite (+1.0%) hit new record highs while the Dow Jones Industrial Average declined -0.3%. Volume totals were higher than the prior shortened session's totals on the NYSE and on the Nasdaq exchange. Advancers led decliners by a narrow margin at the Nasdaq and decliners led advancers by a 5-4 margin at the NYSE. There were 51 high-ranked companies from the Leaders List that hit new 52-week highs and were listed on the BreakOuts Page, versus the total of 51 on the prior session. New 52-week highs totals solidly outnumbered new 52-week lows on the NYSE and on the Nasdaq exchange. The major indices are in a confirmed uptrend (M criteria). Disciplined investors know that new buying efforts are only to be made in stocks meeting all key criteria of the fact-based investment system.
PICTURED: The S&P 500 Index is hovering near its all-time high.
The S&P 500 communication services (+1.5%), consumer discretionary (+1.1%), and information technology (+1.0%) sectors ended higher while the remaining eight sectors registered losses ranging from -0.1% (consumer staples) to -2.1% (utilities).
Intel (INTC -0.5%) ended lower after initially trading up as much as +5.9%. CEO Pat Gelsinger is out and the company will be led by interim co-CEOs until a new CEO is hired.
President-elect Trump warned in a Truth Social post of consequences if Middle East hostages are not released. Also, The New York Times reported that Israel and Hezbollah have traded fire with both sides accusing the other of violating the ceasefire deal.
Treasuries settled with losses, leaving the 10-yr yield two basis points higher at 4.20%. Oil prices were little changed at $68.07/bbl, +$0.18 or +0.3%.
|
 Kenneth J. Gruneisen started out as a licensed stockbroker in August 1987, a couple of months prior to the historic stock market crash that took the Dow Jones Industrial Average down -22.6% in a single day. He has published daily fact-based fundamental and technical analysis on high-ranked stocks online for two decades. Through FACTBASEDINVESTING.COM, Kenneth provides educational articles, news, market commentary, and other information regarding proven investment systems that work in good times and bad.
Comments contained in the body of this report are technical opinions only and are not necessarily those of Gruneisen Growth Corp. The material herein has been obtained from sources believed to be reliable and accurate, however, its accuracy and completeness cannot be guaranteed. Our firm, employees, and customers may effect transactions, including transactions contrary to any recommendation herein, or have positions in the securities mentioned herein or options with respect thereto. Any recommendation contained in this report may not be suitable for all investors and it is not to be deemed an offer or solicitation on our part with respect to the purchase or sale of any securities. |
|
 |
Retail and Tech Indexes Rose
Kenneth J. Gruneisen - Passed the CAN SLIM® Master's Exam
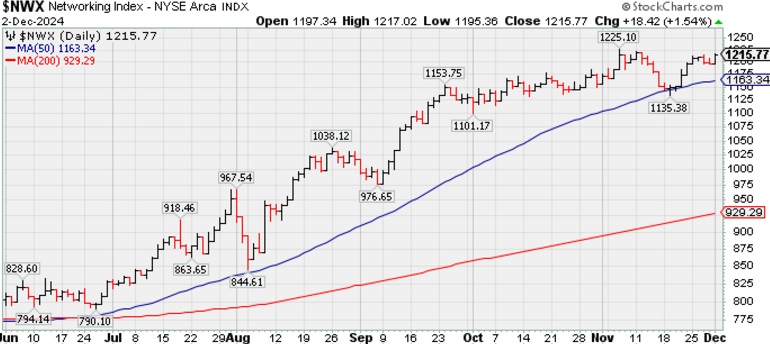
The Retail Index ($RLX +0.89%) posted a modest gain while the Broker/Dealer Index ($XBD +0.15%) inched higher but the Bank Index ($BKX -1.22%) fell. The tech sector had a positive bias Networking Index ($NWX +1.54%) and the Semiconductor Index ($SOX +2.61%) posted solid gains while the Biotech Index ($BTK +0.11%) inched higher. Commodity-linked groups had a negative bias as the Gold & Silver Index ($XAU -1.72%) and Integrated Oil Index ($XOI -0.36%) fell and the Oil Services Index ($OSX +0.03%) was unchanged.
PICTURED: The Networking Index ($NWX +1.54%) posted a gain. It recently found support at its 50-day moving average (DMA) line.
| Oil Services |
$OSX |
80.37 |
+0.03 |
+0.03% |
-4.18% |
| Integrated Oil |
$XOI |
1,928.39 |
-6.89 |
-0.36% |
+3.54% |
| Semiconductor |
$SOX |
5,055.32 |
+128.76 |
+2.61% |
+21.07% |
| Networking |
$NWX |
1,215.77 |
+18.42 |
+1.54% |
+45.98% |
| Broker/Dealer |
$XBD |
850.22 |
+1.29 |
+0.15% |
+52.56% |
| Retail Index |
$RLX |
5,124.27 |
+45.01 |
+0.89% |
+31.77% |
| Gold & Silver |
$XAU |
147.88 |
-2.59 |
-1.72% |
+17.65% |
| Bank |
$BKX |
136.48 |
-1.68 |
-1.22% |
+42.14% |
| Biotech |
$BTK |
6,006.22 |
+6.31 |
+0.11% |
+10.84% |
|
|
|
 |
Featured Stocks
Kenneth J. Gruneisen - Passed the CAN SLIM® Master's Exam
Symbol/Exchange
Company Name
Industry Group | PRICE | CHANGE
(%Change) | Day High | Volume
(% DAV)
(% 50 day avg vol) | 52 Wk Hi
% From Hi | Featured
Date | Price
Featured | Pivot Featured | | Max Buy |  USLM - NASDAQ USLM - NASDAQ
U.S. Lime & Minerals
Bldg-Cement/Concrt/Ag | $156.60 | +3.60
2.35% | $156.98 | 124,073
147.71% of 50 DAV
50 DAV is 84,000 | $159.53
-1.84%
| 9/17/2024 | $71.26 | PP = $87.23 | | MB = $91.59 |  Most Recent Note - 12/2/2024 6:20:44 PM Most Recent Note - 12/2/2024 6:20:44 PM
G - Very extended from any sound base, perched near its all-time high. Held its ground stubbornly following a noted spurt of volume-driven gains. Its 50 DMA line ($117) defines important near-term support to watch on pullbacks.
>>> FEATURED STOCK ARTICLE : Extended From Any Sound Base After Impressive Rally - 11/12/2024 | View all notes | Set NEW NOTE alert | Company Profile | SEC News | Chart | Request a new note C A S I | GVA - NYSE
Granite Construction
Bldg-Heavy Construction | $98.76 | -0.61
-0.61% | $99.83 | 309,062
46.76% of 50 DAV
50 DAV is 661,000 | $100.57
-1.80%
| 6/11/2024 | $59.76 | PP = $64.33 | | MB = $67.55 | Most Recent Note - 11/26/2024 7:05:12 PM
G - Hovering near its all-time high, stubbornly holding its ground, very extended from any sound base. Bullish action has come after it reported Sep '24 quarterly earnings +19% on +14% sales revenues versus the year-ago period, below the +25% minimum guideline (C criteria) of the fact-based investment system.
>>> FEATURED STOCK ARTICLE : Extended From Base After Streak of Gains for New Highs - 11/8/2024 | View all notes | Set NEW NOTE alert | Company Profile | SEC News | Chart | Request a new note C A S I | TXRH - NASDAQ
Texas Roadhouse
Retail-Restaurants | $198.20 | -7.07
-3.44% | $205.11 | 718,769
101.81% of 50 DAV
50 DAV is 706,000 | $206.04
-3.81%
| 7/26/2024 | $173.08 | PP = $175.82 | | MB = $184.61 | Most Recent Note - 12/2/2024 6:19:22 PM
G - Pulled back from its all-time high with today''s loss on (higher) average volume. Its 50 DMA line ($187) defines important support to watch on pullbacks.
>>> FEATURED STOCK ARTICLE : Hovering Near High After Recent Volume-driven Gains - 11/15/2024 | View all notes | Set NEW NOTE alert | Company Profile | SEC News | Chart | Request a new note C A S I | HWM - NYSE
Howmet Aerospace
Aerospace/Defense | $117.69 | -0.69
-0.58% | $118.69 | 2,925,535
125.18% of 50 DAV
50 DAV is 2,337,000 | $119.28
-1.33%
| 7/30/2024 | $93.95 | PP = $85.52 | | MB = $89.80 | Most Recent Note - 12/2/2024 6:24:39 PM
G - Pulled back from its all-time high with today''s small loss on near average volume. It is extended from any sound base. Its prior high ($106.93 on 10/21/24) and 50 DMA line ($106.74) define near-term support levels to watch on pullbacks. Fundamentals remain strong.
>>> FEATURED STOCK ARTICLE : Found Support at 50-Day Moving Average Line Before Earnings Report - 11/5/2024 | View all notes | Set NEW NOTE alert | Company Profile | SEC News | Chart | Request a new note C A S I | NGVC - NYSE
Natural Grocers
Retail-Super/Mini Mkts | $45.87 | -1.06
-2.26% | $46.97 | 103,711
99.72% of 50 DAV
50 DAV is 104,000 | $47.57
-3.57%
| 11/5/2024 | $30.57 | PP = $30.42 | | MB = $31.94 | Most Recent Note - 12/2/2024 6:23:31 PM
G - Pulled back from its all-time high with today's loss backed by average volume. Reported Sep '24 quarterly earnings +50% on +9% sales revenues versus the year-ago period. Prior high in the $30 area defines initial support to watch above its 50 DMA line.
>>> FEATURED STOCK ARTICLE : New High After 6th Consecutive Gain - 11/11/2024 | View all notes | Set NEW NOTE alert | Company Profile | SEC News | Chart | Request a new note C A S I | Symbol/Exchange
Company Name
Industry Group | PRICE | CHANGE
(%Change) | Day High | Volume
(% DAV)
(% 50 day avg vol) | 52 Wk Hi
% From Hi | Featured
Date | Price
Featured | Pivot Featured | | Max Buy | CLS - NYSE
Celestica
Elec-Contract Mfg | $84.96 | -0.28
-0.33% | $87.08 | 1,830,227
77.32% of 50 DAV
50 DAV is 2,367,000 | $93.15
-8.79%
| 10/11/2024 | $57.62 | PP = $63.59 | | MB = $66.77 | Most Recent Note - 11/27/2024 12:04:44 PM
G - Pulling back from its all-time high after getting very extended from any sound base. Its 50 DMA line ($67.23) defines initial support above prior highs in the $63 area.
>>> FEATURED STOCK ARTICLE : Pulling Back After Considerable Rally - 11/13/2024 | View all notes | Set NEW NOTE alert | Company Profile | SEC News | Chart | Request a new note C A S I | PAY - NYSE
Paymentus Holdings
Finance-CrdtCard/PmtPr | $38.35 | +0.54
1.43% | $38.94 | 585,147
170.10% of 50 DAV
50 DAV is 344,000 | $38.76
-1.06%
| 10/17/2024 | $26.15 | PP = $25.31 | | MB = $26.58 | Most Recent Note - 11/27/2024 12:46:04 PM
G - Extended from any sound base and pulling back from its 52-week high with today's loss after 7 gains in the prior 8 sessions. Bullish action came after it reported Sep '24 quarterly earnings +67% on +52% sales revenues versus the year-ago period.
>>> FEATURED STOCK ARTICLE : Extended From Prior Base After Considerable Spike Higher - 11/14/2024 | View all notes | Set NEW NOTE alert | Company Profile | SEC News | Chart | Request a new note C A S I | RMD - NYSE
ResMed
Medical-Products | $244.92 | -4.10
-1.65% | $248.91 | 575,940
57.83% of 50 DAV
50 DAV is 996,000 | $260.49
-5.98%
| 10/25/2024 | $256.64 | PP = $255.28 | | MB = $268.04 | Most Recent Note - 12/2/2024 6:25:48 PM
Y - Pulled back near its 50 DMA line ($242) with light volume behind today''s loss. Little resistance remains due to overhead supply.
>>> FEATURED STOCK ARTICLE : Recent Slump Below 50-Day Moving Average Raised Concerns - 11/18/2024 | View all notes | Set NEW NOTE alert | Company Profile | SEC News | Chart | Request a new note C A S I | ATGE - NYSE
Adtalem Global Education
Consumer Svcs-Education | $91.57 | +0.16
0.18% | $92.00 | 520,934
142.72% of 50 DAV
50 DAV is 365,000 | $92.93
-1.46%
| 10/30/2024 | $83.34 | PP = $80.28 | | MB = $84.29 | Most Recent Note - 11/26/2024 7:11:57 PM
G - Perched at its all-time high today, pausing with light volume. Prior highs in the $80 area define initial support to watch on pullbacks. Fundamentals remain strong.
>>> FEATURED STOCK ARTICLE : Holding Ground Following Recent Technical Breakout - 11/4/2024 | View all notes | Set NEW NOTE alert | Company Profile | SEC News | Chart | Request a new note C A S I | TW - NASDAQ
Tradeweb Markets
Financial Svcs-Specialty | $134.48 | -0.92
-0.68% | $136.21 | 621,933
74.13% of 50 DAV
50 DAV is 839,000 | $138.25
-2.73%
| 11/19/2024 | $134.41 | PP = $136.23 | | MB = $143.04 | Most Recent Note - 11/26/2024 7:08:33 PM
Y - Perched at its all-time high, encountering some distributional pressure. Subsequent volume-driven gains above the pivot point may trigger a proper technical buy signal. It was highlighted in yellow with pivot point cited based on its 10/15/24 high plus 10 cents. Found support recently at its 50 DMA line ($129.54).
>>> FEATURED STOCK ARTICLE : Tradeweb Markets Perched Near High - 11/19/2024 | View all notes | Set NEW NOTE alert | Company Profile | SEC News | Chart | Request a new note C A S I | Symbol/Exchange
Company Name
Industry Group | PRICE | CHANGE
(%Change) | Day High | Volume
(% DAV)
(% 50 day avg vol) | 52 Wk Hi
% From Hi | Featured
Date | Price
Featured | Pivot Featured | | Max Buy |
|
|
|
Color Codes Explained :
Y - Better candidates highlighted by our
staff of experts.
G - Previously featured
in past reports as yellow but may no longer be buyable under the
guidelines.
***Last / Change / Volume data in this table is the closing quote data***
Symbol/Exchange
Company Name
Industry Group |
PRICE |
CHANGE
(%Change) |
Day High |
Volume
(% DAV)
(% 50 day avg vol) |
52 Wk Hi
% From Hi |
Featured
Date |
Price
Featured |
Pivot Featured |
|
Max Buy |
 USLM
-
NASDAQ
USLM
-
NASDAQ
U.S. Lime & Minerals
Bldg-Cement/Concrt/Ag
|
$155.77
|
+2.77
1.81% |
$156.06
|
65,783
78.31% of 50 DAV
50 DAV is 84,000
|
$159.53
-2.36%
|
9/17/2024
|
$71.26
|
PP = $87.23
|
|
MB = $91.59
|
Most Recent Note - 11/27/2024 12:55:05 PM
G - Pulling back today after getting very extended from any sound base. It hit yet another new all-time high with a big volume-driven gain on the prior session. Held its ground stubbornly following a noted spurt of volume-driven gains. Its 50 DMA line ($114.54) defines important near-term support to watch on pullbacks.
>>> FEATURED STOCK ARTICLE : Extended From Any Sound Base After Impressive Rally - 11/12/2024 |
View all notes |
Set NEW NOTE alert |
Company Profile |
SEC
News |
Chart |
Request a new note
C
A
S
I |
GVA
-
NYSE
Granite Construction
Bldg-Heavy Construction
|
$98.97
|
-0.40
-0.40% |
$99.83
|
128,736
19.48% of 50 DAV
50 DAV is 661,000
|
$100.57
-1.59%
|
6/11/2024
|
$59.76
|
PP = $64.33
|
|
MB = $67.55
|
Most Recent Note - 11/26/2024 7:05:12 PM
G - Hovering near its all-time high, stubbornly holding its ground, very extended from any sound base. Bullish action has come after it reported Sep '24 quarterly earnings +19% on +14% sales revenues versus the year-ago period, below the +25% minimum guideline (C criteria) of the fact-based investment system.
>>> FEATURED STOCK ARTICLE : Extended From Base After Streak of Gains for New Highs - 11/8/2024 |
View all notes |
Set NEW NOTE alert |
Company Profile |
SEC
News |
Chart |
Request a new note
C
A
S
I |
TXRH
-
NASDAQ
Texas Roadhouse
Retail-Restaurants
|
$198.62
|
-6.65
-3.24% |
$205.11
|
355,165
50.31% of 50 DAV
50 DAV is 706,000
|
$206.04
-3.60%
|
7/26/2024
|
$173.08
|
PP = $175.82
|
|
MB = $184.61
|
Most Recent Note - 11/26/2024 7:09:37 PM
G - Hit another new high with today's 3rd consecutive gain. Its 50 DMA line ($185) defines important support to watch on pullbacks.
>>> FEATURED STOCK ARTICLE : Hovering Near High After Recent Volume-driven Gains - 11/15/2024 |
View all notes |
Set NEW NOTE alert |
Company Profile |
SEC
News |
Chart |
Request a new note
C
A
S
I |
HWM
-
NYSE
Howmet Aerospace
Aerospace/Defense
|
$118.10
|
-0.28
-0.24% |
$118.69
|
1,549,020
66.28% of 50 DAV
50 DAV is 2,337,000
|
$119.28
-0.99%
|
7/30/2024
|
$93.95
|
PP = $85.52
|
|
MB = $89.80
|
Most Recent Note - 11/25/2024 8:50:31 PM
G - Pulled back from its all-time high with today's loss on average volume following recent volume-driven gains, It is extended from any sound base. Its prior high ($106.93 on 10/21/24) and 50 DMA line ($105) define near-term support levels to watch on pullbacks. Fundamentals remain strong.
>>> FEATURED STOCK ARTICLE : Found Support at 50-Day Moving Average Line Before Earnings Report - 11/5/2024 |
View all notes |
Set NEW NOTE alert |
Company Profile |
SEC
News |
Chart |
Request a new note
C
A
S
I |
NGVC
-
NYSE
Natural Grocers
Retail-Super/Mini Mkts
|
$46.58
|
-0.35
-0.75% |
$46.97
|
53,973
51.90% of 50 DAV
50 DAV is 104,000
|
$47.57
-2.08%
|
11/5/2024
|
$30.57
|
PP = $30.42
|
|
MB = $31.94
|
Most Recent Note - 11/25/2024 8:51:28 PM
G - Powered to another new all-time high with today's 7th consecutive volume-driven gain, getting very extended from any sound base. Bullish action came after it reported Sep '24 quarterly earnings +50% on +9% sales revenues versus the year-ago period. Prior high in the $30 area defines initial support to watch above its 50 DMA line.
>>> FEATURED STOCK ARTICLE : New High After 6th Consecutive Gain - 11/11/2024 |
View all notes |
Set NEW NOTE alert |
Company Profile |
SEC
News |
Chart |
Request a new note
C
A
S
I |
Symbol/Exchange
Company Name
Industry Group |
PRICE |
CHANGE
(%Change) |
Day High |
Volume
(% DAV)
(% 50 day avg vol) |
52 Wk Hi
% From Hi |
Featured
Date |
Price
Featured |
Pivot Featured |
|
Max Buy |
CLS
-
NYSE
Celestica
Elec-Contract Mfg
|
$85.21
|
-0.03
-0.04% |
$87.08
|
1,245,913
52.64% of 50 DAV
50 DAV is 2,367,000
|
$93.15
-8.52%
|
10/11/2024
|
$57.62
|
PP = $63.59
|
|
MB = $66.77
|
Most Recent Note - 11/27/2024 12:04:44 PM
G - Pulling back from its all-time high after getting very extended from any sound base. Its 50 DMA line ($67.23) defines initial support above prior highs in the $63 area.
>>> FEATURED STOCK ARTICLE : Pulling Back After Considerable Rally - 11/13/2024 |
View all notes |
Set NEW NOTE alert |
Company Profile |
SEC
News |
Chart |
Request a new note
C
A
S
I |
PAY
-
NYSE
Paymentus Holdings
Finance-CrdtCard/PmtPr
|
$38.10
|
+0.29
0.77% |
$38.94
|
406,120
118.06% of 50 DAV
50 DAV is 344,000
|
$38.76
-1.70%
|
10/17/2024
|
$26.15
|
PP = $25.31
|
|
MB = $26.58
|
Most Recent Note - 11/27/2024 12:46:04 PM
G - Extended from any sound base and pulling back from its 52-week high with today's loss after 7 gains in the prior 8 sessions. Bullish action came after it reported Sep '24 quarterly earnings +67% on +52% sales revenues versus the year-ago period.
>>> FEATURED STOCK ARTICLE : Extended From Prior Base After Considerable Spike Higher - 11/14/2024 |
View all notes |
Set NEW NOTE alert |
Company Profile |
SEC
News |
Chart |
Request a new note
C
A
S
I |
RMD
-
NYSE
ResMed
Medical-Products
|
$244.81
|
-4.21
-1.69% |
$248.91
|
242,787
24.38% of 50 DAV
50 DAV is 996,000
|
$260.49
-6.02%
|
10/25/2024
|
$256.64
|
PP = $255.28
|
|
MB = $268.04
|
Most Recent Note - 11/25/2024 8:54:57 PM
Y - Color code was changed to yellow while rebounding above its 50 DMA line ($242) with above average volume behind a solid gain. Little resistance remains due to overhead supply.
>>> FEATURED STOCK ARTICLE : Recent Slump Below 50-Day Moving Average Raised Concerns - 11/18/2024 |
View all notes |
Set NEW NOTE alert |
Company Profile |
SEC
News |
Chart |
Request a new note
C
A
S
I |
ATGE
-
NYSE
Adtalem Global Education
Consumer Svcs-Education
|
$91.30
|
-0.11
-0.12% |
$92.00
|
261,828
71.73% of 50 DAV
50 DAV is 365,000
|
$92.93
-1.75%
|
10/30/2024
|
$83.34
|
PP = $80.28
|
|
MB = $84.29
|
Most Recent Note - 11/26/2024 7:11:57 PM
G - Perched at its all-time high today, pausing with light volume. Prior highs in the $80 area define initial support to watch on pullbacks. Fundamentals remain strong.
>>> FEATURED STOCK ARTICLE : Holding Ground Following Recent Technical Breakout - 11/4/2024 |
View all notes |
Set NEW NOTE alert |
Company Profile |
SEC
News |
Chart |
Request a new note
C
A
S
I |
TW
-
NASDAQ
Tradeweb Markets
Financial Svcs-Specialty
|
$134.92
|
-0.49
-0.36% |
$136.21
|
272,760
32.51% of 50 DAV
50 DAV is 839,000
|
$138.25
-2.41%
|
11/19/2024
|
$134.41
|
PP = $136.23
|
|
MB = $143.04
|
Most Recent Note - 11/26/2024 7:08:33 PM
Y - Perched at its all-time high, encountering some distributional pressure. Subsequent volume-driven gains above the pivot point may trigger a proper technical buy signal. It was highlighted in yellow with pivot point cited based on its 10/15/24 high plus 10 cents. Found support recently at its 50 DMA line ($129.54).
>>> FEATURED STOCK ARTICLE : Tradeweb Markets Perched Near High - 11/19/2024 |
View all notes |
Set NEW NOTE alert |
Company Profile |
SEC
News |
Chart |
Request a new note
C
A
S
I |
Symbol/Exchange
Company Name
Industry Group |
PRICE |
CHANGE
(%Change) |
Day High |
Volume
(% DAV)
(% 50 day avg vol) |
52 Wk Hi
% From Hi |
Featured
Date |
Price
Featured |
Pivot Featured |
|
Max Buy |
|
|
|
THESE ARE NOT BUY RECOMMENDATIONS!
Comments contained in the body of this report are technical
opinions only. The material herein has been obtained
from sources believed to be reliable and accurate, however,
its accuracy and completeness cannot be guaranteed.
This site is not an investment advisor, hence it does
not endorse or recommend any securities or other investments.
Any recommendation contained in this report may not
be suitable for all investors and it is not to be deemed
an offer or solicitation on our part with respect to
the purchase or sale of any securities. All trademarks,
service marks and trade names appearing in this report
are the property of their respective owners, and are
likewise used for identification purposes only.
This report is a service available
only to active Paid Premium Members.
You may opt-out of receiving report notifications
at any time. Questions or comments may be submitted
by writing to Premium Membership Services 665 S.E. 10 Street, Suite 201 Deerfield Beach, FL 33441-5634 or by calling 1-800-965-8307
or 954-785-1121.
|
|
|