You are not logged in.
This means you
CAN ONLY VIEW reports that were published prior to Friday, March 15, 2024.
You
MUST UPGRADE YOUR MEMBERSHIP if you want to see any current reports.
AFTER MARKET UPDATE - TUESDAY, DECEMBER 1ST, 2020
Previous After Market Report Next After Market Report >>>
|
|
|
|
DOW |
+185.28 |
29,823.92 |
+0.63% |
|
Volume |
1,045,468,059 |
-44% |
|
Volume |
6,483,572,000 |
-16% |
|
NASDAQ |
+156.37 |
12,355.11 |
+1.28% |
|
Advancers |
2,167 |
70% |
|
Advancers |
2,075 |
58% |
|
S&P 500 |
+40.82 |
3,662.45 |
+1.13% |
|
Decliners |
920 |
30% |
|
Decliners |
1,511 |
42% |
|
Russell 2000 |
+16.23 |
1,836.05 |
+0.89% |
|
52 Wk Highs |
162 |
|
|
52 Wk Highs |
320 |
|
|
S&P 600 |
+12.24 |
1,046.75 |
+1.18% |
|
52 Wk Lows |
3 |
|
|
52 Wk Lows |
12 |
|
|
 |
Major Indices Rose With Positive Breadth and Better Leadership
Kenneth J. Gruneisen - Passed the CAN SLIM® Master's Exam
The Dow jumped 185 points to 29,823. The S&P 500 and Nasdaq Composite each closed at a fresh all-time high, with the benchmarks adding 1.1 and 1.3%, respectively. The volume totals were lighter than the prior session on the NYSE and on the Nasdaq exchange. Breadth was positive as advancers led decliners by more than a 2-1 margin on the NYSE and by 4-3 on the Nasdaq exchange. There were 62 high-ranked companies from the Leaders List that hit new 52-week highs and were listed on the BreakOuts Page, versus the total of 43 on the prior session. New 52-week highs totals solidly outnumbered new 52-week lows totals on both exchanges. The major indices confirmed a new uptrend (M criteria) with recent follow-through gains backed by higher volume and more leadership. Investors are reminded to always make buying and selling decisions based based on the strict criteria and rules of the fact-based investment system.  PICTURED: The Nasdaq Composite Index rallied to a new record high.
Stocks ended higher on Tuesday, as investors digested encouraging COVID vaccine news and fiscal stimulus updates. Vice President Mike Pence noted that an approved vaccine could be distributed as soon as the third week of December. Elsewhere, Senate majority leader Mitch McConnell said he was working on a revised stimulus package with Treasury Secretary Mnuchin after a group of bipartisan lawmakers unveiled a separate $900 billion relief bill.
Central bank updates also garnered attention, with Fed Chair Jerome Powell appearing before the Senate Banking Committee. He expressed the need for additional fiscal aid and said the uncertainty around the timing of an effective COVID vaccine clouds the economic outlook. On the data front, the ISM's gauge of U.S. manufacturing activity showed the pace of expansion slowed more than expected in November. Treasuries declined, with the yield on the 10-year note jumping seven basis points to 0.92%. In commodities, WTI crude fell 1.7% to $44.56/barrel.
Ten of 11 S&P 500 sectors finished in positive territory, with Industrials narrowly bucking the uptrend. The Communication Services paced the gains with a 2% advance. The Financials group also outperformed amid an uptick in Treasury yields. In corporate news, Zoom Video (ZM -15.06%) fell after highlighting higher costs following an earnings and revenue beat. Tesla (TSLA +3.02%) rose after S&P Dow Jones Indices noted that the company will be added to the S&P 500 index in a single tranche on December 21. |
 Kenneth J. Gruneisen started out as a licensed stockbroker in August 1987, a couple of months prior to the historic stock market crash that took the Dow Jones Industrial Average down -22.6% in a single day. He has published daily fact-based fundamental and technical analysis on high-ranked stocks online for two decades. Through FACTBASEDINVESTING.COM, Kenneth provides educational articles, news, market commentary, and other information regarding proven investment systems that work in good times and bad.
Comments contained in the body of this report are technical opinions only and are not necessarily those of Gruneisen Growth Corp. The material herein has been obtained from sources believed to be reliable and accurate, however, its accuracy and completeness cannot be guaranteed. Our firm, employees, and customers may effect transactions, including transactions contrary to any recommendation herein, or have positions in the securities mentioned herein or options with respect thereto. Any recommendation contained in this report may not be suitable for all investors and it is not to be deemed an offer or solicitation on our part with respect to the purchase or sale of any securities. |
|
 |
Financial, Retail, Tech and Commodity-Linked Groups Rose
Kenneth J. Gruneisen - Passed the CAN SLIM® Master's Exam
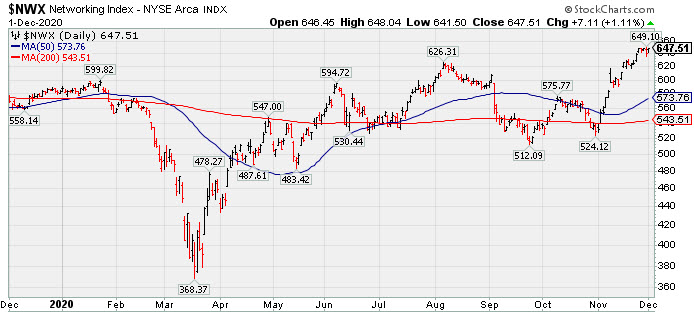
Financial shares had a positive influence on the major indices as the Broker/Dealer Index ($XBD +2.03%) and Bank Index ($BKX +2.41%) rose. The Retail Index ($RLX +1.14%) also posted a gain. The Semiconductor Index ($SOX +1.74%) led the tech sector higher while the Networking Index ($NWX +1.11%) and Biotech Index ($BTK +1.12%) also posted solid gains. Commodity-linked groups also had a positive bias as the Gold & Silver Index ($XAU +3.85%), Oil Services Index ($OSX +3.59%), and Integrated Oil Index ($XOI +1.03%) posted gains.
PICTURED: The Networking Index ($NWX +1.11%) rallied from near its 200-day moving average (DMA) line at the start of November to reach new all-time highs.
| Oil Services |
$OSX |
40.72 |
+1.41 |
+3.59% |
-47.99% |
| Integrated Oil |
$XOI |
754.19 |
+7.71 |
+1.03% |
-40.64% |
| Semiconductor |
$SOX |
2,709.73 |
+46.24 |
+1.74% |
+46.50% |
| Networking |
$NWX |
647.51 |
+7.11 |
+1.11% |
+10.99% |
| Broker/Dealer |
$XBD |
353.43 |
+7.02 |
+2.03% |
+21.71% |
| Retail |
$RLX |
3,531.51 |
+39.74 |
+1.14% |
+44.19% |
| Gold & Silver |
$XAU |
139.91 |
+5.19 |
+3.85% |
+30.86% |
| Bank |
$BKX |
92.53 |
+2.18 |
+2.41% |
-18.38% |
| Biotech |
$BTK |
5,566.48 |
+61.50 |
+1.12% |
+9.85% |
|
|
|
 |
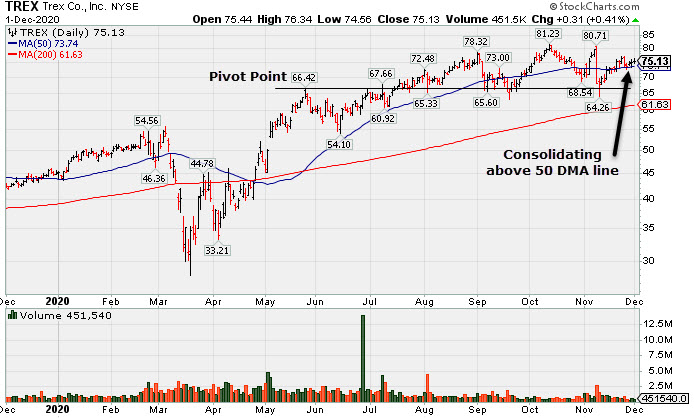
Consolidating Back Above 50-Day Moving Average Line
Kenneth J. Gruneisen - Passed the CAN SLIM® Master's Exam
Trex Company Inc (TREX +0.31 or +0.41% to $75.13) is consolidating above its 50-day moving average (DMA) line ($73.74). Volume-driven gains helped its technical stance and outlook improve. Recently it reported Sep '20 quarterly earnings +14% on +19% sales revenues versus the year ago period, below the +25% minimum guideline (C criteria) raising fundamental concerns while breaking a streak of 4 consecutive quarterly comparisons above the +25% minimum earnings guideline (C criteria).
TREX last appeared in this FSU section on 11/04/20 with an annotated graph under the headline, "Rebound Above 50-Day Moving Average Helped Technical Stance". It has a 95 Earnings Per Share Rating. Annual earnings (A criteria) growth has been strong. The company hails from the General Building Materials industry group which currently has a Group Relative Strength Rating of (68) B.
The company has a new CEO as of 4/29/20. After a 2:1 share split effective 9/15/20 it now has a supply (S criteria) of 115.8 million shares outstanding. The number of top-rated funds owning its shares rose from 540 in Jun '19 to 766 in Sep '20, a reassuring sign concerning the I criteria. Its current Up/Down Volume Ratio of 0.8 is an unbiased indication its shares have been under distributional pressure over the past 50 days. It has a Timeliness rating of B and a Sponsorship Rating of C.
|
|
|
Color Codes Explained :
Y - Better candidates highlighted by our
staff of experts.
G - Previously featured
in past reports as yellow but may no longer be buyable under the
guidelines.
***Last / Change / Volume data in this table is the closing quote data***
Symbol/Exchange
Company Name
Industry Group |
PRICE |
CHANGE
(%Change) |
Day High |
Volume
(% DAV)
(% 50 day avg vol) |
52 Wk Hi
% From Hi |
Featured
Date |
Price
Featured |
Pivot Featured |
|
Max Buy |
 CRL
-
NYSE
CRL
-
NYSE
Charles River Labs Intl
DRUGS - Biotechnology
|
$237.26
|
+2.74
1.17% |
$238.17
|
224,889
70.28% of 50 DAV
50 DAV is 320,000
|
$257.88
-8.00%
|
7/15/2020
|
$192.66
|
PP = $189.95
|
|
MB = $199.45
|
Most Recent Note - 11/30/2020 6:27:35 PM
G - The prompt rebound above its 50 DMA line ($232.62) helped its outlook improve. Reported Sep '20 quarterly earnings +38% on +11% sales revenues versus the year ago period, above the +25% minimum earnings guideline (C criteria).
>>> FEATURED STOCK ARTICLE : Consolidating Near Important Support Levels - 11/23/2020 |
View all notes |
Set NEW NOTE alert |
Company Profile |
SEC
News |
Chart |
Request a new note
C
A
S
I |
AMD
-
NASDAQ
Advanced Micro Devices
ELECTRONICS - Semiconductor - Broad Line
|
$92.63
|
-0.03
-0.03% |
$93.90
|
58,513,855
116.33% of 50 DAV
50 DAV is 50,299,000
|
$94.28
-1.75%
|
11/18/2020
|
$82.54
|
PP = $88.72
|
|
MB = $93.16
|
 Most Recent Note - 12/1/2020 12:14:39 PM
G - Color code is changed to green while trading above its "max buy" level and challenging its all-time high with today's gain. Rallied above pivot point on the prior session with a big gain backed by +69% above average volume triggering a technical buy signal. Its 50 DMA line ($82) defines important near term support. See the latest FSU analysis for more details and an annotated graph.
>>> FEATURED STOCK ARTICLE : Volume Heavy Behind AMD's Breakout from Double Bottom Base - 11/30/2020 |
View all notes |
Set NEW NOTE alert |
Company Profile |
SEC
News |
Chart |
Request a new note
C
A
S
I |
TER
-
NASDAQ
Teradyne Inc
ELECTRONICS - Semiconductor Equipment and Mate
|
$115.12
|
+4.78
4.33% |
$115.94
|
2,174,939
138.62% of 50 DAV
50 DAV is 1,569,000
|
$110.83
3.87%
|
10/21/2020
|
$92.22
|
PP = $93.54
|
|
MB = $98.22
|
Most Recent Note - 12/1/2020 6:45:50 PM
G - Posted a big gain today with above average volume for another new all-time high close. Reported earnings +53% on +41% sales revenues for the Sep '20 quarter versus the year ago period, its 4th consecutive quarterly comparison with earnings above the +25% minimum earnings guideline (C criteria). Sequential comparisons show encouraging acceleration in its sales revenues growth rate. Its annual earnings (A criteria) history has been strong.
>>> FEATURED STOCK ARTICLE : Recent Gains for New Highs Lacked Great Volume Conviction - 11/11/2020 |
View all notes |
Set NEW NOTE alert |
Company Profile |
SEC
News |
Chart |
Request a new note
C
A
S
I |
TREX
-
NYSE
Trex Company Inc
MATERIALS and CONSTRUCTION - General Building Materials
|
$75.13
|
+0.31
0.41% |
$76.34
|
451,540
60.69% of 50 DAV
50 DAV is 744,000
|
$81.23
-7.51%
|
6/26/2020
|
$54.53
|
PP = $66.47
|
|
MB = $69.79
|
Most Recent Note - 12/1/2020 6:43:54 PM
G - Posted a 3rd consecutive quiet gain today while consolidating above its 50 DMA line ($73.74). Recently noted that it reported Sep '20 quarterly earnings +14% on +19% sales revenues versus the year ago period, below the +25% minimum guideline (C criteria) raising fundamental concerns. See the latest FSU analysis for more details and a new annotated graph.
>>> FEATURED STOCK ARTICLE : Consolidating Back Above 50-Day Moving Average Line - 12/1/2020 |
View all notes |
Set NEW NOTE alert |
Company Profile |
SEC
News |
Chart |
Request a new note
C
A
S
I |
CLFD
-
NASDAQ
Clearfield Inc
TELECOMMUNICATIONS - Cables / Satalite Equipment
|
$24.15
|
+0.37
1.56% |
$25.03
|
85,961
94.46% of 50 DAV
50 DAV is 91,000
|
$25.97
-7.01%
|
11/17/2020
|
$22.06
|
PP = $26.07
|
|
MB = $27.37
|
Most Recent Note - 11/30/2020 12:18:39 PM
Y - Erased an early gain today after challenging its 52-week high. Near term support is defined by its 50 DMA line ($22.05) and an upward trendline. It has formed an advanced "ascending base" marked by 3 pullbacks of 10-20% after a big breakaway gap on 7/24/20. Subsequent gains above the pivot point marked by +40% above average volume are needed to trigger a proper technical buy signal. Reported earnings +57% on +14% sales revenues for the Sep '20 quarter versus the year ago period, its 3rd consecutive quarterly earnings comparison above the +25% minimum guideline (C criteria). Annual earnings (A criteria) history has improved after a downturn in FY '17.
>>> FEATURED STOCK ARTICLE : Formed Ascending Base Following Earlier Breakway Gap - 11/17/2020 |
View all notes |
Set NEW NOTE alert |
Company Profile |
SEC
News |
Chart |
Request a new note
C
A
S
I |
Symbol/Exchange
Company Name
Industry Group |
PRICE |
CHANGE
(%Change) |
Day High |
Volume
(% DAV)
(% 50 day avg vol) |
52 Wk Hi
% From Hi |
Featured
Date |
Price
Featured |
Pivot Featured |
|
Max Buy |
LGIH
-
NASDAQ
L G I Homes Inc
Bldg-Resident/Comml
|
$107.63
|
-0.42
-0.39% |
$109.43
|
266,742
104.60% of 50 DAV
50 DAV is 255,000
|
$132.98
-19.06%
|
10/1/2020
|
$123.17
|
PP = $124.04
|
|
MB = $130.24
|
Most Recent Note - 11/30/2020 6:24:38 PM
G - Still sputtering below its 50 DMA line ($116) which has acted as resistance after damaging volume-driven losses. The longer it lingers there the worse its outlook gets. A rebound above the 50 DMA line is needed for its outlook to improve. Reported Sep '20 quarterly earnings +27% on +11% sales revenues versus the year ago period.
>>> FEATURED STOCK ARTICLE : Rebound Toward 50-Day Average Which May Act as Resistance - 11/10/2020 |
View all notes |
Set NEW NOTE alert |
Company Profile |
SEC
News |
Chart |
Request a new note
C
A
S
I |
NOW
-
NYSE
Servicenow Inc
Computer Sftwr-Enterprse
|
$539.59
|
+5.04
0.94% |
$541.74
|
1,150,658
90.11% of 50 DAV
50 DAV is 1,277,000
|
$537.53
0.38%
|
8/20/2020
|
$453.34
|
PP = $454.79
|
|
MB = $477.53
|
Most Recent Note - 11/30/2020 6:26:10 PM
G - Posted a gain with above average volume for its second best ever close. Tested the prior low ($472 on 11/03/20) noted as important support where a damaging violation raises greater concerns. Recently reported Sep '20 quarterly earnings +22% on +30% sales revenues versus the year ago period, below the +25% minimum guideline (C criteria) of the fact-based investment system.
>>> FEATURED STOCK ARTICLE : Consolidating Above 50-Day Average Still Perched Near All-Time High - 11/24/2020 |
View all notes |
Set NEW NOTE alert |
Company Profile |
SEC
News |
Chart |
Request a new note
C
A
S
I |
VEEV
-
NYSE
Veeva Systems Inc Cl A
Computer Sftwr-Medical
|
$284.20
|
+7.33
2.65% |
$284.96
|
2,110,833
250.40% of 50 DAV
50 DAV is 843,000
|
$313.99
-9.49%
|
10/6/2020
|
$287.71
|
PP = $298.86
|
|
MB = $313.80
|
Most Recent Note - 12/1/2020 12:56:41 PM
G - Posting a 4th consecutive gain today with ever-increasing volume, approaching its 50 DMA line. A convincing rebound above the 50 DMA line ($282.55) would help its outlook improve. Faces resistance due to overhead supply up to the $314 area.
>>> FEATURED STOCK ARTICLE : Weak Technical Action Raised Recent Concerns - 11/16/2020 |
View all notes |
Set NEW NOTE alert |
Company Profile |
SEC
News |
Chart |
Request a new note
C
A
S
I |
ALRM
-
NASDAQ
Alarm.com Holdings Inc
Security/Sfty
|
$73.20
|
-2.71
-3.57% |
$76.56
|
357,355
104.49% of 50 DAV
50 DAV is 342,000
|
$79.38
-7.79%
|
11/6/2020
|
$71.88
|
PP = $74.76
|
|
MB = $78.50
|
Most Recent Note - 12/1/2020 6:50:48 PM
Y - Pulled back today with lighter (average) volume, slumping back below its pivot point and closing near the session low. Prior gain was backed by +74% above average volume as it rallied and closed above the pivot point triggering a technical buy signal. Reported earnings +32% on +24% sales revenues for the Sep '20 quarter versus the year ago period, an improvement after +3% earnings in the Jun quarter. Prior quarterly comparisons were near or above the +25% minimum earnings guideline (C criteria). Annual earnings (A criteria) growth has been strong, a good match with the fact-based investment system."
>>> FEATURED STOCK ARTICLE : Encountered Distributional Pressure as it Hit a New High - 11/9/2020 |
View all notes |
Set NEW NOTE alert |
Company Profile |
SEC
News |
Chart |
Request a new note
C
A
S
I |
TEAM
-
NASDAQ
Atlassian Corp Plc Cl A
Comp Sftwr-Spec Enterprs
|
$224.06
|
-0.99
-0.44% |
$226.00
|
1,330,186
70.91% of 50 DAV
50 DAV is 1,876,000
|
$228.97
-2.14%
|
10/12/2020
|
$193.77
|
PP = $199.60
|
|
MB = $209.58
|
Most Recent Note - 11/27/2020 2:24:51 PM
G - Hit a new all-time high with light volume behind today's 6th consecutive gain.. Found prompt support after undercutting the prior low ($180) but it has not formed a sound new base of sufficient length. Reported earnings +7% on +26% sales revenues for the Sep '20 quarter versus the year ago period, well below the +25% minimum earnings guideline (C criteria), raising concerns. See the latest FSU analysis for more details and a new annotated graph.
>>> FEATURED STOCK ARTICLE : Quiet Volume Behind Gain Today for a New All-Time High - 11/27/2020 |
View all notes |
Set NEW NOTE alert |
Company Profile |
SEC
News |
Chart |
Request a new note
C
A
S
I |
Symbol/Exchange
Company Name
Industry Group |
PRICE |
CHANGE
(%Change) |
Day High |
Volume
(% DAV)
(% 50 day avg vol) |
52 Wk Hi
% From Hi |
Featured
Date |
Price
Featured |
Pivot Featured |
|
Max Buy |
YETI
-
NYSE
Yeti Holdings Inc
Leisure-Products
|
$62.47
|
-0.70
-1.11% |
$64.13
|
745,392
60.65% of 50 DAV
50 DAV is 1,229,000
|
$64.37
-2.95%
|
11/5/2020
|
$57.25
|
PP = $55.14
|
|
MB = $57.90
|
Most Recent Note - 12/1/2020 6:28:15 PM
G - Pulled back for a 2nd consecutive loss today with lighter volume. Its 50 DMA line ($52.94) defines near-term support above prior lows.
>>> FEATURED STOCK ARTICLE : Finished Strong After Breakout Gain Was Noted in Mid-Day Report - 11/5/2020 |
View all notes |
Set NEW NOTE alert |
Company Profile |
SEC
News |
Chart |
Request a new note
C
A
S
I |
BJ
-
NYSE
B J S Whlsl Club Hldgs
Retail-DiscountandVariety
|
$40.40
|
-0.59
-1.44% |
$41.41
|
1,892,147
82.99% of 50 DAV
50 DAV is 2,280,000
|
$47.46
-14.88%
|
11/19/2020
|
$42.97
|
PP = $47.56
|
|
MB = $49.94
|
Most Recent Note - 12/1/2020 6:26:54 PM
G - Pulled back and closed below its 50 DMA line ($40.88) with a loss today on lighter volume and its color code is changed to green. A prompt rebound above the 50 DMA line is needed for its outlook to improve. Subsequent volume-driven gains above the pivot point may trigger a technical buy signal. Reported Oct '20 quarterly results +124% on +16% sales revenues versus the year ago period, its 3rd consecutive strong quarterly comparison above the +25% minimum guideline (C criteria), helping it better match with the fundamental guidelines of the fact-based investment system. Annual earnings growth (A criteria) has been strong. Completed its new IPO at $17 on 6/28/19. Has a new CEO as of 2/03/20.
>>> FEATURED STOCK ARTICLE : Rebounding Near High With 3rd Strong Quarterly Report - 11/19/2020 |
View all notes |
Set NEW NOTE alert |
Company Profile |
SEC
News |
Chart |
Request a new note
C
A
S
I |
AAXN
-
NASDAQ
Axon Enterprise Inc
Security/Sfty
|
$125.26
|
-0.43
-0.34% |
$127.40
|
483,927
87.99% of 50 DAV
50 DAV is 550,000
|
$130.41
-3.95%
|
11/6/2020
|
$122.75
|
PP = $113.00
|
|
MB = $118.65
|
Most Recent Note - 11/27/2020 2:27:26 PM
G - Pulled back with lighter volume today after wedging to new high territory with gains lacking volume conviction. Recently reported Sep '20 quarterly earnings +43% on +27% sales revenues versus the year ago period. It broke out of a cup-with-high-handle base with volume drying up during the handle.
>>> FEATURED STOCK ARTICLE : Breakaway Gap From Cup-With-High-Handle Pattern - 11/6/2020 |
View all notes |
Set NEW NOTE alert |
Company Profile |
SEC
News |
Chart |
Request a new note
C
A
S
I |
QTWO
-
NYSE
Q2 Holdings Inc
Computer Sftwr-Financial
|
$113.32
|
-0.05
-0.04% |
$114.21
|
805,855
211.51% of 50 DAV
50 DAV is 381,000
|
$116.95
-3.10%
|
11/12/2020
|
$105.14
|
PP = $106.54
|
|
MB = $111.87
|
Most Recent Note - 12/1/2020 6:30:02 PM
G - Pulled back today with higher volume yet found support and ended near the session high. Showed great earning increases with strong underlying sales revenues growth for the Jun and Sep '20 quarters versus the year ago periods. Annual earnings growth has been strong. Completed new Public Offerings on 6/06/19 and 5/13/20.
>>> FEATURED STOCK ARTICLE : Churning Action Near Prior High Indicative of Distributional Pressure - 11/12/2020 |
View all notes |
Set NEW NOTE alert |
Company Profile |
SEC
News |
Chart |
Request a new note
C
A
S
I |
|
|
|
THESE ARE NOT BUY RECOMMENDATIONS!
Comments contained in the body of this report are technical
opinions only. The material herein has been obtained
from sources believed to be reliable and accurate, however,
its accuracy and completeness cannot be guaranteed.
This site is not an investment advisor, hence it does
not endorse or recommend any securities or other investments.
Any recommendation contained in this report may not
be suitable for all investors and it is not to be deemed
an offer or solicitation on our part with respect to
the purchase or sale of any securities. All trademarks,
service marks and trade names appearing in this report
are the property of their respective owners, and are
likewise used for identification purposes only.
This report is a service available
only to active Paid Premium Members.
You may opt-out of receiving report notifications
at any time. Questions or comments may be submitted
by writing to Premium Membership Services 665 S.E. 10 Street, Suite 201 Deerfield Beach, FL 33441-5634 or by calling 1-800-965-8307
or 954-785-1121.
|
|
|