You are not logged in.
This means you
CAN ONLY VIEW reports that were published prior to Wednesday, February 28, 2024.
You
MUST UPGRADE YOUR MEMBERSHIP if you want to see any current reports.
AFTER MARKET UPDATE - MONDAY, NOVEMBER 30TH, 2020
Previous After Market Report Next After Market Report >>>
|
|
|
|
DOW |
-271.73 |
29,638.64 |
-0.91% |
|
Volume |
1,851,414,390 |
+249% |
|
Volume |
7,676,964,700 |
+131% |
|
NASDAQ |
-7.11 |
12,198.74 |
-0.06% |
|
Advancers |
953 |
31% |
|
Advancers |
1,329 |
37% |
|
S&P 500 |
-16.72 |
3,621.63 |
-0.46% |
|
Decliners |
2,116 |
69% |
|
Decliners |
2,257 |
63% |
|
Russell 2000 |
-35.45 |
1,819.82 |
-1.91% |
|
52 Wk Highs |
170 |
|
|
52 Wk Highs |
287 |
|
|
S&P 600 |
-25.16 |
1,034.51 |
-2.37% |
|
52 Wk Lows |
4 |
|
|
52 Wk Lows |
6 |
|
|
 |
Major Indices Pulled Back Yet Ended November With Solid Gains
Kenneth J. Gruneisen - Passed the CAN SLIM® Master's Exam
The Dow fell 271 points, but closed out its best monthly performance since 1987 with a 11.8% gain. The S&P 500 fell 0.5%, paring its monthly advance to 10.8%, while the Nasdaq Composite slipped 0.1% for the day but climbed 11.8% for November. Both benchmarks notched their best monthly increase since April. Meanwhile, the small cap Russell 2000 Index saw its best monthly rally on record, surging more than 18%. The volume totals on Monday were clearly higher than the prior shortened session on the NYSE and on the Nasdaq exchange. Breadth was negative as decliners led advancers by more than a 2-1 margin on the NYSE and by nearly 2-1 on the Nasdaq exchange. There were 43 high-ranked companies from the Leaders List that hit new 52-week highs and were listed on the BreakOuts Page, versus the total of 59 on the prior session. New 52-week highs totals solidly outnumbered new 52-week lows totals on both exchanges. The major indices confirmed a new uptrend (M criteria) with recent follow-through gains backed by higher volume and more leadership. Investors are reminded to always make buying and selling decisions based based on the strict criteria and rules of the fact-based investment system. 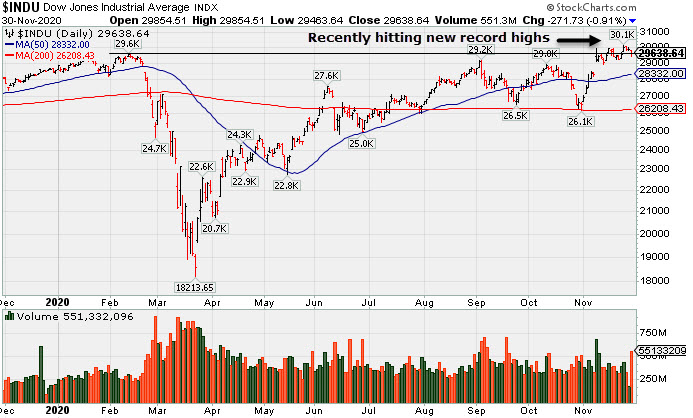 PICTURED: The Dow Jones Industrial Average recently rallied to a new record high.
Stocks ended lower on Monday, as investors continued to digest an uptick in COVID infections and hospitalization rates alongside encouraging updates on the vaccine front. In COVID news, Moderna jumped nearly 20% after announcing that its vaccine candidate was more than 94% effective in preventing Covid-19, and that it would ask U.S. and European officials for emergency-use authorization. Meanwhile, Los Angeles county became the latest major metropolitan area to announce it would impose stay-at-home orders over the weekend, as U.S. hospitalizations remained elevated at a record level. On the data front, pending home sales unexpectedly declined 1.1% in October, while manufacturing activity in the Dallas Fed region expanded at a slower-than-anticipated pace in November. Treasuries were mixed, with the yield on the 10-year note adding one basis point to 0.85%.
Nine of 11 S&P 500 sectors ended in negative territory, with the two best performing sectors for November (Energy and Financials) lagging the most. In M&A news, S&P Global (SPGI +2.99%) rose after announcing an all-stock deal to acquire IHS Markit (INFO +7.43%) in a deal valued at $44 billion. |
 Kenneth J. Gruneisen started out as a licensed stockbroker in August 1987, a couple of months prior to the historic stock market crash that took the Dow Jones Industrial Average down -22.6% in a single day. He has published daily fact-based fundamental and technical analysis on high-ranked stocks online for two decades. Through FACTBASEDINVESTING.COM, Kenneth provides educational articles, news, market commentary, and other information regarding proven investment systems that work in good times and bad.
Comments contained in the body of this report are technical opinions only and are not necessarily those of Gruneisen Growth Corp. The material herein has been obtained from sources believed to be reliable and accurate, however, its accuracy and completeness cannot be guaranteed. Our firm, employees, and customers may effect transactions, including transactions contrary to any recommendation herein, or have positions in the securities mentioned herein or options with respect thereto. Any recommendation contained in this report may not be suitable for all investors and it is not to be deemed an offer or solicitation on our part with respect to the purchase or sale of any securities. |
|
 |
Gold & Silver Index and Semiconductor Index Rose
Kenneth J. Gruneisen - Passed the CAN SLIM® Master's Exam
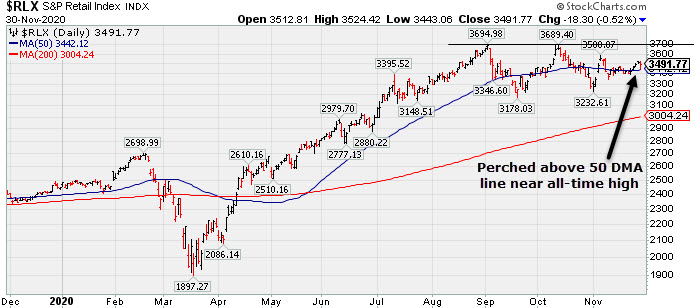
The Bank Index ($BKX -2.94%) and Broker/Dealer Index ($XBD -1.75%) both created a drag on the major indices and the Retail Index ($RLX -0.52%) edged lower. The Semiconductor Index ($SOX +1.21%) led the tech sector while the Biotech Index ($BTK -0.12%) finished flat and the Networking Index ($NWX -1.42%) slumped. The Oil Services Index ($OSX -6.41%) and Integrated Oil Index ($XOI -6.33%) both were standout decliners, meanwhile, the Gold & Silver Index ($XAU +0.72%) posted a small gain.
PICTURED: The Retail Index ($RLX -0.52%) is perched above its 50-day moving average (DMA) line near its all-time high.
| Oil Services |
$OSX |
39.32 |
-2.69 |
-6.41% |
-49.78% |
| Integrated Oil |
$XOI |
746.47 |
-50.48 |
-6.33% |
-41.25% |
| Semiconductor |
$SOX |
2,663.49 |
+31.93 |
+1.21% |
+44.00% |
| Networking |
$NWX |
639.70 |
-9.20 |
-1.42% |
+9.65% |
| Broker/Dealer |
$XBD |
346.41 |
-6.18 |
-1.75% |
+19.30% |
| Retail |
$RLX |
3,491.77 |
-18.30 |
-0.52% |
+42.56% |
| Gold & Silver |
$XAU |
134.72 |
+0.97 |
+0.72% |
+26.00% |
| Bank |
$BKX |
90.34 |
-2.74 |
-2.94% |
-20.30% |
| Biotech |
$BTK |
5,504.98 |
-6.60 |
-0.12% |
+8.63% |
|
|
|
 |
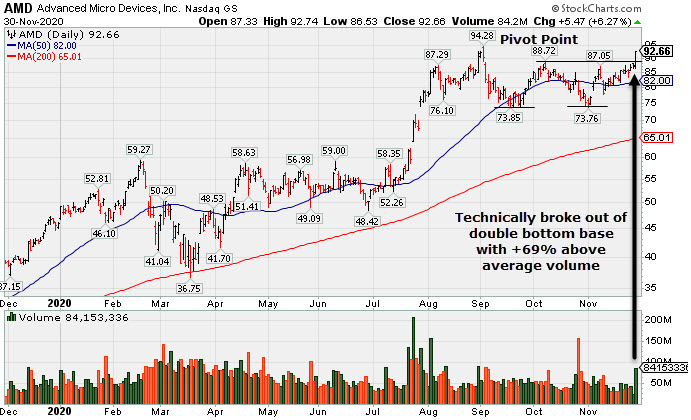
Volume Heavy Behind AMD's Breakout from Double Bottom Base
Kenneth J. Gruneisen - Passed the CAN SLIM® Master's Exam
Advanced Micro Devices (AMD +$5.47 or +6.27% to $92.66) rallied above the previously cited pivot point ofa "double bottom" base with today's big gain backed by +69% above average volume triggering a technical buy signal. Its 50-day moving average (DMA) line ($82) defines important near term support. In recent weeks it was noted - "Subsequent gains above the pivot point backed by at least +40% above average volume are needed to trigger trigger a technical buy signal."
It reported earnings +128% on +56% sales revenues for the Sep '20 quarter versus the year ago period and announced plans to acquire Xilinx Inc (XLNX). The 5 latest quarterly comparisons through Sep '20 showed very strong earnings increases w ell above the +25% minimum guideline (C criteria) with strong underlying sales revenues growth versus the year ago periods. Annual earnings growth (A criteria) has been very strong after losses in FY '15 and '16. it has a highest possible 99 Earnings Per Share Rating.
AMD hails from the Electronics - Semiconductor Fabless industry which has a Group Relative Strength Rating of 85 (L criteria). It has a large supply of 1.20 billion shares outstanding (S criteria), which makes it less likely to be a quick sprinter. However, the number of top-rated funds owning its shares rose from 1,669 in Jun '19 to 2,329 in Sep '20, a reassuring sign concerning the I criteria. Its current Up/Down Volume Ratio of 1.1 is an unbiased indication its shares have been under slight acumulation over the past 50 days. It has a Timeliness Rating of A, a Sponsorship Rating of B, and an Accumulation/Distribution rating of C+.
|
|
|
Color Codes Explained :
Y - Better candidates highlighted by our
staff of experts.
G - Previously featured
in past reports as yellow but may no longer be buyable under the
guidelines.
***Last / Change / Volume data in this table is the closing quote data***
Symbol/Exchange
Company Name
Industry Group |
PRICE |
CHANGE
(%Change) |
Day High |
Volume
(% DAV)
(% 50 day avg vol) |
52 Wk Hi
% From Hi |
Featured
Date |
Price
Featured |
Pivot Featured |
|
Max Buy |
 CRL
-
NYSE
CRL
-
NYSE
Charles River Labs Intl
DRUGS - Biotechnology
|
$234.52
|
+4.36
1.89% |
$236.17
|
316,380
97.05% of 50 DAV
50 DAV is 326,000
|
$257.88
-9.06%
|
7/15/2020
|
$192.66
|
PP = $189.95
|
|
MB = $199.45
|
 Most Recent Note - 11/30/2020 6:27:35 PM
G - The prompt rebound above its 50 DMA line ($232.62) helped its outlook improve. Reported Sep '20 quarterly earnings +38% on +11% sales revenues versus the year ago period, above the +25% minimum earnings guideline (C criteria).
>>> FEATURED STOCK ARTICLE : Consolidating Near Important Support Levels - 11/23/2020 |
View all notes |
Set NEW NOTE alert |
Company Profile |
SEC
News |
Chart |
Request a new note
C
A
S
I |
AMD
-
NASDAQ
Advanced Micro Devices
ELECTRONICS - Semiconductor - Broad Line
|
$92.66
|
+5.47
6.27% |
$92.74
|
84,104,688
169.46% of 50 DAV
50 DAV is 49,631,000
|
$94.28
-1.72%
|
11/18/2020
|
$82.54
|
PP = $88.72
|
|
MB = $93.16
|
Most Recent Note - 11/30/2020 6:23:10 PM
Y - Rallied above pivot point with today's big gain backed by +69% above average volume triggering a technical buy signal. Its 50 DMA line ($82) defines important near term support. See the latest FSU analysis for more details and a new annotated graph.
>>> FEATURED STOCK ARTICLE : Volume Heavy Behind AMD's Breakout from Double Bottom Base - 11/30/2020 |
View all notes |
Set NEW NOTE alert |
Company Profile |
SEC
News |
Chart |
Request a new note
C
A
S
I |
TER
-
NASDAQ
Teradyne Inc
ELECTRONICS - Semiconductor Equipment and Mate
|
$110.34
|
+0.94
0.86% |
$110.64
|
1,560,339
72.84% of 50 DAV
50 DAV is 2,142,000
|
$110.83
-0.44%
|
10/21/2020
|
$92.22
|
PP = $93.54
|
|
MB = $98.22
|
Most Recent Note - 11/30/2020 6:10:06 PM
G - Posted another gain today with below average volume for new all-time high close. Reported earnings +53% on +41% sales revenues for the Sep '20 quarter versus the year ago period, its 4th consecutive quarterly comparison with earnings above the +25% minimum earnings guideline (C criteria). Sequential comparisons show encouraging acceleration in its sales revenues growth rate. Its annual earnings (A criteria) history has been strong.
>>> FEATURED STOCK ARTICLE : Recent Gains for New Highs Lacked Great Volume Conviction - 11/11/2020 |
View all notes |
Set NEW NOTE alert |
Company Profile |
SEC
News |
Chart |
Request a new note
C
A
S
I |
TREX
-
NYSE
Trex Company Inc
MATERIALS and CONSTRUCTION - General Building Materials
|
$74.82
|
+0.19
0.25% |
$75.86
|
554,689
71.94% of 50 DAV
50 DAV is 771,000
|
$81.23
-7.89%
|
6/26/2020
|
$54.53
|
PP = $66.47
|
|
MB = $69.79
|
Most Recent Note - 11/27/2020 2:25:48 PM
G - Posted a quiet gain today while consolidating above its 50 DMA line ($73.40). Found support when testing the prior low ($63.32 on 9/21/20). Recently noted that it reported Sep '20 quarterly earnings +14% on +19% sales revenues versus the year ago period, below the +25% minimum guideline (C criteria) raising fundamental concerns.
>>> FEATURED STOCK ARTICLE : Rebound Above 50-Day Moving Average Helped Technical Stance - 11/4/2020 |
View all notes |
Set NEW NOTE alert |
Company Profile |
SEC
News |
Chart |
Request a new note
C
A
S
I |
CLFD
-
NASDAQ
Clearfield Inc
TELECOMMUNICATIONS - Cables / Satalite Equipment
|
$23.78
|
+0.23
0.98% |
$25.25
|
166,735
183.23% of 50 DAV
50 DAV is 91,000
|
$25.97
-8.43%
|
11/17/2020
|
$22.06
|
PP = $26.07
|
|
MB = $27.37
|
Most Recent Note - 11/30/2020 12:18:39 PM
Y - Erased an early gain today after challenging its 52-week high. Near term support is defined by its 50 DMA line ($22.05) and an upward trendline. It has formed an advanced "ascending base" marked by 3 pullbacks of 10-20% after a big breakaway gap on 7/24/20. Subsequent gains above the pivot point marked by +40% above average volume are needed to trigger a proper technical buy signal. Reported earnings +57% on +14% sales revenues for the Sep '20 quarter versus the year ago period, its 3rd consecutive quarterly earnings comparison above the +25% minimum guideline (C criteria). Annual earnings (A criteria) history has improved after a downturn in FY '17.
>>> FEATURED STOCK ARTICLE : Formed Ascending Base Following Earlier Breakway Gap - 11/17/2020 |
View all notes |
Set NEW NOTE alert |
Company Profile |
SEC
News |
Chart |
Request a new note
C
A
S
I |
Symbol/Exchange
Company Name
Industry Group |
PRICE |
CHANGE
(%Change) |
Day High |
Volume
(% DAV)
(% 50 day avg vol) |
52 Wk Hi
% From Hi |
Featured
Date |
Price
Featured |
Pivot Featured |
|
Max Buy |
LGIH
-
NASDAQ
L G I Homes Inc
Bldg-Resident/Comml
|
$108.05
|
-3.54
-3.17% |
$111.41
|
282,254
108.56% of 50 DAV
50 DAV is 260,000
|
$132.98
-18.75%
|
10/1/2020
|
$123.17
|
PP = $124.04
|
|
MB = $130.24
|
Most Recent Note - 11/30/2020 6:24:38 PM
G - Still sputtering below its 50 DMA line ($116) which has acted as resistance after damaging volume-driven losses. The longer it lingers there the worse its outlook gets. A rebound above the 50 DMA line is needed for its outlook to improve. Reported Sep '20 quarterly earnings +27% on +11% sales revenues versus the year ago period.
>>> FEATURED STOCK ARTICLE : Rebound Toward 50-Day Average Which May Act as Resistance - 11/10/2020 |
View all notes |
Set NEW NOTE alert |
Company Profile |
SEC
News |
Chart |
Request a new note
C
A
S
I |
NOW
-
NYSE
Servicenow Inc
Computer Sftwr-Enterprse
|
$534.55
|
+7.07
1.34% |
$535.00
|
1,716,253
134.93% of 50 DAV
50 DAV is 1,272,000
|
$537.53
-0.55%
|
8/20/2020
|
$453.34
|
PP = $454.79
|
|
MB = $477.53
|
Most Recent Note - 11/30/2020 6:26:10 PM
G - Posted a gain with above average volume for its second best ever close. Tested the prior low ($472 on 11/03/20) noted as important support where a damaging violation raises greater concerns. Recently reported Sep '20 quarterly earnings +22% on +30% sales revenues versus the year ago period, below the +25% minimum guideline (C criteria) of the fact-based investment system.
>>> FEATURED STOCK ARTICLE : Consolidating Above 50-Day Average Still Perched Near All-Time High - 11/24/2020 |
View all notes |
Set NEW NOTE alert |
Company Profile |
SEC
News |
Chart |
Request a new note
C
A
S
I |
VEEV
-
NYSE
Veeva Systems Inc Cl A
Computer Sftwr-Medical
|
$276.87
|
+0.42
0.15% |
$279.75
|
1,269,803
150.45% of 50 DAV
50 DAV is 844,000
|
$313.99
-11.82%
|
10/6/2020
|
$287.71
|
PP = $298.86
|
|
MB = $313.80
|
Most Recent Note - 11/27/2020 2:35:17 PM
G - Posted a solid gain today with below average volume. A rebound above the 50 DMA line ($282) still is needed to help its outlook improve. Faces resistance due to overhead supply up to the $314 area.
>>> FEATURED STOCK ARTICLE : Weak Technical Action Raised Recent Concerns - 11/16/2020 |
View all notes |
Set NEW NOTE alert |
Company Profile |
SEC
News |
Chart |
Request a new note
C
A
S
I |
ALRM
-
NASDAQ
Alarm.com Holdings Inc
Security/Sfty
|
$75.91
|
+1.49
2.00% |
$76.00
|
596,885
172.51% of 50 DAV
50 DAV is 346,000
|
$79.38
-4.37%
|
11/6/2020
|
$71.88
|
PP = $74.76
|
|
MB = $78.50
|
Most Recent Note - 11/27/2020 2:28:43 PM
Y - Posted a gain today with light volume for its second-best ever close. Previously noted - "Subsequent gains above the pivot point may help clinch a convincing technical buy signal. Reported earnings +32% on +24% sales revenues for the Sep '20 quarter versus the year ago period, an improvement after +3% earnings in the Jun quarter. Prior quarterly comparisons were near or above the +25% minimum earnings guideline (C criteria). Annual earnings (A criteria) growth has been strong, a good match with the fact-based investment system."
>>> FEATURED STOCK ARTICLE : Encountered Distributional Pressure as it Hit a New High - 11/9/2020 |
View all notes |
Set NEW NOTE alert |
Company Profile |
SEC
News |
Chart |
Request a new note
C
A
S
I |
TEAM
-
NASDAQ
Atlassian Corp Plc Cl A
Comp Sftwr-Spec Enterprs
|
$225.05
|
+1.05
0.47% |
$228.97
|
1,504,908
80.52% of 50 DAV
50 DAV is 1,869,000
|
$224.00
0.47%
|
10/12/2020
|
$193.77
|
PP = $199.60
|
|
MB = $209.58
|
Most Recent Note - 11/27/2020 2:24:51 PM
G - Hit a new all-time high with light volume behind today's 6th consecutive gain.. Found prompt support after undercutting the prior low ($180) but it has not formed a sound new base of sufficient length. Reported earnings +7% on +26% sales revenues for the Sep '20 quarter versus the year ago period, well below the +25% minimum earnings guideline (C criteria), raising concerns. See the latest FSU analysis for more details and a new annotated graph.
>>> FEATURED STOCK ARTICLE : Quiet Volume Behind Gain Today for a New All-Time High - 11/27/2020 |
View all notes |
Set NEW NOTE alert |
Company Profile |
SEC
News |
Chart |
Request a new note
C
A
S
I |
Symbol/Exchange
Company Name
Industry Group |
PRICE |
CHANGE
(%Change) |
Day High |
Volume
(% DAV)
(% 50 day avg vol) |
52 Wk Hi
% From Hi |
Featured
Date |
Price
Featured |
Pivot Featured |
|
Max Buy |
YETI
-
NYSE
Yeti Holdings Inc
Leisure-Products
|
$63.17
|
-1.01
-1.57% |
$64.29
|
1,182,346
93.32% of 50 DAV
50 DAV is 1,267,000
|
$64.37
-1.86%
|
11/5/2020
|
$57.25
|
PP = $55.14
|
|
MB = $57.90
|
Most Recent Note - 11/25/2020 5:04:37 PM
G - Posted a 2nd consecutive gain today with light volume hitting another new all-time high. Its 50 DMA line ($51.86) defines near-term support above prior lows.
>>> FEATURED STOCK ARTICLE : Finished Strong After Breakout Gain Was Noted in Mid-Day Report - 11/5/2020 |
View all notes |
Set NEW NOTE alert |
Company Profile |
SEC
News |
Chart |
Request a new note
C
A
S
I |
BJ
-
NYSE
B J S Whlsl Club Hldgs
Retail-DiscountandVariety
|
$40.99
|
-0.55
-1.32% |
$41.94
|
2,469,431
106.12% of 50 DAV
50 DAV is 2,327,000
|
$47.46
-13.63%
|
11/19/2020
|
$42.97
|
PP = $47.56
|
|
MB = $49.94
|
Most Recent Note - 11/25/2020 5:00:12 PM
Y - Pulled back toward its 50 DMA line ($40.83) with a loss today on light volume. Facing some near-term resistance. Highlighted in yellow in the 11/19/20 mid-day report with pivot point cited based on its 8/26/20 high plus 10 cents. Subsequent volume-driven gains above the pivot point may trigger a technical buy signal. Reported Oct '20 quarterly results +124% on +16% sales revenues versus the year ago period, its 3rd consecutive strong quarterly comparison above the +25% minimum guideline (C criteria), helping it better match with the fundamental guidelines of the fact-based investment system. Annual earnings growth (A criteria) has been strong. Completed its new IPO at $17 on 6/28/19. Has a new CEO as of 2/03/20.
>>> FEATURED STOCK ARTICLE : Rebounding Near High With 3rd Strong Quarterly Report - 11/19/2020 |
View all notes |
Set NEW NOTE alert |
Company Profile |
SEC
News |
Chart |
Request a new note
C
A
S
I |
AAXN
-
NASDAQ
Axon Enterprise Inc
Security/Sfty
|
$125.69
|
+0.14
0.11% |
$127.39
|
384,072
68.71% of 50 DAV
50 DAV is 559,000
|
$130.41
-3.62%
|
11/6/2020
|
$122.75
|
PP = $113.00
|
|
MB = $118.65
|
Most Recent Note - 11/27/2020 2:27:26 PM
G - Pulled back with lighter volume today after wedging to new high territory with gains lacking volume conviction. Recently reported Sep '20 quarterly earnings +43% on +27% sales revenues versus the year ago period. It broke out of a cup-with-high-handle base with volume drying up during the handle.
>>> FEATURED STOCK ARTICLE : Breakaway Gap From Cup-With-High-Handle Pattern - 11/6/2020 |
View all notes |
Set NEW NOTE alert |
Company Profile |
SEC
News |
Chart |
Request a new note
C
A
S
I |
QTWO
-
NYSE
Q2 Holdings Inc
Computer Sftwr-Financial
|
$113.37
|
-1.73
-1.50% |
$116.22
|
543,623
140.83% of 50 DAV
50 DAV is 386,000
|
$116.95
-3.06%
|
11/12/2020
|
$105.14
|
PP = $106.54
|
|
MB = $111.87
|
Most Recent Note - 11/27/2020 2:31:17 PM
G - Holding its ground stubbornly with volume totals cooling while perched at its all-time high, extended from the previously noted base. Showed great earning increases with strong underlying sales revenues growth for the Jun and Sep '20 quarters versus the year ago periods. Annual earnings growth has been strong. Completed new Public Offerings on 6/06/19 and 5/13/20.
>>> FEATURED STOCK ARTICLE : Churning Action Near Prior High Indicative of Distributional Pressure - 11/12/2020 |
View all notes |
Set NEW NOTE alert |
Company Profile |
SEC
News |
Chart |
Request a new note
C
A
S
I |
|
|
|
THESE ARE NOT BUY RECOMMENDATIONS!
Comments contained in the body of this report are technical
opinions only. The material herein has been obtained
from sources believed to be reliable and accurate, however,
its accuracy and completeness cannot be guaranteed.
This site is not an investment advisor, hence it does
not endorse or recommend any securities or other investments.
Any recommendation contained in this report may not
be suitable for all investors and it is not to be deemed
an offer or solicitation on our part with respect to
the purchase or sale of any securities. All trademarks,
service marks and trade names appearing in this report
are the property of their respective owners, and are
likewise used for identification purposes only.
This report is a service available
only to active Paid Premium Members.
You may opt-out of receiving report notifications
at any time. Questions or comments may be submitted
by writing to Premium Membership Services 665 S.E. 10 Street, Suite 201 Deerfield Beach, FL 33441-5634 or by calling 1-800-965-8307
or 954-785-1121.
|
|
|