***Last / Change / Volume data in this table is the closing quote data***
Symbol/Exchange
Company Name
Industry Group |
PRICE |
CHANGE
(%Change) |
Day High |
Volume
(% DAV)
(% 50 day avg vol) |
52 Wk Hi
% From Hi |
Featured
Date |
Price
Featured |
Pivot Featured |
|
Max Buy |
AAPL
-
NASDAQ
Apple Inc
COMPUTER HARDWARE - Personal Computers
|
$384.62
|
-0.60
-0.16% |
$388.70
|
23,328,311
114.71% of 50 DAV
50 DAV is 20,337,600
|
$426.70
-9.86%
|
9/16/2011
|
$399.14
|
PP = $404.60
|
|
MB = $424.83
|
 Most Recent Note - 11/11/2011 3:29:29 PM
G - Slumping below its 50 DMA line and raising concerns with a 3rd consecutive loss. Gains in recent weeks lacked volume conviction while it has endured distributional pressure. Its 200 DMA line defines the next important chart support to watch.
>>> The latest Featured Stock Update with an annotated graph appeared on 10/20/2011. Click here.
View all notes |
Alert me of new notes |
CANSLIM.net Company Profile |
SEC |
Zacks Reports |
StockTalk |
News |
Chart |
Request a new note
C
A N
S L
I M


|
ADS
-
NYSE
Alliance Data Sys Corp
COMPUTER SOFTWARE and SERVICES - Information and Delivery Service
|
$101.95
|
+1.45
1.44% |
$102.70
|
343,507
36.16% of 50 DAV
50 DAV is 949,900
|
$107.18
-4.88%
|
10/21/2011
|
$97.94
|
PP = $101.15
|
|
MB = $106.21
|
Most Recent Note - 11/11/2011 3:31:48 PM
Y - Volume totals have been cooling while consolidating near its pivot point in recent weeks. Prior chart highs in the $101 define support to watch well above its 50 DMA line.
>>> The latest Featured Stock Update with an annotated graph appeared on 10/21/2011. Click here.
View all notes |
Alert me of new notes |
CANSLIM.net Company Profile |
SEC |
Zacks Reports |
StockTalk |
News |
Chart |
Request a new note
C
A N
S L
I M
|
ALXN
-
NASDAQ
Alexion Pharmaceuticals
DRUGS - Drug Manufacturers - Other
|
$64.25
|
+0.65
1.02% |
$64.72
|
1,096,041
72.05% of 50 DAV
50 DAV is 1,521,300
|
$70.42
-8.76%
|
9/15/2011
|
$63.20
|
PP = $60.81
|
|
MB = $63.85
|
Most Recent Note - 11/11/2011 3:34:45 PM
G - Posting a quiet gain today, halting a 4 session losing streak near its 50 DMA line. It has been weeks since volume has indicated any great decisiveness in direction.
>>> The latest Featured Stock Update with an annotated graph appeared on 10/18/2011. Click here.
View all notes |
Alert me of new notes |
CANSLIM.net Company Profile |
SEC |
Zacks Reports |
StockTalk |
News |
Chart |
Request a new note
C
A N
S L
I M
|
CATM
-
NASDAQ
Cardtronics Inc
DIVERSIFIED SERVICES - Business/Management Services
|
$26.92
|
+0.80
3.06% |
$27.42
|
334,114
79.23% of 50 DAV
50 DAV is 421,700
|
$28.46
-5.41%
|
11/8/2011
|
$25.99
|
PP = $25.95
|
|
MB = $27.25
|
Most Recent Note - 11/11/2011 1:55:14 PM
Y - Poised to possibly finish the week with its best ever close if the quiet gap up gain today holds up. Prior highs in the $26 area acted as support following its 11/08/11 breakout. See the latest FSU analysis for more details and an annotated graph.
>>> The latest Featured Stock Update with an annotated graph appeared on 11/8/2011. Click here.
View all notes |
Alert me of new notes |
CANSLIM.net Company Profile |
SEC |
Zacks Reports |
StockTalk |
News |
Chart |
Request a new note
C
A N
S L
I M
|
CELG
-
NASDAQ
Celgene Corp
DRUGS - Drug Manufacturers - Major
|
$64.57
|
+0.26
0.40% |
$64.96
|
4,933,734
128.43% of 50 DAV
50 DAV is 3,841,700
|
$68.25
-5.39%
|
9/16/2011
|
$61.21
|
PP = $62.59
|
|
MB = $65.72
|
Most Recent Note - 11/11/2011 12:37:56 PM
Y -Still consolidating just above its 50 DMA line defining important near-term chart support. A violation of its short-term average and recent chart low ($62.71 on 11/01/11) would raise concerns and trigger technical sell signals.
>>> The latest Featured Stock Update with an annotated graph appeared on 11/7/2011. Click here.
View all notes |
Alert me of new notes |
CANSLIM.net Company Profile |
SEC |
Zacks Reports |
StockTalk |
News |
Chart |
Request a new note
C
A N
S L
I M
|
Symbol/Exchange
Company Name
Industry Group |
PRICE |
CHANGE
(%Change) |
Day High |
Volume
(% DAV)
(% 50 day avg vol) |
52 Wk Hi
% From Hi |
Featured
Date |
Price
Featured |
Pivot Featured |
|
Max Buy |
CEVA
-
NASDAQ
Ceva Inc
ELECTRONICS - Semiconductor - Specialized
|
$30.21
|
+0.82
2.79% |
$30.55
|
169,071
71.55% of 50 DAV
50 DAV is 236,300
|
$35.60
-15.14%
|
10/28/2011
|
$34.38
|
PP = $35.70
|
|
MB = $37.49
|
Most Recent Note - 11/11/2011 1:57:55 PM
Y - Consolidating above prior highs since its gap up on 10/27/11 helped it break out of a "double bottom" base pattern. In the 10/28/11 mid-day report (read here) it was featured again in yellow with pivot point based on its 52-week high plus 10 cents while rallying from a larger cup shaped base. It has encountered distributional pressure since, while volume-driven gains above its pivot point are needed to trigger a new (or add-on) technical buy signal.
>>> The latest Featured Stock Update with an annotated graph appeared on 11/2/2011. Click here.
View all notes |
Alert me of new notes |
CANSLIM.net Company Profile |
SEC |
Zacks Reports |
StockTalk |
News |
Chart |
Request a new note
C
A N
S L
I M
|
FEIC
-
NASDAQ
F E I Co
ELECTRONICS - Diversified Electronics
|
$40.07
|
+1.37
3.54% |
$40.25
|
288,065
65.93% of 50 DAV
50 DAV is 436,900
|
$42.25
-5.16%
|
10/28/2011
|
$40.31
|
PP = $40.88
|
|
MB = $42.92
|
Most Recent Note - 11/11/2011 2:00:14 PM
Y - Gain today on quiet volume has halted its slide after a pullback below its pivot point raised concerns. Disciplined investors limit losses if a stock falls more than -7% from their purchase price.
>>> The latest Featured Stock Update with an annotated graph appeared on 10/28/2011. Click here.
View all notes |
Alert me of new notes |
CANSLIM.net Company Profile |
SEC |
Zacks Reports |
StockTalk |
News |
Chart |
Request a new note
C
A N
S L
I M
|
GNC
-
NYSE
G N C Holdings Inc
RETAIL - Drug Stores
|
$26.77
|
+0.79
3.04% |
$26.97
|
1,156,045
90.01% of 50 DAV
50 DAV is 1,284,300
|
$27.13
-1.33%
|
10/26/2011
|
$24.60
|
PP = $24.80
|
|
MB = $26.04
|
Most Recent Note - 11/11/2011 2:02:43 PM
G - Rallying above its "max buy" level today. Cooling volume totals have been noted as an indication that few are rushing for the exits following the recent Secondary Offering completed on 10/15/11. Recent chart lows (near $23.80) define near term support to watch above its 50 DMA line.
>>> The latest Featured Stock Update with an annotated graph appeared on 10/26/2011. Click here.
View all notes |
Alert me of new notes |
CANSLIM.net Company Profile |
SEC |
Zacks Reports |
StockTalk |
News |
Chart |
Request a new note
C
A N
S L
I M
|
HMSY
-
NASDAQ
H M S Holdings Corp
COMPUTER SOFTWARE and SERVICES - Healthcare Information Service
|
$30.56
|
+0.97
3.28% |
$30.79
|
666,175
98.17% of 50 DAV
50 DAV is 678,600
|
$30.82
-0.84%
|
10/27/2011
|
$26.44
|
PP = $28.37
|
|
MB = $29.79
|
Most Recent Note - 11/11/2011 2:04:23 PM
G - Small gap up today has it poised for a possible best-ever close. Prior highs in the $27-28 area define support to watch on pullbacks.
>>> The latest Featured Stock Update with an annotated graph appeared on 11/4/2011. Click here.
View all notes |
Alert me of new notes |
CANSLIM.net Company Profile |
SEC |
Zacks Reports |
StockTalk |
News |
Chart |
Request a new note
C
A N
S L
I M
|
ISRG
-
NASDAQ
Intuitive Surgical Inc
HEALTH SERVICES - Medical Appliances and Equipment
|
$439.99
|
+10.45
2.43% |
$441.89
|
221,691
53.72% of 50 DAV
50 DAV is 412,700
|
$443.00
-0.68%
|
10/19/2011
|
$424.69
|
PP = $415.29
|
|
MB = $436.05
|
Most Recent Note - 11/11/2011 2:06:49 PM
G - Up today on light volume while trading near its all-time high with no resistance remaining due to overhead supply. Prior highs define important support to watch on pullbacks.
>>> The latest Featured Stock Update with an annotated graph appeared on 10/19/2011. Click here.
View all notes |
Alert me of new notes |
CANSLIM.net Company Profile |
SEC |
Zacks Reports |
StockTalk |
News |
Chart |
Request a new note
C
A N
S L
I M
|
Symbol/Exchange
Company Name
Industry Group |
PRICE |
CHANGE
(%Change) |
Day High |
Volume
(% DAV)
(% 50 day avg vol) |
52 Wk Hi
% From Hi |
Featured
Date |
Price
Featured |
Pivot Featured |
|
Max Buy |
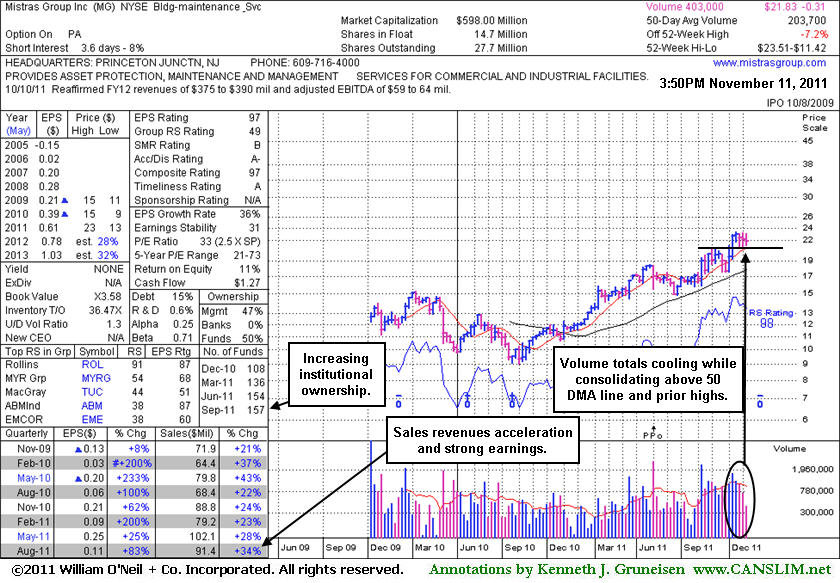
MG
-
NYSE
Mistras Group Inc
DIVERSIFIED SERVICES - Bulding and Faci;ity Management Services
|
$21.84
|
+0.26
1.20% |
$21.97
|
59,142
28.56% of 50 DAV
50 DAV is 207,100
|
$23.51
-7.10%
|
10/28/2011
|
$22.49
|
PP = $23.61
|
|
MB = $24.79
|
Most Recent Note - 11/11/2011 4:44:00 PM
Y - Volume totals have been cooling while consolidating above its 50 DMA line and prior highs defining chart support near $21. See the latest FSU analysis for more details and a new annotated weekly graph.
>>> The latest Featured Stock Update with an annotated graph appeared on 11/11/2011. Click here.
View all notes |
Alert me of new notes |
CANSLIM.net Company Profile |
SEC |
Zacks Reports |
StockTalk |
News |
Chart |
Request a new note
C
A N
S L
I M
|
MKTX
-
NASDAQ
Marketaxess Holdings Inc
FINANCIAL SERVICES - Investment Brokerage - Nationa
|
$28.44
|
+0.80
2.89% |
$28.50
|
208,057
85.94% of 50 DAV
50 DAV is 242,100
|
$31.45
-9.57%
|
10/28/2011
|
$29.79
|
PP = $31.05
|
|
MB = $32.60
|
Most Recent Note - 11/11/2011 3:37:37 PM
Y - With quiet volume behind today's gain it is holding its ground near its 50 DMA line. Its Relative Strength line did not lead the way as it hit recent new highs, it has slumped.
>>> The latest Featured Stock Update with an annotated graph appeared on 10/31/2011. Click here.
View all notes |
Alert me of new notes |
CANSLIM.net Company Profile |
SEC |
Zacks Reports |
StockTalk |
News |
Chart |
Request a new note
C
A N
S L
I M
|
OPNT
-
NASDAQ
Opnet Technologies
INTERNET - Internet Software and Services
|
$35.31
|
-0.37
-1.04% |
$36.82
|
636,108
272.31% of 50 DAV
50 DAV is 233,600
|
$47.97
-26.39%
|
10/11/2011
|
$38.45
|
PP = $42.02
|
|
MB = $44.12
|
Most Recent Note - 11/11/2011 4:38:17 PM
Down again today with above average volume. Based on weak action it will be dropped from the Featured Stocks list tonight. It was noted 11/10/2011 7:01:53 PM - "Reported earnings +50% on +16% sales revenues for the quarter ended September 30, 2011 versus the year ago period. The market had higher expectations and it gapped down today for a damaging loss on heavy volume, violating its 50 and 200 DMA lines triggering technical sell signals. It also violated previous highs in the $41 area. Only a prompt repair of the technical damage would help its outlook."
>>> The latest Featured Stock Update with an annotated graph appeared on 10/25/2011. Click here.
View all notes |
Alert me of new notes |
CANSLIM.net Company Profile |
SEC |
Zacks Reports |
StockTalk |
News |
Chart |
Request a new note
C
A N
S L
I M
|
OSIS
-
NASDAQ
O S I Systems Inc
ELECTRONICS - Semiconductor Equipment and Mate
|
$46.38
|
+0.38
0.83% |
$46.86
|
111,082
74.85% of 50 DAV
50 DAV is 148,400
|
$47.39
-2.13%
|
11/1/2011
|
$42.07
|
PP = $45.57
|
|
MB = $47.85
|
Most Recent Note - 11/11/2011 4:41:37 PM
Y - Small gain on light volume today finishing -2.1% off its new 52-week high (N criteria) touched earlier this week with gains lacking great volume. Previously noted - "Lighter than average behind last week's gains, not indicative of great institutional (I criteria) buying demand. Volume-driven gains above its pivot point may trigger a technical buy signal."
>>> The latest Featured Stock Update with an annotated graph appeared on 11/1/2011. Click here.
View all notes |
Alert me of new notes |
CANSLIM.net Company Profile |
SEC |
Zacks Reports |
StockTalk |
News |
Chart |
Request a new note
C
A N
S L
I M
|
RAX
-
NYSE
Rackspace Hosting Inc
INTERNET - Internet Software and; Services
|
$42.39
|
+0.69
1.65% |
$43.07
|
1,850,162
116.32% of 50 DAV
50 DAV is 1,590,600
|
$46.50
-8.83%
|
11/8/2011
|
$44.28
|
PP = $46.27
|
|
MB = $48.58
|
Most Recent Note - 11/11/2011 3:39:18 PM
Y - Still working on the right side of a 19-week cup shaped base pattern. See the latest FSU analysis for more details and an annotated weekly graph.
>>> The latest Featured Stock Update with an annotated graph appeared on 11/10/2011. Click here.
View all notes |
Alert me of new notes |
CANSLIM.net Company Profile |
SEC |
Zacks Reports |
StockTalk |
News |
Chart |
Request a new note
C
A N
S L
I M
|
Symbol/Exchange
Company Name
Industry Group |
PRICE |
CHANGE
(%Change) |
Day High |
Volume
(% DAV)
(% 50 day avg vol) |
52 Wk Hi
% From Hi |
Featured
Date |
Price
Featured |
Pivot Featured |
|
Max Buy |
SWI
-
NYSE
Solarwinds Inc
COMPUTER SOFTWARE and SERVICES - Application Software
|
$31.01
|
+0.53
1.74% |
$31.49
|
1,396,246
119.11% of 50 DAV
50 DAV is 1,172,200
|
$30.61
1.31%
|
10/27/2011
|
$27.78
|
PP = $25.62
|
|
MB = $26.90
|
Most Recent Note - 11/11/2011 4:31:37 PM
G - Small gap up today for an 8th consecutive gain into new high territory. It is extended from its previous base pattern. Prior highs in the $25-26 area define initial chart support to watch on pullbacks.
>>> The latest Featured Stock Update with an annotated graph appeared on 10/27/2011. Click here.
View all notes |
Alert me of new notes |
CANSLIM.net Company Profile |
SEC |
Zacks Reports |
StockTalk |
News |
Chart |
Request a new note
C
A N
S L
I M
|
TDG
-
NYSE
Transdigm Group Inc
AEROSPACE/DEFENSE - Aerospace/Defense Products and; Services
|
$97.93
|
+1.67
1.73% |
$98.53
|
180,785
43.77% of 50 DAV
50 DAV is 413,000
|
$98.93
-1.01%
|
11/9/2011
|
$98.45
|
PP = $95.14
|
|
MB = $99.90
|
Most Recent Note - 11/11/2011 4:35:05 PM
Y - Hovering near its 52-week high today. A volume-driven gain on 11/08/11 helped it break out from a 19-week base. Due to report earnings on Thursday, November 17th for the quarter ended September 30, 2011. See the latest FSU analysis for more details and a new annotated graph.
>>> The latest Featured Stock Update with an annotated graph appeared on 11/9/2011. Click here.
View all notes |
Alert me of new notes |
CANSLIM.net Company Profile |
SEC |
Zacks Reports |
StockTalk |
News |
Chart |
Request a new note
C
A N
S L
I M
|
UA
-
NYSE
Under Armour Inc Cl A
CONSUMER NON-DURABLES - Textile - Apparel Clothing
|
$83.90
|
+2.86
3.53% |
$83.99
|
650,383
48.96% of 50 DAV
50 DAV is 1,328,400
|
$87.40
-4.00%
|
10/25/2011
|
$82.43
|
PP = $80.80
|
|
MB = $84.84
|
Most Recent Note - 11/11/2011 2:09:33 PM
Y - Rising with light volume today, still consolidating above its pivot point and below its "max buy" level. No resistance remains due to overhead supply following its recent spurt of volume-driven gains. Prior highs near $80 define initial support above its 50 DMA line.
>>> The latest Featured Stock Update with an annotated graph appeared on 11/3/2011. Click here.
View all notes |
Alert me of new notes |
CANSLIM.net Company Profile |
SEC |
Zacks Reports |
StockTalk |
News |
Chart |
Request a new note
C
A N
S L
I M
|
V
-
NYSE
Visa Inc Cl A
DIVERSIFIED SERVICES - Business/Management Services
|
$95.16
|
+2.12
2.28% |
$95.65
|
3,412,033
64.32% of 50 DAV
50 DAV is 5,305,100
|
$95.87
-0.74%
|
10/24/2011
|
$94.21
|
PP = $94.85
|
|
MB = $99.59
|
Most Recent Note - 11/11/2011 2:13:05 PM
Y - Today's gain with light volume has it inching above its pivot point and poised for possibly its best close ever. Perched within close striking distance of its 52-week high, yet it did not trigger a proper new technical buy signal since recently highlighted in yellow as an ideal looking set-up. A volume-driven gain to new highs would be a reassuring sign of institutional buying demand. Meanwhile, its 50 DMA line defines near-term chart support to watch.
>>> The latest Featured Stock Update with an annotated graph appeared on 10/24/2011. Click here.
View all notes |
Alert me of new notes |
CANSLIM.net Company Profile |
SEC |
Zacks Reports |
StockTalk |
News |
Chart |
Request a new note
C
A N
S L
I M
|