You are not logged in.
This means you
CAN ONLY VIEW reports that were published prior to Friday, April 18, 2025.
You
MUST UPGRADE YOUR MEMBERSHIP if you want to see any current reports.
AFTER MARKET UPDATE - FRIDAY, NOVEMBER 3RD, 2023
Previous After Market Report Next After Market Report >>>
|
|
|
|
DOW |
+222.24 |
34,061.32 |
+0.66% |
|
Volume |
1,035,414,936 |
-2% |
|
Volume |
4,937,295,200 |
-1% |
|
NASDAQ |
+184.09 |
13,478.28 |
+1.38% |
|
Advancers |
2,371 |
83% |
|
Advancers |
3,362 |
78% |
|
S&P 500 |
+40.56 |
4,358.34 |
+0.94% |
|
Decliners |
471 |
17% |
|
Decliners |
975 |
22% |
|
Russell 2000 |
+46.49 |
1,760.70 |
+2.71% |
|
52 Wk Highs |
79 |
|
|
52 Wk Highs |
61 |
|
|
S&P 600 |
+30.51 |
1,148.40 |
+2.73% |
|
52 Wk Lows |
16 |
|
|
52 Wk Lows |
92 |
|
|
Solid gains with higher volume Thursday marked another follow-through day. Gains have signaled a new confirmed uptrend for the market (M criteria).
|
 |
Major Indices Rallied With Greater Leadership
Kenneth J. Gruneisen - Passed the CAN SLIM® Master's Exam
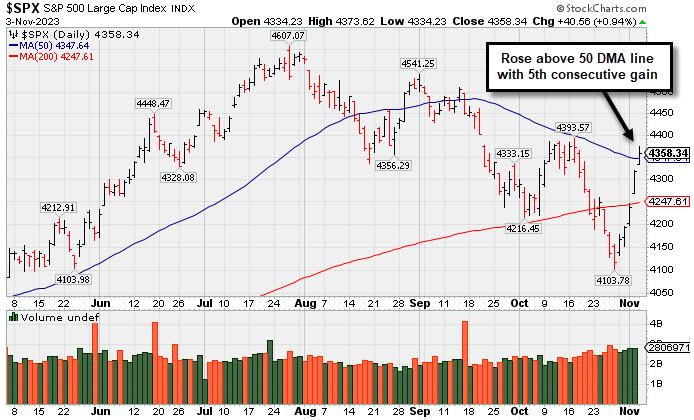
The S&P 500 closed above its 50-day moving average (4,347) after falling to 4,103 at last Friday's low. The Russell 2000, which had underperformed relative to other major indices recently, closed with the biggest gain today (+2.8%) and a whopping 7.6% gain for the week. The volume totals were lighter than the prior session on the NYSE and on the Nasdaq exchange. Breadth was positive as advancers led decliners by a 5-1 margin on the NYSE and by more than a 3-1 margin on the Nasdaq exchange. There were 54 high-ranked companies from the Leaders List that hit new 52-week highs and were listed on the BreakOuts Page, versus the total of 32 on the prior session. New 52-week highs outnumbered new 52-week lows on the NYSE but new lows still outnumbered new highs on the Nasdaq exchange. The 3 major indices posted solid gains on Thursday with higher volume and an expansion in new highs totals marking another follow-through day. Gains have signaled a new confirmed uptrend for the market (M criteria). New buying efforts should be only made in stocks fitting all key criteria of the fact-based investment system.
PICTURED: The S&P 500 Index rose above its 50-day moving average (DMA) line.
Ten of the 11 S&P 500 sectors registered gains, led by the rate-sensitive real estate sector (+2.4%). The energy sector (-1.0%) was alone in the red at the close, due in part to falling oil prices ($80.78/bbl, -1.79, -2.2%). Crude futures settled lower due to traders presumably not liking the implication of slower growth embedded in the employment data, the October ISM Services PMI, and a dour view on demand patterns from global shipping giant Maersk.
The 10-yr note yield fell 16 basis points to 4.51%. The 2-yr note yield fell 12 basis points to 4.86%. These moves followed an October Employment Situation Report that showed slower payroll growth, rising unemployment, and slower wage growth, as well as an October ISM Services PMI that dropped to 51.8% from 53.6% in September, reflecting a slowdown in the pace of expansion for the services sector.
Expedia (EXPE +18.8%) and Paramount Global (PARA +15.4%) were big gainers following their earnings reports. Fortinet (FTNT -12.4%) and Bill.com (BILL -25.2%) saw steep losses after reporting their results.
|
 Kenneth J. Gruneisen started out as a licensed stockbroker in August 1987, a couple of months prior to the historic stock market crash that took the Dow Jones Industrial Average down -22.6% in a single day. He has published daily fact-based fundamental and technical analysis on high-ranked stocks online for two decades. Through FACTBASEDINVESTING.COM, Kenneth provides educational articles, news, market commentary, and other information regarding proven investment systems that work in good times and bad.
Comments contained in the body of this report are technical opinions only and are not necessarily those of Gruneisen Growth Corp. The material herein has been obtained from sources believed to be reliable and accurate, however, its accuracy and completeness cannot be guaranteed. Our firm, employees, and customers may effect transactions, including transactions contrary to any recommendation herein, or have positions in the securities mentioned herein or options with respect thereto. Any recommendation contained in this report may not be suitable for all investors and it is not to be deemed an offer or solicitation on our part with respect to the purchase or sale of any securities. |
|
 |
Gold & Silver, Bank, and Biotech Indexes Led Group Gainers
Kenneth J. Gruneisen - Passed the CAN SLIM® Master's Exam
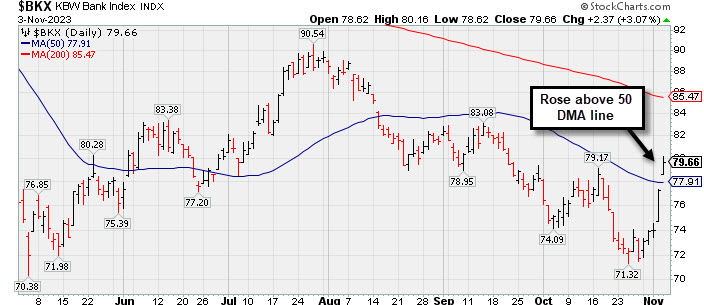
The Bank Index ($BKX +3.07%) outpaced the Broker/Dealer Index ($XBD +1.55%), and the Retail Index ($RLX +0.67%) also finished higher. The tech sector was led by the Biotech Index ($BTK +3.03%) while the Semiconductor Index ($SOX +2.55%) also posted a solid gain and the Networking Index ($NWX +0.51%). Commodity-linked groups were mixed as the Gold & Silver Index ($XAU +4.22%) posted a standout gain while the Oil Services Index ($OSX -0.50%) and the Integrated Oil Index ($XOI -1.50%) both lost ground.
PICTURED: The Bank Index ($BKX +3.07%) posted a 4th consecutive solid gain and rebounded above its 50-day moving average (DMA) line.
| Oil Services |
$OSX |
89.08 |
-0.45 |
-0.50% |
+6.22% |
| Integrated Oil |
$XOI |
1,885.85 |
-28.68 |
-1.50% |
+5.52% |
| Semiconductor |
$SOX |
3,454.57 |
+86.03 |
+2.55% |
+36.43% |
| Networking |
$NWX |
690.86 |
+3.51 |
+0.51% |
-11.80% |
| Broker/Dealer |
$XBD |
483.37 |
+7.39 |
+1.55% |
+7.62% |
| Retail |
$RLX |
3,517.33 |
+23.34 |
+0.67% |
+27.72% |
| Gold & Silver |
$XAU |
116.25 |
+4.71 |
+4.22% |
-3.82% |
| Bank |
$BKX |
79.66 |
+2.37 |
+3.07% |
-21.01% |
| Biotech |
$BTK |
4,799.59 |
+141.16 |
+3.03% |
-9.12% |
|
|
|
 |
Powerful Breakout for Qualys
Kenneth J. Gruneisen - Passed the CAN SLIM® Master's Exam
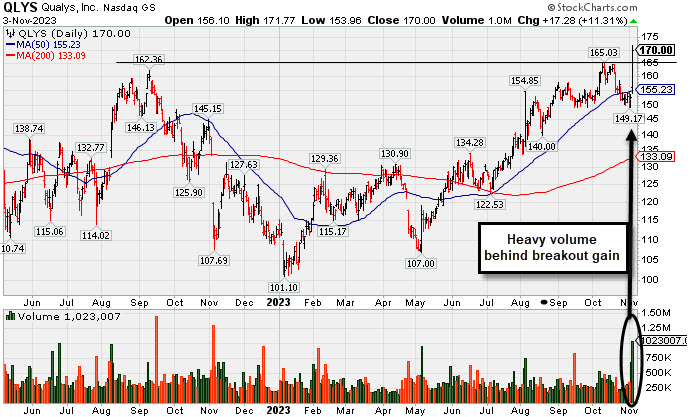
Qualys Inc (QLYS +$17.28 or +11.31% to $170.00) finished strong after highlighted to yellow with pivot point cited based on its 10/11/23 high after a cup-with-handle base. Today's gap up and considerable gain had it hitting new 52-week and all-time highs triggering a technical buy signal. Reported Sep '23 quarterly earnings +61% on +13% sales revenues versus the year ago period, its 2nd strong quarterly comparison well above the +25% minimum earnings guideline (C criteria). Made choppy progress and fundamentals remained reasonably strong since dropped from the Featured Stocks list on 6/15/20.
It has a 99 Earnings Per Share Rating. Its annual earnings history (A criteria) has also been very strong an steady. The Computer Software - Security group is currently ranked 15th on the 197 Industry Groups list, and leadership (L criteria) in the industry group is another favorable factor with respect to the fact-based investment system.
QLYS has a Relative Strength Rating of 94, well above the 80+ minimum guideline for buy candidates. Currently it has a Timeliness Rating of A and Sponsorship Rating of D. Its Accumulation/Distribution rating is B- while its Up/Down Volume Ratio of 1.4 is an unbiased indication its shares have been under accumulation over the past 50 days. The number of top-rated funds owning its shares rose from 294 in Jun '17 to 725 in Sep '23, a reassuring sign concerning the I criteria. Its small supply of only 36 million shares (S criteria) in the public float can contribute to greater volatility in the event of institutional buying or selling.
Symbol/Exchange
Company Name
Industry Group | PRICE | CHANGE
(%Change) | Day High | Volume
(% DAV)
(% 50 day avg vol) | 52 Wk Hi
% From Hi | Featured
Date | Price
Featured | Pivot Featured | | Max Buy |  PLUS - NASDAQ PLUS - NASDAQ
ePlus
Computer-Tech Services | $65.01 | +1.30
2.04% | $65.43 | 77,180
71.46% of 50 DAV
50 DAV is 108,000 | $75.90
-14.35%
| 8/8/2023 | $67.60 | PP = $62.92 | | MB = $66.07 |  Most Recent Note - 11/3/2023 4:47:26 PM Most Recent Note - 11/3/2023 4:47:26 PM
Y - Color code is changed to yellow after rebounding above its 50 DMA line ($64.24) with today''s 5th consecutive gain helping its outlook to improve.
>>> FEATURED STOCK ARTICLE : Orderly Consolidation Continues for ePlus - 9/28/2023 | View all notes | Set NEW NOTE alert | Company Profile | SEC News | Chart | Request a new note C A S I | ANET - NYSE
Arista Networks
Computer-Networking | $212.49 | +0.81
0.38% | $213.66 | 2,140,148
99.04% of 50 DAV
50 DAV is 2,161,000 | $214.26
-0.83%
| 10/31/2023 | $188.84 | PP = $198.80 | | MB = $208.74 | Most Recent Note - 11/3/2023 4:43:52 PM
G - Color code is changed to green after rising above its "max buy" level with today''s 4th consecutive gain. Bullish action came after it reported Sep ''23 quarterly earnings +46% on +28% sales revenues versus the year-ago period. Prior highs in the $198 area define near-term support above its 50 DMA line ($189.39).
>>> FEATURED STOCK ARTICLE : Powerful Gain Following Earnings Report for Arista Networks - 10/31/2023 | View all notes | Set NEW NOTE alert | Company Profile | SEC News | Chart | Request a new note C A S I | NVO - NYSE
Novo Nordisk ADR
Medical-Ethical Drugs | $98.17 | -2.76
-2.73% | $98.84 | 4,412,877
96.41% of 50 DAV
50 DAV is 4,577,000 | $104.00
-5.61%
| 11/2/2023 | $100.97 | PP = $104.10 | | MB = $109.31 | Most Recent Note - 11/3/2023 4:45:53 PM
Y - Gapped down today for a loss with lighter volume. Subsequent gains for new highs backed by at least +40% above average volume are needed to trigger a technical buy signal. This Denmark-based Medical - Ethical Drugs firm found support after briefly undercutting its 50 DMA line in recent weeks. Shares split 2-1 on 9/20/23. Reported Sep '23 quarterly earnings +69% on +39% sales revenues versus the year-ago period, its 3rd strong quarter, well above the +25% minimum earnings guideline (C criteria). Annual earnings growth has been slow and steady.
>>> FEATURED STOCK ARTICLE : Approaching Prior High With Strong Fundamentals - 11/2/2023 | View all notes | Set NEW NOTE alert | Company Profile | SEC News | Chart | Request a new note C A S I | QLYS - NASDAQ
Qualys
Computer Sftwr-Security | $170.00 | +17.28
11.31% | $171.77 | 1,032,064
327.64% of 50 DAV
50 DAV is 315,000 | $165.03
3.01%
| 11/3/2023 | $167.50 | PP = $165.03 | | MB = $173.28 | Most Recent Note - 11/3/2023 4:49:09 PM
Y - Finished strong after highlighted in yellow in the earlier mid-day report with pivot point cited based on its 10/11/23 high after a cup-with-handle base. Today's gap up and considerable gain hit new 52-week and all-time highs triggering a technical buy signal. Reported Sep '23 quarterly earnings +61% on +13% sales revenues versus the year ago period, its 2nd strong quarterly comparison well above the +25% minimum earnings guideline (C criteria). Made choppy progress and fundamentals remained reasonably strong since dropped from the Featured Stocks list on 6/15/20. See the latest FSU analysis for more details and a new annotated graph.
>>> FEATURED STOCK ARTICLE : Powerful Breakout for Qualys - 11/3/2023 | View all notes | Set NEW NOTE alert | Company Profile | SEC News | Chart | Request a new note C A S I |
|
|
|
Color Codes Explained :
Y - Better candidates highlighted by our
staff of experts.
G - Previously featured
in past reports as yellow but may no longer be buyable under the
guidelines.
***Last / Change / Volume data in this table is the closing quote data***
|
|
|
THESE ARE NOT BUY RECOMMENDATIONS!
Comments contained in the body of this report are technical
opinions only. The material herein has been obtained
from sources believed to be reliable and accurate, however,
its accuracy and completeness cannot be guaranteed.
This site is not an investment advisor, hence it does
not endorse or recommend any securities or other investments.
Any recommendation contained in this report may not
be suitable for all investors and it is not to be deemed
an offer or solicitation on our part with respect to
the purchase or sale of any securities. All trademarks,
service marks and trade names appearing in this report
are the property of their respective owners, and are
likewise used for identification purposes only.
This report is a service available
only to active Paid Premium Members.
You may opt-out of receiving report notifications
at any time. Questions or comments may be submitted
by writing to Premium Membership Services 665 S.E. 10 Street, Suite 201 Deerfield Beach, FL 33441-5634 or by calling 1-800-965-8307
or 954-785-1121.
|
|
|