Computer Software Firm Is Extended From Latest Base
Tuesday, October 13, 2009 CANSLIM.net

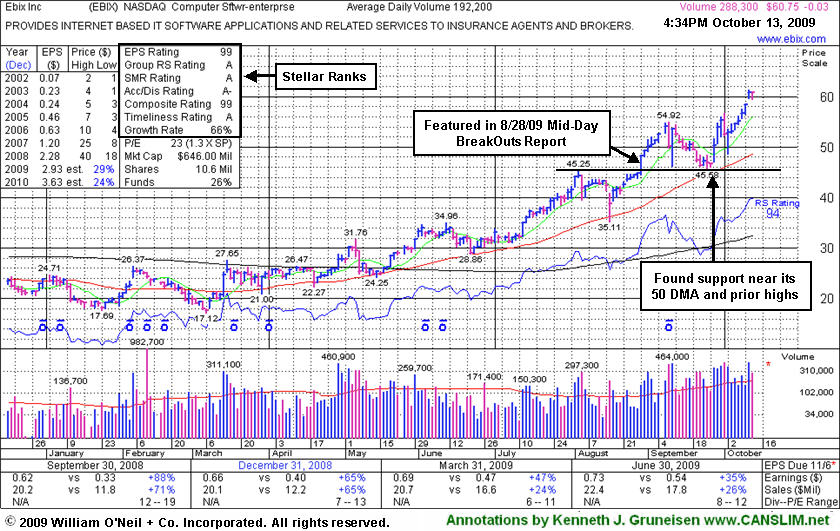
Ebix Inc (EBIX +$0.02 or +0.03% to $60.80) held its ground today after a gap up gain on 10/12/09 for a new all-time high. It is very extended from any sound base and well above support at its 50-day moving average (DMA) line, and more than +84% above its 200 DMA line, which are reminders to be watchful for sell signals. It endured some distributional pressure in September but found support at prior chart highs and its 50 DMA line in the $45 area. EBIX has rallied as much as +33.5% since featured in yellow in the 8/28/09 CANSLIM.net Mid-Day BreakOuts Report (read here) as it was reaching a new all-time high. Prior to that, it formed the big cup-with-high-handle shaped pattern (finding great support at its 50 DMA line) since weak action prompted it to be dropped from the Featured Stocks list on 10/07/08. As shown in the annotated graph below, earnings increases in quarterly comparisons have been strong and above the +25% guideline, but previously noted earnings deceleration is of some concern. It is preferred when earnings growth is strong and accelerating, not losing steam.
EBIX had traded up more than +59% after it was first featured in the March 2008 CANSLIM.net News (read here). At that time its average daily volume was only 4,900 shares, whereas today its average volume is at 192,200 shares. Today there are 10.6 million shares (the S criteria) in the public float, so its share price still could be very volatile in the event of heavy institutional buying or selling. The number of top-rated funds owning an interest in its shares rose from 31 in Dec '08 to 58 in Jun '09, which is a good sign concerning the I criteria of the investment system. Return on Equity is now reported at +42%, well above the +17% guideline. Do not be confused by the 3:1 split that took effect on 10/09/08.
