You are not logged in.
This means you
CAN ONLY VIEW reports that were published prior to Saturday, April 19, 2025.
You
MUST UPGRADE YOUR MEMBERSHIP if you want to see any current reports.
AFTER MARKET UPDATE - FRIDAY, OCTOBER 27TH, 2023
Previous After Market Report Next After Market Report >>>
|
|
|
|
DOW |
-366.71 |
32,417.59 |
-1.12% |
|
Volume |
945,507,432 |
-8% |
|
Volume |
4,210,045,400 |
-15% |
|
NASDAQ |
+47.41 |
12,643.01 |
+0.38% |
|
Advancers |
706 |
25% |
|
Advancers |
1,388 |
32% |
|
S&P 500 |
-19.86 |
4,117.37 |
-0.48% |
|
Decliners |
2,114 |
75% |
|
Decliners |
2,992 |
68% |
|
Russell 2000 |
-20.07 |
1,636.94 |
-1.21% |
|
52 Wk Highs |
19 |
|
|
52 Wk Highs |
26 |
|
|
S&P 600 |
-10.89 |
1,068.80 |
-1.01% |
|
52 Wk Lows |
351 |
|
|
52 Wk Lows |
601 |
|
|
The market averages are in a correction (M criteria). New buying efforts should be avoided until a solid follow-through day signals a new confirmed rally.
|
 |
Breadth Clearly Negative as Major Indices Ended Mixed
Kenneth J. Gruneisen - Passed the CAN SLIM® Master's Exam
The major indices were mixed on Friday and all closed near their session lows. The volume totals were lighter than the prior session on the NYSE and on the Nasdaq exchange. Breadth was negative as decliners clearly led advancers by a 2-1 margin on the Nasdaq exchange and 3-1 on the NYSE. There were 8 high-ranked companies from the Leaders List that hit new 52-week highs and were listed on the BreakOuts Page, versus the total of 7 on the prior session. New 52-week lows totals solidly outnumbered new 52-week highs on the NYSE and on the Nasdaq exchange. The market averages are in a correction (M criteria). New buying efforts should be avoided until a solid follow-through day signals a new confirmed rally.
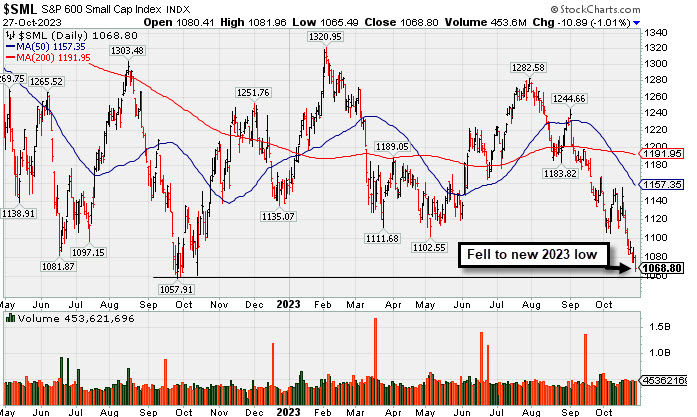
PICTURED: The S&P 600 Small Cap Index fell to a new 2023 low.
The September Personal Income and Spending report featured inflation numbers that are not likely to persuade the Fed to cut rates anytime soon. The 2-yr note yield fell two basis points to 5.03% and the 10-yr note yield settled unchanged at 4.85%.
Eight of the 11 S&P 500 sectors fell with six of them registering losses larger than -1.0%. The energy sector (-2.3%) was the worst performer by a wide margin thanks to losses in Chevron (CVX -6.72%) and Exxon Mobil (XOM -1.91%) after they reported earnings. The financials sector (-1.9%) sank due to a loss in JPMorgan Chase (JPM -3.60%) as CEO Jamie Dimon confirmed that he and his family plan to sell a portion of their holdings. The only sectors to post gains were consumer discretionary (+1.7%), information technology (+0.6%), and communication services (+0.1%).
Amazon.com (AMZN +6.83%) posted a standout gain following better-than-expected earnings and guidance. Semiconductor stocks were another pocket of strength after Intel (INTC +9.3%) beat earnings estimates.
The US carried out airstrikes against Iranian backed targets in Syria as Israel expanded ground operations in Gaza.
|
 Kenneth J. Gruneisen started out as a licensed stockbroker in August 1987, a couple of months prior to the historic stock market crash that took the Dow Jones Industrial Average down -22.6% in a single day. He has published daily fact-based fundamental and technical analysis on high-ranked stocks online for two decades. Through FACTBASEDINVESTING.COM, Kenneth provides educational articles, news, market commentary, and other information regarding proven investment systems that work in good times and bad.
Comments contained in the body of this report are technical opinions only and are not necessarily those of Gruneisen Growth Corp. The material herein has been obtained from sources believed to be reliable and accurate, however, its accuracy and completeness cannot be guaranteed. Our firm, employees, and customers may effect transactions, including transactions contrary to any recommendation herein, or have positions in the securities mentioned herein or options with respect thereto. Any recommendation contained in this report may not be suitable for all investors and it is not to be deemed an offer or solicitation on our part with respect to the purchase or sale of any securities. |
|
 |
Retail, Semiconductor, and Gold & Silver Indexes Led Group Gainers
Kenneth J. Gruneisen - Passed the CAN SLIM® Master's Exam
The Retail Index ($RLX +3.74%) posted a solid gain thanks to help from Amazon's big gain. The Broker/Dealer Index ($XBD -0.68%) edged lower and the Bank Index ($BKX -2.34%) suffered a larger loss. The tech sector was mixed as the Semiconductor Index ($SOX +1.21%) outpaced the Networking Index ($NWX +0.31%), meanwhile the Biotech Index ($BTK -2.55%) suffered a large loss. Commodity-linked groups were mixed as the Gold & Silver Index ($XAU +1.93%) rose while the Oil Services Index ($OSX -0.86%) and the Integrated Oil Index ($XOI -1.80%) both lost ground.
PICTURED: The Biotech Index ($BTK -2.55%) fell to a new 2023 low.
| Oil Services |
$OSX |
87.20 |
-0.76 |
-0.86% |
+3.98% |
| Integrated Oil |
$XOI |
1,848.38 |
-33.92 |
-1.80% |
+3.42% |
| Semiconductor |
$SOX |
3,227.09 |
+38.67 |
+1.21% |
+27.45% |
| Networking |
$NWX |
684.12 |
+2.08 |
+0.31% |
-12.66% |
| Broker/Dealer |
$XBD |
455.04 |
-3.13 |
-0.68% |
+1.32% |
| Retail |
$RLX |
3,272.15 |
+118.09 |
+3.74% |
+18.81% |
| Gold & Silver |
$XAU |
115.07 |
+2.18 |
+1.93% |
-4.79% |
| Bank |
$BKX |
71.71 |
-1.72 |
-2.34% |
-28.90% |
| Biotech |
$BTK |
4,544.40 |
-118.95 |
-2.55% |
-13.95% |
|
|
|
 |
Featured Stocks
Kenneth J. Gruneisen - Passed the CAN SLIM® Master's Exam
|
|
|
Color Codes Explained :
Y - Better candidates highlighted by our
staff of experts.
G - Previously featured
in past reports as yellow but may no longer be buyable under the
guidelines.
***Last / Change / Volume data in this table is the closing quote data***
|
|
|
THESE ARE NOT BUY RECOMMENDATIONS!
Comments contained in the body of this report are technical
opinions only. The material herein has been obtained
from sources believed to be reliable and accurate, however,
its accuracy and completeness cannot be guaranteed.
This site is not an investment advisor, hence it does
not endorse or recommend any securities or other investments.
Any recommendation contained in this report may not
be suitable for all investors and it is not to be deemed
an offer or solicitation on our part with respect to
the purchase or sale of any securities. All trademarks,
service marks and trade names appearing in this report
are the property of their respective owners, and are
likewise used for identification purposes only.
This report is a service available
only to active Paid Premium Members.
You may opt-out of receiving report notifications
at any time. Questions or comments may be submitted
by writing to Premium Membership Services 665 S.E. 10 Street, Suite 201 Deerfield Beach, FL 33441-5634 or by calling 1-800-965-8307
or 954-785-1121.
|
|
|