You are not logged in.
This means you
CAN ONLY VIEW reports that were published prior to Sunday, April 20, 2025.
You
MUST UPGRADE YOUR MEMBERSHIP if you want to see any current reports.
AFTER MARKET UPDATE - WEDNESDAY, OCTOBER 18TH, 2023
Previous After Market Report Next After Market Report >>>
|
|
|
|
DOW |
-332.57 |
33,665.08 |
-0.98% |
|
Volume |
868,455,158 |
-11% |
|
Volume |
4,626,699,900 |
+4% |
|
NASDAQ |
-219.44 |
13,314.30 |
-1.62% |
|
Advancers |
471 |
17% |
|
Advancers |
1,029 |
24% |
|
S&P 500 |
-58.60 |
4,314.60 |
-1.34% |
|
Decliners |
2,328 |
83% |
|
Decliners |
3,265 |
76% |
|
Russell 2000 |
-37.24 |
1,728.81 |
-2.11% |
|
52 Wk Highs |
25 |
|
|
52 Wk Highs |
31 |
|
|
S&P 600 |
-21.55 |
1,123.99 |
-1.88% |
|
52 Wk Lows |
245 |
|
|
52 Wk Lows |
303 |
|
|
 |
Leadership Waned as Major Indices Fell
Kenneth J. Gruneisen - Passed the CAN SLIM® Master's Exam
The major indices lost ground on Wednesday and small caps clearly lagged. The volume totals were mixed, lighter than the prior session on the NYSE and higher on the Nasdaq exchange. Breadth was negative as decliners led advancers by almost a 5-1 margin on the NYSE and nearly 3-1 on the Nasdaq exchange. There were 10 high-ranked companies from the Leaders List that hit a new 52-week high and were listed on the BreakOuts Page, versus the total of 27 on the prior session. New 52-week lows totals expanded and solidly outnumbered shrinking new 52-week highs on the NYSE and on the Nasdaq exchange. The market averages are in an uptrend under pressure (M criteria). New buying efforts should be made only in stocks meeting all key criteria of the fact-based investment system.
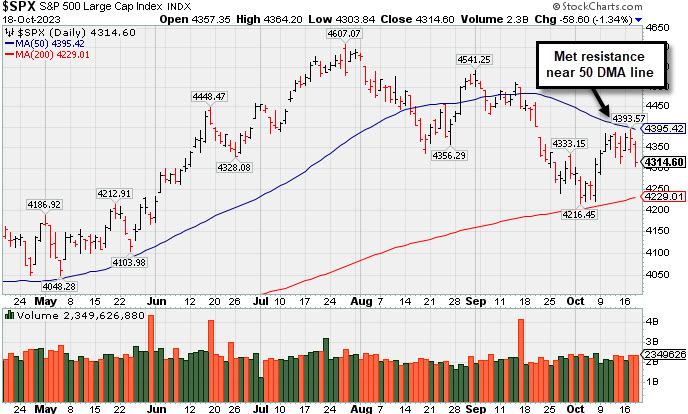
PICTURED: The S&P 500 Index met resistance near its 50-day moving average (DMA) line and has slumped back toward the prior low and toward its 200 DMA line.
Nine of the 11 S&P 500 sectors registered a decline with four of them falling more than -2.0%. The energy (+0.9%) and consumer staples (+0.4%) sectors were alone in positive territory at the close. The industrials sector (-2.4%) was a clear laggard. United Airlines (UAL -9.67%) issued a Q4 profit warning tied to higher costs and the uncertainty related to the Israel-Hamas war. J.B. Hunt Transport (JBHT -8.85%) was another notable loser from the sector after missing on earnings estimates, saying it still sees a freight recession. Morgan Stanley (MS -6.78%) slumped badly after reporting quarterly results which contained some relatively disappointing results for its wealth management division. That weakness weighed on the financials sector, which dropped -1.7%.
Dow components Travelers (TRV -0.74%) and Procter & Gamble (PG +2.58%) showed mixed reactions after reporting earnings. Rising Treasury yields were a big overhang for the market. The 2-yr note yield rose two basis points to 5.22% and the 10-yr note yield climbed another six basis points to 4.90%.
The negative bias in stock market was also a function of geopolitical uncertainty after a summit between President Biden, who is in Israel now, and regional leaders in the Middle East was cancelled following Tuesday's bombing of a Gaza hospital that killed hundreds of people. Separately, it was reported that Rep. Jim Jordan (R-OH) lost a second vote to become Speaker of the House.
|
 Kenneth J. Gruneisen started out as a licensed stockbroker in August 1987, a couple of months prior to the historic stock market crash that took the Dow Jones Industrial Average down -22.6% in a single day. He has published daily fact-based fundamental and technical analysis on high-ranked stocks online for two decades. Through FACTBASEDINVESTING.COM, Kenneth provides educational articles, news, market commentary, and other information regarding proven investment systems that work in good times and bad.
Comments contained in the body of this report are technical opinions only and are not necessarily those of Gruneisen Growth Corp. The material herein has been obtained from sources believed to be reliable and accurate, however, its accuracy and completeness cannot be guaranteed. Our firm, employees, and customers may effect transactions, including transactions contrary to any recommendation herein, or have positions in the securities mentioned herein or options with respect thereto. Any recommendation contained in this report may not be suitable for all investors and it is not to be deemed an offer or solicitation on our part with respect to the purchase or sale of any securities. |
|
 |
Retail, Financial, and Tech Indexes Fell
Kenneth J. Gruneisen - Passed the CAN SLIM® Master's Exam
The Bank Index ($BKX -2.49%) and Broker/Dealer Index ($XBD -2.99%) suffered influential losses that created a drag on the major averages along with weakness in the Retail Index ($RLX -2.17%). The tech sector had a clearly negative bias as the Biotech Index ($BTK -2.78%), Networking Index ($NWX -1.79%), and the Semiconductor Index ($SOX -1.76%) each lost ground. The Gold & Silver Index ($XAU -0.55%) edged lower, meanwhile the Oil Services Index ($OSX +0.09%) inched higher and the Integrated Oil Index ($XOI +1.03%) posted a solid gain.
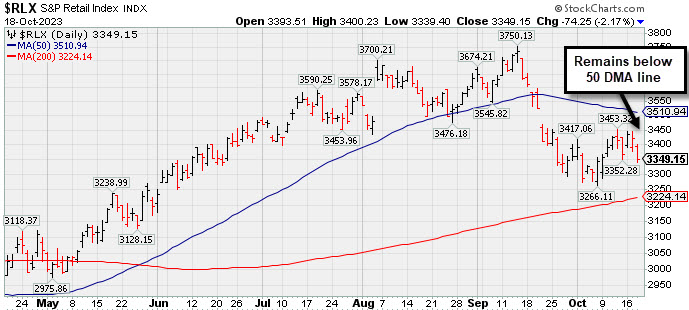
PICTURED: The Retail Index ($RLX -2.17%) has been sputtering below its 50-day moving average (DMA) line.
| Oil Services |
$OSX |
96.64 |
+0.08 |
+0.09% |
+15.23% |
| Integrated Oil |
$XOI |
1,993.18 |
+20.35 |
+1.03% |
+11.52% |
| Semiconductor |
$SOX |
3,413.45 |
-61.22 |
-1.76% |
+34.81% |
| Networking |
$NWX |
710.67 |
-12.92 |
-1.79% |
-9.27% |
| Broker/Dealer |
$XBD |
471.93 |
-14.54 |
-2.99% |
+5.08% |
| Retail |
$RLX |
3,349.15 |
-74.25 |
-2.17% |
+21.61% |
| Gold & Silver |
$XAU |
116.58 |
-0.64 |
-0.55% |
-3.54% |
| Bank |
$BKX |
76.70 |
-1.96 |
-2.49% |
-23.94% |
| Biotech |
$BTK |
4,851.75 |
-138.77 |
-2.78% |
-8.13% |
|
|
|
 |
Featured Stocks
Kenneth J. Gruneisen - Passed the CAN SLIM® Master's Exam
|
|
|
Color Codes Explained :
Y - Better candidates highlighted by our
staff of experts.
G - Previously featured
in past reports as yellow but may no longer be buyable under the
guidelines.
***Last / Change / Volume data in this table is the closing quote data***
|
|
|
THESE ARE NOT BUY RECOMMENDATIONS!
Comments contained in the body of this report are technical
opinions only. The material herein has been obtained
from sources believed to be reliable and accurate, however,
its accuracy and completeness cannot be guaranteed.
This site is not an investment advisor, hence it does
not endorse or recommend any securities or other investments.
Any recommendation contained in this report may not
be suitable for all investors and it is not to be deemed
an offer or solicitation on our part with respect to
the purchase or sale of any securities. All trademarks,
service marks and trade names appearing in this report
are the property of their respective owners, and are
likewise used for identification purposes only.
This report is a service available
only to active Paid Premium Members.
You may opt-out of receiving report notifications
at any time. Questions or comments may be submitted
by writing to Premium Membership Services 665 S.E. 10 Street, Suite 201 Deerfield Beach, FL 33441-5634 or by calling 1-800-965-8307
or 954-785-1121.
|
|
|