You are not logged in.
This means you
CAN ONLY VIEW reports that were published prior to Saturday, April 5, 2025.
You
MUST UPGRADE YOUR MEMBERSHIP if you want to see any current reports.
AFTER MARKET UPDATE - TUESDAY, OCTOBER 14TH, 2014
Previous After Market Report Next After Market Report >>>
|
|
|
|
DOW |
-5.88 |
16,315.19 |
-0.04% |
|
Volume |
944,409,540 |
+7% |
|
Volume |
2,278,770,410 |
+1% |
|
NASDAQ |
+13.51 |
4,227.17 |
+0.32% |
|
Advancers |
1,885 |
59% |
|
Advancers |
1,813 |
62% |
|
S&P 500 |
+2.96 |
1,877.70 |
+0.16% |
|
Decliners |
1,209 |
38% |
|
Decliners |
1,048 |
36% |
|
Russell 2000 |
+12.30 |
1,061.60 |
+1.17% |
|
52 Wk Highs |
35 |
|
|
52 Wk Highs |
24 |
|
|
S&P 600 |
+7.29 |
616.68 |
+1.20% |
|
52 Wk Lows |
367 |
|
|
52 Wk Lows |
199 |
|
|
 |
Stocks Erased Early Gains to End Mixed and Little Changed
Kenneth J. Gruneisen - Passed the CAN SLIM® Master's Exam
After an initial rally, stocks finished mixed and little changed on Tuesday. The volume totals were reported higher than the prior session totals on the NYSE and on the Nasdaq exchange. Breadth was positive as advancers led decliners by a 3-2 margin on the NYSE and a 9-5 margin on the Nasdaq exchange. There were 12 high-ranked companies from the CANSLIM.net Leaders List that made new 52-week highs and appeared on the CANSLIM.net BreakOuts Page, up from the prior session total of 5 stocks. The new 52-week lows list still solidly outnumbered new 52-week highs on the NYSE and on the Nasdaq exchange. There were gains for 3 of the 4 high-ranked companies currently included on the Featured Stocks Page, a list that has waned as market conditions eroded. Distributional action raised concerns while leadership (stocks hitting new 52-week highs) waned and a deteriorating market (M criteria) environment was repeatedly noted in this commentary. New buying efforts are discouraged during market corrections while the fact-based investment system prompts disciplined investors to lean toward reducing market exposure.
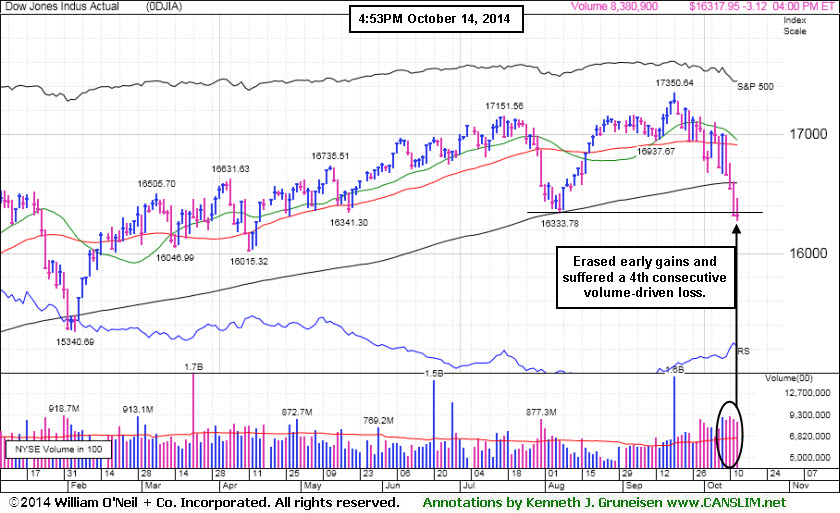
PICTURED: The Dow Jones Industrial Average, which rose as many as 143 points, closed down nearly 6 points to 16,315. That marked the Blue Chip index's 4th consecutive loss on above average volume, undercutting prior lows, and it remains below its 200-day moving average (DMA) line.
The S&P 500 erased most of its earlier gain of 24 points to end the session up only 3 points to 1,877. The NASDAQ Composite pared a 68 point advance to end the session 13 points higher to 4,227.
The major averages finished mixed after spending most of the session in positive territory amid a retreat by the energy sector. Chevron (CVX -2.01%) fell as the price of crude oil declined. Industrials were the best performing group paced by airline stocks as Delta (DAL +6.12%) and Southwest Airlines (LUV +3.88%) rose.
Earnings were a focus on the session with several bellwether companies releasing third-quarter results. Citigroup (C +3.1%) rose after posting profits ahead of consensus. J.P. Morgan (JPM -0.29%) edged lower following its mixed report. Shares of Johnson & Johnson (JNJ -2.13%) fell even after raising its full-year guidance. Intel (INTC +2.13%) rose ahead of its scheduled earnings release after the close.
Treasuries rose sharply on speculation weak German economic data may prompt the Fed to delay raising interest rates. Benchmark 10-year notes gained 23/32 to yield 2.20%. In commodity trading, WTI crude oil tumbled -4.4% to $81.97/barrel on the NYMEX. COMEX gold gained +0.4% to $1,233.60/ounce.
The CANSLIM.net Featured Stocks Page shows the most action-worthy candidates and their latest notes and a Headline Link directs members to the latest detailed analysis with data-packed graphs annotated by a Certified expert along with links to additional resources. The Premium Member Homepage includes "dynamic archives" to all prior pay reports published.
|
 Kenneth J. Gruneisen started out as a licensed stockbroker in August 1987, a couple of months prior to the historic stock market crash that took the Dow Jones Industrial Average down -22.6% in a single day. He has published daily fact-based fundamental and technical analysis on high-ranked stocks online for two decades. Through FACTBASEDINVESTING.COM, Kenneth provides educational articles, news, market commentary, and other information regarding proven investment systems that work in good times and bad.
Comments contained in the body of this report are technical opinions only and are not necessarily those of Gruneisen Growth Corp. The material herein has been obtained from sources believed to be reliable and accurate, however, its accuracy and completeness cannot be guaranteed. Our firm, employees, and customers may effect transactions, including transactions contrary to any recommendation herein, or have positions in the securities mentioned herein or options with respect thereto. Any recommendation contained in this report may not be suitable for all investors and it is not to be deemed an offer or solicitation on our part with respect to the purchase or sale of any securities. |
|
 |
Semiconductor and Retail Indexes Rose While Energy Shares Fell Again
Kenneth J. Gruneisen - Passed the CAN SLIM® Master's Exam
The Retail Index ($RLX +0.60%) was a positive influence on the major averages and financial shares had a slightly positive bias as the Broker/Dealer Index ($XBD +0.11%) and the Bank Index ($BKX +0.35%) both edged higher. The Integrated Oil Index ($XOI -1.30%) outpaced the Oil Services Index ($OSX -0.32%) to the downside. The Semiconductor Index ($SOX +1.86%) led the tech sector's bounce while the Networking Index ($NWX +0.88%) posted a smaller gain and the Biotechnology Index ($BTK -0.54%) edged lower. The Gold & Silver Index ($XAU +0.99%) also posted a gain.
Charts courtesy www.stockcharts.com
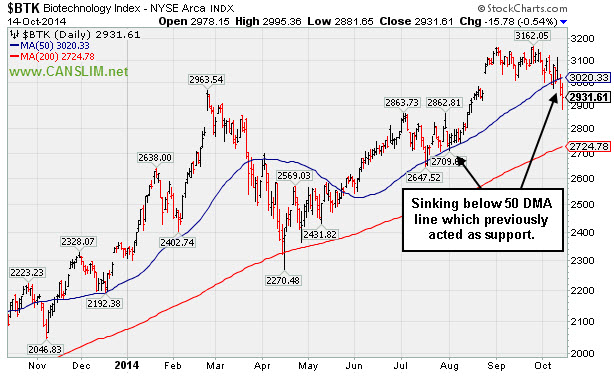
PICTURED: The Biotechnology Index ($BTK -0.54%) has been slumping below its 50-day moving average (DMA) line which previously acted as support.
| Oil Services |
$OSX |
232.93 |
-0.75 |
-0.32% |
-17.12% |
| Integrated Oil |
$XOI |
1,384.71 |
-18.22 |
-1.30% |
-7.88% |
| Semiconductor |
$SOX |
559.67 |
+10.20 |
+1.86% |
+4.61% |
| Networking |
$NWX |
287.88 |
+2.52 |
+0.88% |
-11.13% |
| Broker/Dealer |
$XBD |
158.61 |
+0.17 |
+0.11% |
-1.21% |
| Retail |
$RLX |
900.39 |
+5.37 |
+0.60% |
-4.19% |
| Gold & Silver |
$XAU |
79.27 |
+0.78 |
+0.99% |
-5.80% |
| Bank |
$BKX |
68.66 |
+0.24 |
+0.35% |
-0.87% |
| Biotech |
$BTK |
2,931.61 |
-15.78 |
-0.54% |
+25.80% |
|
|
|
 |
Prompt Rebound Above 50-Day Average an Encouraging Sign of Support
Kenneth J. Gruneisen - Passed the CAN SLIM® Master's Exam
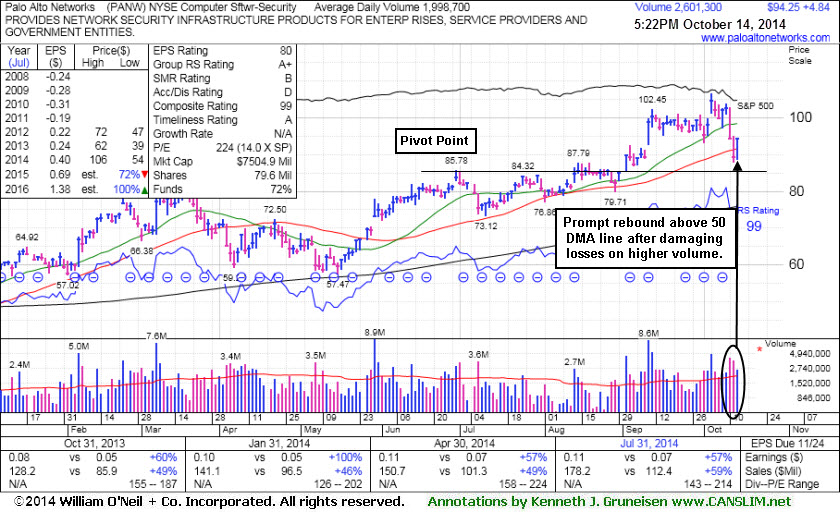
Palo Alto Networks (PANW +$1.71 or +1.76% to $99.14) managed a prompt rebound above its 50-day moving average (DMA) line today which helped its outlook improve after 2 consecutive volume-driven losses had violated the recent low ($93.00 on 10/01/14) and its 50 DMA line triggering technical sell signals. The rebound was an encouraging sign that the institutional crowd stepped in to provide support after the pullback.
PANW was last shown in this FSU section with annotated graphs on 9/24/14 under the headline, "Holding Ground Near Highs After Big Volume-Driven Gains". Prior highs in the $87 area define important support to watch below its 50-day moving average (DMA) line ($91.58). Resistance due to overhead supply up through the $106 level may hinder its ability to rally for the near term. Market weakness (M criteria) of late has prompted investors to reduce market exposure. Disciplined investors avoid chasing extended stocks more the +5% above prior highs and they always limit losses by selling any stock that falls more than -7% from their purchase price.
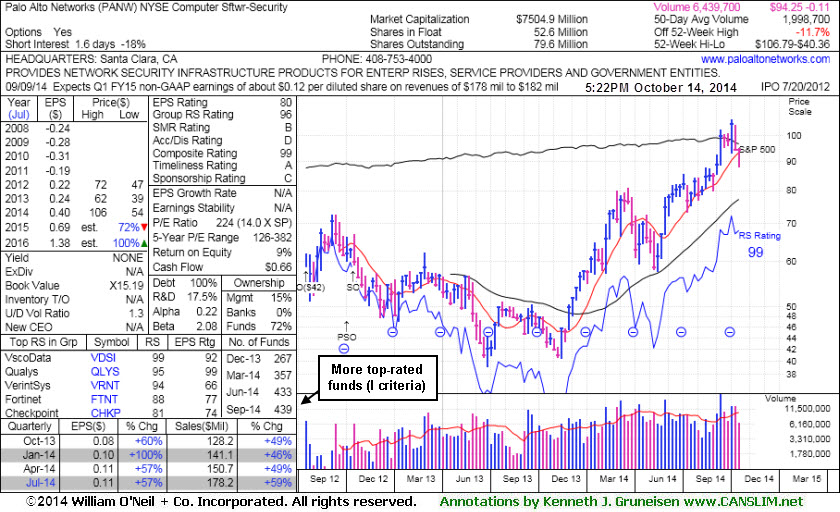
The high-ranked leader hailing from the Computer Software - Security industry group reported earnings +57% on +59% sales revenues for the Jul '14 quarter continuing its record of strong sales revenues increases and earnings above the +25% minimum guideline satisfying the C criteria. Its annual earnings (A criteria) history is a bit limited, but growth has been strong since its July 2012 IPO at $42. The number of top-rated funds owning its shares rose from 246 in Jun '13 to 439 in Sep '14, a reassuring sign concerning the I criteria. Its small supply (S criteria) of only 52.6 million shares in the public float is another favorable characteristic. Its current Up/Down Volume Ratio of 1.3 is an unbiased indication its shares have been under accumulation over the past 50 days.
|
|
|
Color Codes Explained :
Y - Better candidates highlighted by our
staff of experts.
G - Previously featured
in past reports as yellow but may no longer be buyable under the
guidelines.
***Last / Change / Volume data in this table is the closing quote data***
Symbol/Exchange
Company Name
Industry Group |
PRICE |
CHANGE
(%Change) |
Day High |
Volume
(% DAV)
(% 50 day avg vol) |
52 Wk Hi
% From Hi |
Featured
Date |
Price
Featured |
Pivot Featured |
|
Max Buy |
ACT
-
NYSE
Actavis plc
Medical-Generic Drugs
|
$222.07
|
-0.73
-0.33% |
$226.39
|
4,454,070
192.32% of 50 DAV
50 DAV is 2,316,000
|
$249.94
-11.15%
|
6/20/2014
|
$216.53
|
PP = $230.87
|
|
MB = $242.41
|
 Most Recent Note - 10/14/2014 11:59:18 AM
G - Rebounded from early lows today after nearly testing support at its 200 DMA line. On the prior session it violated its 50 DMA line and prior highs near $230 triggering technical sell signals with a damaging loss on higher volume. Only a prompt rebound above its 50 DMA line would help its outlook improve.
>>> FEATURED STOCK ARTICLE : Held Ground Above Prior Highs Defining Near-Term Support - 10/8/2014
View all notes |
Set NEW NOTE alert |
CANSLIM.net Company Profile |
SEC
News |
Chart |
Request a new note
C
A N
S L
I M


|
FB
-
NASDAQ
Facebook Inc Cl A
INTERNET
|
$73.59
|
+0.60
0.82% |
$74.18
|
50,154,103
157.14% of 50 DAV
50 DAV is 31,917,000
|
$79.71
-7.67%
|
9/9/2014
|
$76.67
|
PP = $76.84
|
|
MB = $80.68
|
Most Recent Note - 10/13/2014 5:45:49 PM
G - Failed to rebound today after the prior session's volume-driven loss violated its 50 DMA line and undercut prior lows ($73.07 on 9/16/14) triggering a technical sell signal.
>>> FEATURED STOCK ARTICLE : Fell Toward 50-day Moving Average; Recent Gains Lacked Great Volume - 9/25/2014
View all notes |
Set NEW NOTE alert |
CANSLIM.net Company Profile |
SEC
News |
Chart |
Request a new note
C
A N
S L
I M
|
PANW
-
NYSE
Palo Alto Networks
Computer Sftwr-Security
|
$94.25
|
+4.84
5.41% |
$94.50
|
2,602,301
130.25% of 50 DAV
50 DAV is 1,998,000
|
$106.79
-11.74%
|
7/30/2014
|
$84.21
|
PP = $85.88
|
|
MB = $90.17
|
Most Recent Note - 10/14/2014 5:57:05 PM
G - Today's prompt rebound above the 50 DMA line helped its outlook improve after 2 consecutive volume-driven losses violated the recent low ($93.00 on 10/01/14) and 50 DMA line triggering technical sell signals. See the latest FSU analysis for more details and new annotated graphs
>>> FEATURED STOCK ARTICLE : Prompt Rebound Above 50-Day Average an Encouraging Sign of Support - 10/14/2014
View all notes |
Set NEW NOTE alert |
CANSLIM.net Company Profile |
SEC
News |
Chart |
Request a new note
C
A N
S L
I M
|
STRT
-
NASDAQ
Strattec Security Corp
AUTOMOTIVE - Auto Parts
|
$78.35
|
+1.42
1.85% |
$79.35
|
22,442
93.51% of 50 DAV
50 DAV is 24,000
|
$89.87
-12.82%
|
9/19/2014
|
$86.06
|
PP = $89.97
|
|
MB = $94.47
|
Most Recent Note - 10/13/2014 5:54:43 PM
G - Finished in the upper half of its intra-day range today but slumped below its 50 DMA line raising concerns and its color code is changed to green. Poor market conditions (M criteria) have raised overriding concerns arguing against any new buying efforts until strength returns. Faces near term resistance due to overhead supply up through the $89 level.
>>> FEATURED STOCK ARTICLE : Consolidating Above Prior Highs and 50-Day Moving Average Line - 9/26/2014
View all notes |
Set NEW NOTE alert |
CANSLIM.net Company Profile |
SEC
News |
Chart |
Request a new note
C
A N
S L
I M
|
|
|
|
THESE ARE NOT BUY RECOMMENDATIONS!
Comments contained in the body of this report are technical
opinions only. The material herein has been obtained
from sources believed to be reliable and accurate, however,
its accuracy and completeness cannot be guaranteed.
This site is not an investment advisor, hence it does
not endorse or recommend any securities or other investments.
Any recommendation contained in this report may not
be suitable for all investors and it is not to be deemed
an offer or solicitation on our part with respect to
the purchase or sale of any securities. All trademarks,
service marks and trade names appearing in this report
are the property of their respective owners, and are
likewise used for identification purposes only.
This report is a service available
only to active Paid Premium Members.
You may opt-out of receiving report notifications
at any time. Questions or comments may be submitted
by writing to Premium Membership Services 665 S.E. 10 Street, Suite 201 Deerfield Beach, FL 33441-5634 or by calling 1-800-965-8307
or 954-785-1121.
|
|
|

