You are not logged in.
This means you
CAN ONLY VIEW reports that were published prior to Wednesday, July 24, 2024.
You
MUST UPGRADE YOUR MEMBERSHIP if you want to see any current reports.
AFTER MARKET UPDATE - WEDNESDAY, SEPTEMBER 27TH, 2023
Previous After Market Report Next After Market Report >>>
|
|
|
|
DOW |
-68.61 |
33,550.27 |
-0.20% |
|
Volume |
921,730,813 |
+9% |
|
Volume |
4,859,840,000 |
+3% |
|
NASDAQ |
+29.24 |
13,092.85 |
+0.22% |
|
Advancers |
1,506 |
53% |
|
Advancers |
2,297 |
53% |
|
S&P 500 |
+0.98 |
4,274.51 |
+0.02% |
|
Decliners |
1,321 |
47% |
|
Decliners |
2,009 |
47% |
|
Russell 2000 |
+17.29 |
1,778.90 |
+0.98% |
|
52 Wk Highs |
33 |
|
|
52 Wk Highs |
33 |
|
|
S&P 600 |
+11.70 |
1,146.15 |
+1.03% |
|
52 Wk Lows |
290 |
|
|
52 Wk Lows |
339 |
|
|
Damaging losses have signaled a more serious market correction (M criteria). During market corrections, disciplined investors know to reduce exposure and raise cash by selling any weakening stocks on a case-by-case basis.
|
 |
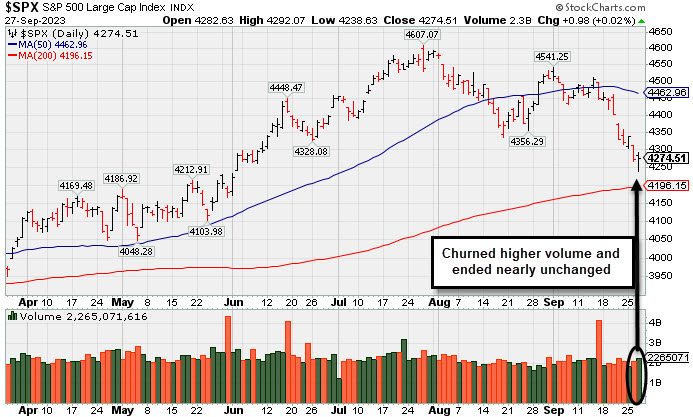
Major Indices Ended Mixed After Recovering From Lows
Kenneth J. Gruneisen - Passed the CAN SLIM® Master's Exam
As oil prices and market rates moved higher, the major indices finished the session mixed and recovered off their lows. The volume totals were higher than the prior session on the NYSE and on the Nasdaq exchange. Advancers led decliners by a narrow margin on the NYSE and on the Nasdaq exchange. There were 8 high-ranked companies from the Leaders List that hit a new 52-week high and were listed on the BreakOuts Page versus the total of 3 on the prior session. New 52-week lows totals solidly outnumbered new 52-week highs totals on the NYSE and on the Nasdaq exchange. The major indices are in a correction (M criteria). New buying efforts should be avoided until a new rally is confirmed by a solid follow-through day.
PICTURED: The S&P 500 Index churned higher volume and finished nearly unchanged. It has recently been slumping near its 200-day moving average (DMA) line.
The 10-yr note yield settled seven basis points higher at 4.63%. The 2-yr note yield settled unchanged from yesterday at 5.14%. The U.S. Dollar Index rose 0.4% to 106.70.
The PHLX Semiconductor Index rose 1.0%. The Russell 2000 paced index level gains (+1.0%) thanks to its energy components. WTI crude oil futures jumped 3.8% to $93.93/bbl, stoking concerns about inflation expectations, rising gas prices, and a slowdown in consumer spending. That move helped drive a 2.5% gain in the S&P 500 energy sector. The next best performing sector was industrials (+0.8%) followed by communication services (+0.5%) and information technology (+0.2%). The rate-sensitive utilities sector (-1.9%) saw the steepest decline.
|
 Kenneth J. Gruneisen started out as a licensed stockbroker in August 1987, a couple of months prior to the historic stock market crash that took the Dow Jones Industrial Average down -22.6% in a single day. He has published daily fact-based fundamental and technical analysis on high-ranked stocks online for two decades. Through FACTBASEDINVESTING.COM, Kenneth provides educational articles, news, market commentary, and other information regarding proven investment systems that work in good times and bad.
Comments contained in the body of this report are technical opinions only and are not necessarily those of Gruneisen Growth Corp. The material herein has been obtained from sources believed to be reliable and accurate, however, its accuracy and completeness cannot be guaranteed. Our firm, employees, and customers may effect transactions, including transactions contrary to any recommendation herein, or have positions in the securities mentioned herein or options with respect thereto. Any recommendation contained in this report may not be suitable for all investors and it is not to be deemed an offer or solicitation on our part with respect to the purchase or sale of any securities. |
|
 |
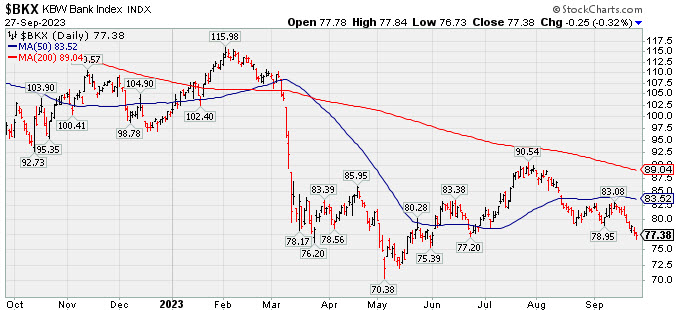
Energy-Linked Groups and Tech Indexes Rose
Kenneth J. Gruneisen - Passed the CAN SLIM® Master's Exam
The Retail Index ($RLX -0.08%) and the Broker/Dealer Index ($XBD +0.01%) both were little changed. The Semiconductor Index ($SOX +0.95%), Networking Index ($NWX +0.61%) and the Biotech Index ($BTK +0.60%) each posted modest gains. Commodity-linked groups were mixed as the Oil Services Index ($OSX +3.42%) and the Integrated Oil Index ($XOI +2.42%) both posted solid gains while the Gold & Silver Index ($XAU -2.60%) was a standout decliner.
PICTURED: The Bank Index ($BKX -0.32%) edged lower and has been slumping back toward its 2023 low.
| Oil Services |
$OSX |
97.46 |
+3.22 |
+3.42% |
+16.22% |
| Integrated Oil |
$XOI |
1,967.20 |
+46.50 |
+2.42% |
+10.07% |
| Semiconductor |
$SOX |
3,361.41 |
+31.79 |
+0.95% |
+32.75% |
| Networking |
$NWX |
733.13 |
+4.45 |
+0.61% |
-6.41% |
| Broker/Dealer |
$XBD |
480.01 |
+0.04 |
+0.01% |
+6.87% |
| Retail |
$RLX |
3,337.54 |
-2.64 |
-0.08% |
+21.19% |
| Gold & Silver |
$XAU |
107.19 |
-2.86 |
-2.60% |
-11.31% |
| Bank |
$BKX |
77.38 |
-0.25 |
-0.32% |
-23.27% |
| Biotech |
$BTK |
5,060.46 |
+30.25 |
+0.60% |
-4.18% |
|
|
|
 |
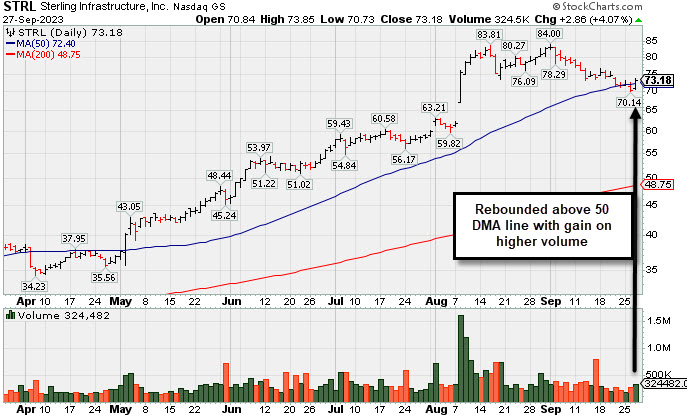
Found Support and Rebounded Above 50-Day Moving Average
Kenneth J. Gruneisen - Passed the CAN SLIM® Master's Exam
Sterling Infrastructure (STRL +$2.86 or +4.07% to $73.18) posted a gain with higher (but still below average) volume and closed back above its 50-day moving average (DMA) line ($72.39). It was reassuring to see it find support near that important short-term average. Fundamentals remain strong.
STRL has traded up +159% since it was highlighted in yellow with pivot point cited based on its 11/08/22 high plus 10 cents in the 12/14/22 mid-day report (read here). Volume totals have been cooling while it has sputtered since last covered in detail on 9/13/23 with an annotated graph under the headline, "7th Straight Loss Off High for Sterling Infrastructure".
STRL hails from the Building - Heavy Construction industry group which is currently ranked 14th on the 197 Industry Groups list (L criteria). It has a 97 Earnings Per Share Rating and 7 of the last 8 quarterly comparisons were well above the +25% minimum earnings guideline (C criteria). Annual earnings (A criteria) growth has been strong and steady since FY '17.
The company has a small supply of only 30.8 million shares outstanding. That can lead to greater price volatility in the event of institutional buying or selling. The number of top-rated funds owning its shares rose from 337 in Dec '21 to 422 in Jun '23. Its current Up/Down Volume Ratio of 1.4 is an unbiased indication its shares have been under accumulation over the past 50 days.
Symbol/Exchange
Company Name
Industry Group | PRICE | CHANGE
(%Change) | Day High | Volume
(% DAV)
(% 50 day avg vol) | 52 Wk Hi
% From Hi | Featured
Date | Price
Featured | Pivot Featured | | Max Buy |  STRL - NASDAQ STRL - NASDAQ
Sterling Infrastructure
Bldg-Heavy Construction | $73.18 | +2.86
4.07% | $73.85 | 324,481
79.92% of 50 DAV
50 DAV is 406,000 | $84.00
-12.88%
| 12/14/2022 | $32.41 | PP = $33.72 | | MB = $35.41 |  Most Recent Note - 9/27/2023 5:04:08 PM Most Recent Note - 9/27/2023 5:04:08 PM
G - Rebounded above its 50 DMA line ($72.39) with today''s gain backed by higher (but still below-average) volume. Fundamentals remain strong. See the latest FSU analysis for more details and a new annotated graph.
>>> FEATURED STOCK ARTICLE : Found Support and Rebounded Above 50-Day Moving Average - 9/27/2023 | View all notes | Set NEW NOTE alert | Company Profile | SEC News | Chart | Request a new note C A S I | FIX - NYSE
Comfort Systems USA
Bldg-A/C and Heating Prds | $172.77 | +3.17
1.87% | $173.76 | 220,577
89.30% of 50 DAV
50 DAV is 247,000 | $192.33
-10.17%
| 4/27/2023 | $148.85 | PP = $152.23 | | MB = $159.84 | Most Recent Note - 9/26/2023 5:52:51 PM
G - Suffered a loss today with light volume. Only a prompt rebound above the 50 DMA line would help its outlook improve. Fundamentals remain strong.
>>> FEATURED STOCK ARTICLE : Violated 50-Day Moving Average With a Damaging Gap Down - 9/21/2023 | View all notes | Set NEW NOTE alert | Company Profile | SEC News | Chart | Request a new note C A S I | ANET - NYSE
Arista Networks
Computer-Networking | $181.60 | +3.68
2.07% | $183.00 | 2,166,115
82.11% of 50 DAV
50 DAV is 2,638,000 | $198.70
-8.61%
| 8/1/2023 | $188.84 | PP = $178.46 | | MB = $187.38 | Most Recent Note - 9/26/2023 5:51:38 PM
G - Quietly sputtering below its 50 DMA line ($181) today with another loss on light volume. Only a prompt rebound above the 50 DMA line would help its outlook improve. Fundamentals remain strong.
>>> FEATURED STOCK ARTICLE : Orderly Pullback Below "Max Buy" Level - 9/15/2023 | View all notes | Set NEW NOTE alert | Company Profile | SEC News | Chart | Request a new note C A S I | MEDP - NASDAQ
Medpace Holdings
Medical-Research Eqp/Svc | $248.00 | +5.85
2.42% | $248.76 | 259,228
89.39% of 50 DAV
50 DAV is 290,000 | $282.73
-12.28%
| 7/25/2023 | $196.32 | PP = $241.57 | | MB = $253.65 | Most Recent Note - 9/27/2023 5:06:39 PM
G - Holding its ground for the past week after violating its 50 DMA line ($259.53) with volume-driven losses. A rebound above the 50 DMA line is needed for its outlook to improve. Fundamentals remain strong.
>>> FEATURED STOCK ARTICLE : Damaging Streak of Losses Violated 50-Day Moving Average Line - 9/22/2023 | View all notes | Set NEW NOTE alert | Company Profile | SEC News | Chart | Request a new note C A S I | COKE - NASDAQ
Coca-Cola Consolidated
Beverages-Non-Alcoholic | $636.60 | -9.40
-1.46% | $648.70 | 23,452
57.20% of 50 DAV
50 DAV is 41,000 | $745.53
-14.61%
| 8/3/2023 | $718.56 | PP = $694.30 | | MB = $729.02 | Most Recent Note - 9/25/2023 5:25:02 PM
G - Volume totals have been cooling while recently sputtering below its 50 DMA line ($672.75) after volume-driven losses. A rebound above the 50 DMA line is needed to help its outlook improve. See the latest FSU analysis for more details and a new annotated graph.
>>> FEATURED STOCK ARTICLE : Lingering Below 50 DMA Line and Perched -12.3% Off High - 9/25/2023 | View all notes | Set NEW NOTE alert | Company Profile | SEC News | Chart | Request a new note C A S I | Symbol/Exchange
Company Name
Industry Group | PRICE | CHANGE
(%Change) | Day High | Volume
(% DAV)
(% 50 day avg vol) | 52 Wk Hi
% From Hi | Featured
Date | Price
Featured | Pivot Featured | | Max Buy | PLUS - NASDAQ
ePlus
Computer-Tech Services | $63.34 | +1.05
1.69% | $63.75 | 60,508
56.55% of 50 DAV
50 DAV is 107,000 | $75.90
-16.55%
| 8/8/2023 | $67.60 | PP = $62.92 | | MB = $66.07 | Most Recent Note - 9/25/2023 5:27:48 PM
Y - Volume totals have been cooling while recently consolidating above its 50 DMA line ($62.46). More damaging losses may trigger a technical sell signal.
>>> FEATURED STOCK ARTICLE : Still Consolidating Above 50 DMA Line - 9/12/2023 | View all notes | Set NEW NOTE alert | Company Profile | SEC News | Chart | Request a new note C A S I |
|
|
|
Color Codes Explained :
Y - Better candidates highlighted by our
staff of experts.
G - Previously featured
in past reports as yellow but may no longer be buyable under the
guidelines.
***Last / Change / Volume data in this table is the closing quote data***
|
|
|
THESE ARE NOT BUY RECOMMENDATIONS!
Comments contained in the body of this report are technical
opinions only. The material herein has been obtained
from sources believed to be reliable and accurate, however,
its accuracy and completeness cannot be guaranteed.
This site is not an investment advisor, hence it does
not endorse or recommend any securities or other investments.
Any recommendation contained in this report may not
be suitable for all investors and it is not to be deemed
an offer or solicitation on our part with respect to
the purchase or sale of any securities. All trademarks,
service marks and trade names appearing in this report
are the property of their respective owners, and are
likewise used for identification purposes only.
This report is a service available
only to active Paid Premium Members.
You may opt-out of receiving report notifications
at any time. Questions or comments may be submitted
by writing to Premium Membership Services 665 S.E. 10 Street, Suite 201 Deerfield Beach, FL 33441-5634 or by calling 1-800-965-8307
or 954-785-1121.
|
|
|