You are not logged in.
This means you
CAN ONLY VIEW reports that were published prior to Wednesday, July 24, 2024.
You
MUST UPGRADE YOUR MEMBERSHIP if you want to see any current reports.
AFTER MARKET UPDATE - MONDAY, SEPTEMBER 18TH, 2023
Previous After Market Report Next After Market Report >>>
|
|
|
|
DOW |
+6.06 |
34,624.30 |
+0.02% |
|
Volume |
858,950,730 |
-75% |
|
Volume |
4,866,357,100 |
-43% |
|
NASDAQ |
+1.90 |
13,710.24 |
+0.01% |
|
Advancers |
1,277 |
45% |
|
Advancers |
1,615 |
37% |
|
S&P 500 |
+3.21 |
4,453.53 |
+0.07% |
|
Decliners |
1,554 |
55% |
|
Decliners |
2,748 |
63% |
|
Russell 2000 |
-12.73 |
1,834.30 |
-0.69% |
|
52 Wk Highs |
40 |
|
|
52 Wk Highs |
58 |
|
|
S&P 600 |
-6.82 |
1,179.58 |
-0.57% |
|
52 Wk Lows |
96 |
|
|
52 Wk Lows |
270 |
|
|
 |
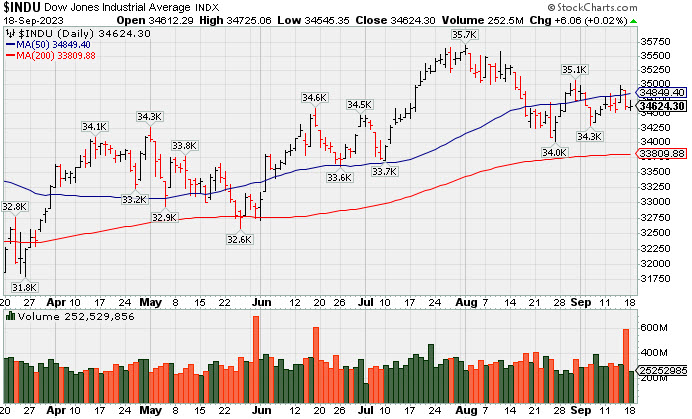
Major Indices Lacked Conviction and Settled Flat
Kenneth J. Gruneisen - Passed the CAN SLIM® Master's Exam
The major indices settled flat after pulling back from their highs of the day. The Russell 2000 was relatively weak, falling -0.7%. Volume totals reported were lighter than the prior session on the NYSE and on the Nasdaq exchange, as Friday's totals were inflated due to options expirations. Breadth was negative as decliners led advancers by a 5-4 margin on the NYSE and by a 7-4 margin on the Nasdaq exchange. There were 11 high-ranked companies from the Leaders List that hit a new 52-week high and were listed on the BreakOuts Page versus the total of 14 on the prior session. New 52-week lows solidly outnumbered new 52-week highs totals on the NYSE and on the Nasdaq exchange. The major indices are in an uptrend under pressure (M criteria).
PICTURED: The Dow Jones Industrial Average posted a quiet gain on Monday. It closed below its 50-day moving average (DMA) line with heavy volume behind Friday's loss attributed to options expirations.
The lack of conviction was driven by some hesitation ahead of the FOMC meeting on Wednesday. The market is not expecting a rate hike and will be more focused on the updated Summary of Economic Projections and dot plot, as well as the tone that Fed Chair Powell takes at his press conference. The 2-yr note yield and 10-yr note yield settled unchanged from Friday at 5.04% and 4.32%, respectively.
Apple (AAPL +1.69%) rose following favorable comments from analysts. The S&P 500 information technology sector (+0.5%) and energy sector (+0.7%) were standout performers. The consumer discretionary sector (-1.0%) fell while Ford (F -2.14%), General Motors (GM -1.80%), and Stellantis (STLA -1.61%) suffered unanimous losses. The UAW rejected a Stellantis offer to increase pay by nearly 21% over the contract term, with a 10% immediate increase.
The NAHB Housing Market Index dropped to 45 in September from 50 in August. Looking ahead, Tuesday's calendar includes the August Housing Starts and Building Permits report.
|
 Kenneth J. Gruneisen started out as a licensed stockbroker in August 1987, a couple of months prior to the historic stock market crash that took the Dow Jones Industrial Average down -22.6% in a single day. He has published daily fact-based fundamental and technical analysis on high-ranked stocks online for two decades. Through FACTBASEDINVESTING.COM, Kenneth provides educational articles, news, market commentary, and other information regarding proven investment systems that work in good times and bad.
Comments contained in the body of this report are technical opinions only and are not necessarily those of Gruneisen Growth Corp. The material herein has been obtained from sources believed to be reliable and accurate, however, its accuracy and completeness cannot be guaranteed. Our firm, employees, and customers may effect transactions, including transactions contrary to any recommendation herein, or have positions in the securities mentioned herein or options with respect thereto. Any recommendation contained in this report may not be suitable for all investors and it is not to be deemed an offer or solicitation on our part with respect to the purchase or sale of any securities. |
|
 |
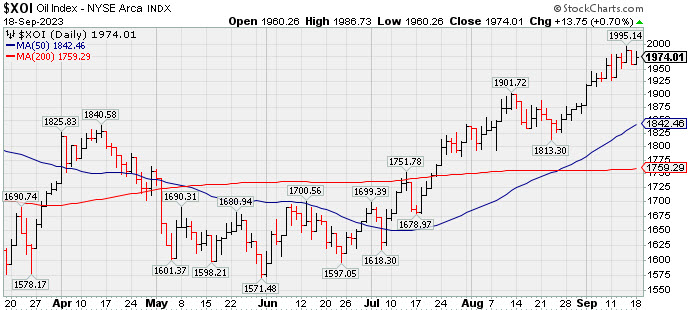
Commodity-Linked Groups Led Gainers
Kenneth J. Gruneisen - Passed the CAN SLIM® Master's Exam
The Retail Index ($RLX -0.56%) and the Bank Index ($BKX -0.65%) both suffered modest losses while the Broker/Dealer Index ($XBD +0.03%) finished flat on Monday. The tech sector was mixed as the Biotech Index ($BTK -1.36%) outpaced the Networking Index ($NWX -0.23%) to the downside, meanwhile the Semiconductor Index ($SOX +0.46%) edged higher. Commodity-linked groups had a positive bias as the Oil Services Index ($OSX +0.48%) and Gold & Silver Index ($XAU +0.22%) posted small gains.
PICTURED: The Integrated Oil Index ($XOI +0.70%) is perched near its 2023 high, well above its 50-day moving average (DMA) line.
| Oil Services |
$OSX |
97.42 |
+0.46 |
+0.48% |
+16.17% |
| Integrated Oil |
$XOI |
1,974.01 |
+13.75 |
+0.70% |
+10.45% |
| Semiconductor |
$SOX |
3,492.47 |
+16.07 |
+0.46% |
+37.93% |
| Networking |
$NWX |
778.35 |
-1.77 |
-0.23% |
-0.63% |
| Broker/Dealer |
$XBD |
507.58 |
+0.14 |
+0.03% |
+13.01% |
| Retail |
$RLX |
3,613.74 |
-20.45 |
-0.56% |
+31.22% |
| Gold & Silver |
$XAU |
118.93 |
+0.26 |
+0.22% |
-1.60% |
| Bank |
$BKX |
81.78 |
-0.53 |
-0.65% |
-18.91% |
| Biotech |
$BTK |
5,112.54 |
-70.55 |
-1.36% |
-3.19% |
|
|
|
 |
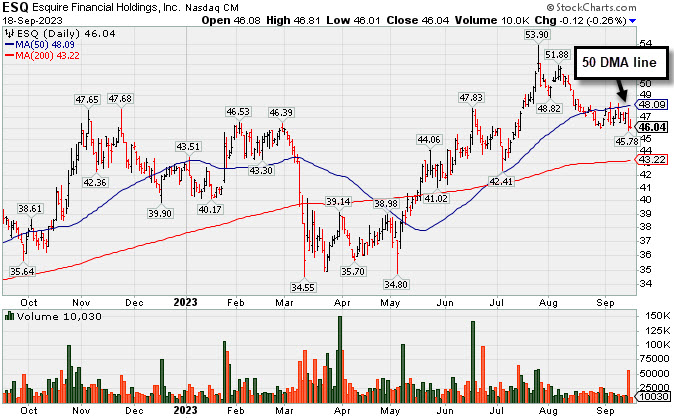
Met Resistance at 50-Day Moving Average After Slumping
Kenneth J. Gruneisen - Passed the CAN SLIM® Master's Exam
Esquire Financial Hldgs (ESQ -$0.12 or -0.26% to $46.04) was little changed today but suffered a volume-driven loss on the prior session. Its 50-day moving average (DMA) line ($48) acted as resistance in recent weeks while slipping below prior highs in the $47 area. A rebound above the 50 DMA line is needed for its outlook to improve.
Fundamentals remain strong after it reported Jun '23 quarterly earnings +41% on +35% sales revenues versus the year ago period, continuing its strong earnings track record. It has a highest possible 99 Earnings Per Share Rating. It has reported 5 consecutive quarterly comparisons with an earnings increase above the +25% minimum guideline (C criteria). Its annual earnings growth (A criteria) history has been strong.
This thinly-traded holding company in the Finance - Commercial Loans industry group has a small supply (S criteria) of only 6.5 million shares in the public float, which can contribute to greater price volatility in the event of institutional buying or selling. It completed its $14 IPO on 6/29/17. The number of top-rated funds owning its shares rose form 64 in Sep '21 to 202 in Jun '23, a reassuring sign concerning the I criteria. Its current Up/Down Volume Ratio of 1.2 is an unbiased indication its shares have been under accumulation over the past 50 days.
|
|
|
Color Codes Explained :
Y - Better candidates highlighted by our
staff of experts.
G - Previously featured
in past reports as yellow but may no longer be buyable under the
guidelines.
***Last / Change / Volume data in this table is the closing quote data***
|
|
|
THESE ARE NOT BUY RECOMMENDATIONS!
Comments contained in the body of this report are technical
opinions only. The material herein has been obtained
from sources believed to be reliable and accurate, however,
its accuracy and completeness cannot be guaranteed.
This site is not an investment advisor, hence it does
not endorse or recommend any securities or other investments.
Any recommendation contained in this report may not
be suitable for all investors and it is not to be deemed
an offer or solicitation on our part with respect to
the purchase or sale of any securities. All trademarks,
service marks and trade names appearing in this report
are the property of their respective owners, and are
likewise used for identification purposes only.
This report is a service available
only to active Paid Premium Members.
You may opt-out of receiving report notifications
at any time. Questions or comments may be submitted
by writing to Premium Membership Services 665 S.E. 10 Street, Suite 201 Deerfield Beach, FL 33441-5634 or by calling 1-800-965-8307
or 954-785-1121.
|
|
|