***Last / Change / Volume data in this table is the closing quote data***
Symbol/Exchange
Company Name
Industry Group |
PRICE |
CHANGE
(%Change) |
Day High |
Volume
(% DAV)
(% 50 day avg vol) |
52 Wk Hi
% From Hi |
Featured
Date |
Price
Featured |
Pivot Featured |
|
Max Buy |
ALXN
-
NASDAQ
Alexion Pharmaceuticals
DRUGS - Drug Manufacturers - Other
|
$107.54
|
+0.60
0.56% |
$108.31
|
1,475,041
108.07% of 50 DAV
50 DAV is 1,364,900
|
$109.96
-2.20%
|
8/23/2012
|
$103.70
|
PP = $110.06
|
|
MB = $115.56
|
 Most Recent Note - 8/28/2012 4:29:06 PM
Y - Posted a 3rd consecutive gain today and it is perched within close striking distance of its 52-week high. Subsequent volume-driven gains above its pivot point may trigger a new (or add-on) technical buy signal.
>>> The latest Featured Stock Update with an annotated graph appeared on 8/23/2012. Click here.
View all notes |
Alert me of new notes |
CANSLIM.net Company Profile |
SEC |
Zacks Reports |
StockTalk |
News |
Chart |
Request a new note
C
A N
S L
I M


|
ASPS
-
NASDAQ
Altisource Ptf Sltns Sa
REAL ESTATE - Property Management/Developmen
|
$85.49
|
+1.04
1.23% |
$85.55
|
59,599
43.19% of 50 DAV
50 DAV is 138,000
|
$92.29
-7.37%
|
6/5/2012
|
$60.01
|
PP = $63.00
|
|
MB = $66.15
|
Most Recent Note - 8/27/2012 3:31:20 PM
G - Above average volume was behind losses last week while retreating from its all-time high. It has been repeatedly noted - "Extended from its prior base, and its 50 DMA line defines near-term support to watch."
>>> The latest Featured Stock Update with an annotated graph appeared on 8/3/2012. Click here.
View all notes |
Alert me of new notes |
CANSLIM.net Company Profile |
SEC |
Zacks Reports |
StockTalk |
News |
Chart |
Request a new note
C
A N
S L
I M
|
CFNL
-
NASDAQ
Cardinal Financial Corp
BANKING - Regional - Southeast Banks
|
$12.90
|
-0.03
-0.23% |
$12.99
|
72,524
106.65% of 50 DAV
50 DAV is 68,000
|
$13.30
-3.01%
|
8/17/2012
|
$12.84
|
PP = $13.31
|
|
MB = $13.98
|
Most Recent Note - 8/27/2012 3:33:39 PM
Y - Volume totals have been cooling since recently featured, even while briefly touching a new 52-week high last week. Volume-driven gains above its pivot point may trigger a new (or add-on) technical buy signal, meanwhile its 50 DMA line defines important support.
>>> The latest Featured Stock Update with an annotated graph appeared on 8/21/2012. Click here.
View all notes |
Alert me of new notes |
CANSLIM.net Company Profile |
SEC |
Zacks Reports |
StockTalk |
News |
Chart |
Request a new note
C
A N
S L
I M
|
CMCSA
-
NASDAQ
Comcast Corp Cl A
MEDIA - CATV Systems
|
$33.95
|
-0.02
-0.06% |
$34.07
|
10,041,724
77.36% of 50 DAV
50 DAV is 12,980,200
|
$35.16
-3.44%
|
6/11/2012
|
$29.94
|
PP = $30.98
|
|
MB = $32.53
|
Most Recent Note - 8/28/2012 4:17:57 PM
G - Consolidating in a very tight trading range for the past few weeks. Fundamental concerns were raised as it recently reported earnings +19% on +6% sales revenues for the Jun '12 quarter, below the fact-based investment system's +25% minimum guideline for the C criteria.
>>> The latest Featured Stock Update with an annotated graph appeared on 8/15/2012. Click here.
View all notes |
Alert me of new notes |
CANSLIM.net Company Profile |
SEC |
Zacks Reports |
StockTalk |
News |
Chart |
Request a new note
C
A N
S L
I M
|
DG
-
NYSE
Dollar General Corp
RETAIL - Discount, Variety Stores
|
$48.82
|
-0.03
-0.06% |
$48.93
|
2,428,443
80.95% of 50 DAV
50 DAV is 2,999,900
|
$56.04
-12.88%
|
7/16/2012
|
$54.68
|
PP = $56.14
|
|
MB = $58.95
|
Most Recent Note - 8/28/2012 4:22:23 PM
Today marked its 7th consecutive loss and it will be dropped from the Featured stocks list tonight due to weak action. A rebound above its 50 DMA line is needed for its technical stance and outlook to improve, and a subsequent rally above its August high would also complete a bullish "double bottom" pattern.
>>> The latest Featured Stock Update with an annotated graph appeared on 8/16/2012. Click here.
View all notes |
Alert me of new notes |
CANSLIM.net Company Profile |
SEC |
Zacks Reports |
StockTalk |
News |
Chart |
Request a new note
C
A N
S L
I M
|
Symbol/Exchange
Company Name
Industry Group |
PRICE |
CHANGE
(%Change) |
Day High |
Volume
(% DAV)
(% 50 day avg vol) |
52 Wk Hi
% From Hi |
Featured
Date |
Price
Featured |
Pivot Featured |
|
Max Buy |
ECPG
-
NASDAQ
Encore Capital Group Inc
FINANCIAL SERVICES - Credit Services
|
$28.08
|
+0.03
0.11% |
$28.31
|
70,880
48.02% of 50 DAV
50 DAV is 147,600
|
$30.47
-7.84%
|
8/3/2012
|
$29.91
|
PP = $30.45
|
|
MB = $31.97
|
Most Recent Note - 8/27/2012 3:29:37 PM
G - Color code is changed to green while sputtering below its 50 DMA line and -8% off its 52-week high today. Completed a Secondary Offering on 8/08/12. Gains above its 50 DMA line are needed for its outlook to improve.
>>> The latest Featured Stock Update with an annotated graph appeared on 8/6/2012. Click here.
View all notes |
Alert me of new notes |
CANSLIM.net Company Profile |
SEC |
Zacks Reports |
StockTalk |
News |
Chart |
Request a new note
C
A N
S L
I M
|
EXPE
-
NASDAQ
Expedia Inc
INTERNET - Internet Information Providers
|
$52.88
|
+0.70
1.34% |
$53.15
|
1,986,975
54.72% of 50 DAV
50 DAV is 3,630,900
|
$59.50
-11.13%
|
4/27/2012
|
$41.80
|
PP = $35.57
|
|
MB = $37.35
|
Most Recent Note - 8/27/2012 3:14:08 PM
G - Volume totals have been below average while recently consolidating above prior highs and its 50 DMA line defining important near-term chart support in the $50 area.
>>> The latest Featured Stock Update with an annotated graph appeared on 8/14/2012. Click here.
View all notes |
Alert me of new notes |
CANSLIM.net Company Profile |
SEC |
Zacks Reports |
StockTalk |
News |
Chart |
Request a new note
C
A N
S L
I M
|
GPX
-
NYSE
G P Strategies Corp
DIVERSIFIED SERVICES - Education and Training Services
|
$20.18
|
+0.12
0.60% |
$20.19
|
23,224
29.85% of 50 DAV
50 DAV is 77,800
|
$20.30
-0.59%
|
6/29/2012
|
$18.01
|
PP = $18.15
|
|
MB = $19.06
|
Most Recent Note - 8/27/2012 12:20:04 PM
G - Still perched near its 52-week high today, slightly extended from its prior base. Churned above average volume recently without making much meaningful price progress, a sign of distributional pressure. Prior highs and its 50 DMA line define chart support in the $18 area.
>>> The latest Featured Stock Update with an annotated graph appeared on 8/7/2012. Click here.
View all notes |
Alert me of new notes |
CANSLIM.net Company Profile |
SEC |
Zacks Reports |
StockTalk |
News |
Chart |
Request a new note
C
A N
S L
I M
|
HMSY
-
NASDAQ
H M S Holdings Corp
COMPUTER SOFTWARE and SERVICES - Healthcare Information Service
|
$34.53
|
+0.45
1.32% |
$34.63
|
489,234
52.38% of 50 DAV
50 DAV is 934,000
|
$37.19
-7.15%
|
7/27/2012
|
$33.91
|
PP = $34.83
|
|
MB = $36.57
|
Most Recent Note - 8/24/2012 12:06:38 PM
G - Rebounding from earlier lows below its 50 DMA line after gapping down today for a damaging loss with heavy volume. Color code was changed to green as weak technical action raised concerns. Distributional action was previously noted after recent gains lacked sufficient volume conviction to trigger a proper technical buy signal.
>>> The latest Featured Stock Update with an annotated graph appeared on 8/22/2012. Click here.
View all notes |
Alert me of new notes |
CANSLIM.net Company Profile |
SEC |
Zacks Reports |
StockTalk |
News |
Chart |
Request a new note
C
A N
S L
I M
|
LKQ
-
NASDAQ
L K Q Corp
WHOLESALE - Auto Parts
|
$38.47
|
+0.46
1.21% |
$38.56
|
322,739
42.44% of 50 DAV
50 DAV is 760,500
|
$39.20
-1.86%
|
8/9/2012
|
$37.93
|
PP = $37.44
|
|
MB = $39.31
|
Most Recent Note - 8/28/2012 4:26:17 PM
Y - Quietly consolidating near its 52-week high, still trading above its pivot point and yet below its "max buy" level. Prior highs in the $37 area define initial support to watch above its 50 DMA line.
>>> The latest Featured Stock Update with an annotated graph appeared on 8/10/2012. Click here.
View all notes |
Alert me of new notes |
CANSLIM.net Company Profile |
SEC |
Zacks Reports |
StockTalk |
News |
Chart |
Request a new note
C
A N
S L
I M
|
Symbol/Exchange
Company Name
Industry Group |
PRICE |
CHANGE
(%Change) |
Day High |
Volume
(% DAV)
(% 50 day avg vol) |
52 Wk Hi
% From Hi |
Featured
Date |
Price
Featured |
Pivot Featured |
|
Max Buy |
MIDD
-
NASDAQ
Middleby Corp
MANUFACTURING - Diversified Machinery
|
$113.03
|
+0.34
0.30% |
$113.66
|
146,646
149.79% of 50 DAV
50 DAV is 97,900
|
$119.74
-5.60%
|
8/9/2012
|
$118.60
|
PP = $104.92
|
|
MB = $110.17
|
Most Recent Note - 8/28/2012 12:30:08 PM
G - Still quietly consolidating -5.6% off its 52-week high today, extended from its prior base. Its 50 DMA line and prior highs in the $104 area define important chart support to watch.
>>> The latest Featured Stock Update with an annotated graph appeared on 8/13/2012. Click here.
View all notes |
Alert me of new notes |
CANSLIM.net Company Profile |
SEC |
Zacks Reports |
StockTalk |
News |
Chart |
Request a new note
C
A N
S L
I M
|
N
-
NYSE
Netsuite Inc
DIVERSIFIED SERVICES - Business/Management Services
|
$55.43
|
-0.14
-0.25% |
$55.88
|
265,490
36.40% of 50 DAV
50 DAV is 729,300
|
$59.22
-6.40%
|
8/20/2012
|
$55.88
|
PP = $59.32
|
|
MB = $62.29
|
Most Recent Note - 8/27/2012 3:18:14 PM
Y - Volume totals have been cooling while consolidating in a tight range near its 52-week high. A volume-driven gain above its pivot point may trigger a new (or add-on) technical buy signal. Meanwhile, its 50 DMA line defines important near-term support.
>>> The latest Featured Stock Update with an annotated graph appeared on 8/20/2012. Click here.
View all notes |
Alert me of new notes |
CANSLIM.net Company Profile |
SEC |
Zacks Reports |
StockTalk |
News |
Chart |
Request a new note
C
A N
S L
I M
|
NSM
-
NYSE
Nationstar Mtg Hldgs Inc
FINANCIAL SERVICES - Credit Services
|
$27.32
|
+1.42
5.48% |
$27.36
|
1,391,228
168.82% of 50 DAV
50 DAV is 824,100
|
$28.75
-4.97%
|
6/27/2012
|
$20.29
|
PP = $20.46
|
|
MB = $21.48
|
Most Recent Note - 8/28/2012 12:39:24 PM
G - Trading up today following a "positive reversal" on the prior session. It is extended from any sound base pattern. Prior highs in the $25 area define near-term support to watch on pullbacks.
>>> The latest Featured Stock Update with an annotated graph appeared on 8/1/2012. Click here.
View all notes |
Alert me of new notes |
CANSLIM.net Company Profile |
SEC |
Zacks Reports |
StockTalk |
News |
Chart |
Request a new note
C
A N
S L
I M
|
OSIS
-
NASDAQ
O S I Systems Inc
ELECTRONICS - Semiconductor Equipment and Mate
|
$73.23
|
-0.43
-0.58% |
$73.42
|
71,899
63.74% of 50 DAV
50 DAV is 112,800
|
$75.00
-2.36%
|
8/9/2012
|
$67.71
|
PP = $67.48
|
|
MB = $70.85
|
Most Recent Note - 8/27/2012 3:22:13 PM
G - Still hovering near its 52-week high in a tight trading range with volume totals cooling. It is slightly extended from its previous base, and prior highs in the $67-68 area define initial support to watch on pullbacks.
>>> The latest Featured Stock Update with an annotated graph appeared on 8/9/2012. Click here.
View all notes |
Alert me of new notes |
CANSLIM.net Company Profile |
SEC |
Zacks Reports |
StockTalk |
News |
Chart |
Request a new note
C
A N
S L
I M
|
RNF
-
NYSE
Rentech Nitrogen Ptnr Lp
CHEMICALS - Agricultural Chemicals
|
$33.22
|
+0.34
1.03% |
$34.10
|
264,129
59.31% of 50 DAV
50 DAV is 445,300
|
$34.75
-4.40%
|
7/27/2012
|
$29.58
|
PP = $30.60
|
|
MB = $32.13
|
Most Recent Note - 8/27/2012 3:24:35 PM
G - Holding its ground with volume totals cooling in recent weeks. It remains slightly extended from its prior base. Near-term support is at prior highs in the $30-31 area and its 50 DMA line.
>>> The latest Featured Stock Update with an annotated graph appeared on 7/31/2012. Click here.
View all notes |
Alert me of new notes |
CANSLIM.net Company Profile |
SEC |
Zacks Reports |
StockTalk |
News |
Chart |
Request a new note
C
A N
S L
I M
|
Symbol/Exchange
Company Name
Industry Group |
PRICE |
CHANGE
(%Change) |
Day High |
Volume
(% DAV)
(% 50 day avg vol) |
52 Wk Hi
% From Hi |
Featured
Date |
Price
Featured |
Pivot Featured |
|
Max Buy |
SWI
-
NYSE
Solarwinds Inc
COMPUTER SOFTWARE and SERVICES - Application Software
|
$54.92
|
+0.65
1.20% |
$55.17
|
1,088,582
89.06% of 50 DAV
50 DAV is 1,222,300
|
$56.94
-3.55%
|
7/25/2012
|
$47.82
|
PP = $47.89
|
|
MB = $50.28
|
Most Recent Note - 8/27/2012 3:25:21 PM
G - Volume totals have been cooling in recent weeks while still holding its ground stubbornly near its all-time high. Prior highs in the $48 area define initial support to watch on pullbacks.
>>> The latest Featured Stock Update with an annotated graph appeared on 7/30/2012. Click here.
View all notes |
Alert me of new notes |
CANSLIM.net Company Profile |
SEC |
Zacks Reports |
StockTalk |
News |
Chart |
Request a new note
C
A N
S L
I M
|
TDG
-
NYSE
Transdigm Group Inc
AEROSPACE/DEFENSE - Aerospace/Defense Products and; Services
|
$137.98
|
-1.44
-1.03% |
$139.31
|
445,449
109.07% of 50 DAV
50 DAV is 408,400
|
$143.15
-3.61%
|
8/16/2012
|
$132.23
|
PP = $136.44
|
|
MB = $143.26
|
Most Recent Note - 8/27/2012 12:45:26 PM
Y - Hit a new 52-week high today and challenged its "max buy" level, however it is now trading well off its earlier highs. Disciplined investors do not chase extended stocks and they always limit losses if ever any stock falls -7% from their purchase price.
>>> The latest Featured Stock Update with an annotated graph appeared on 8/17/2012. Click here.
View all notes |
Alert me of new notes |
CANSLIM.net Company Profile |
SEC |
Zacks Reports |
StockTalk |
News |
Chart |
Request a new note
C
A N
S L
I M
|
TNGO
-
NASDAQ
Tangoe Inc
COMPUTER SOFTWARE and SERVICES - Technical and System Software
|
$16.70
|
-3.39
-16.87% |
$20.04
|
5,999,353
1,462.90% of 50 DAV
50 DAV is 410,100
|
$23.05
-27.55%
|
8/9/2012
|
$21.30
|
PP = $23.10
|
|
MB = $24.26
|
Most Recent Note - 8/28/2012 4:09:31 PM
Fell sharply in the late afternoon and violated its 200 DMA line with a considerable loss on very heavy volume nearly 15 times average. It will be dropped from the Featured Stocks list tonight due to poor technical action. A rebound above its 50 DMA line is needed for its outlook to improve.
>>> The latest Featured Stock Update with an annotated graph appeared on 8/24/2012. Click here.
View all notes |
Alert me of new notes |
CANSLIM.net Company Profile |
SEC |
Zacks Reports |
StockTalk |
News |
Chart |
Request a new note
C
A N
S L
I M
|
ULTI
-
NASDAQ
Ultimate Software Group
INTERNET - Internet Software and Services
|
$97.61
|
-1.33
-1.34% |
$100.83
|
286,680
173.12% of 50 DAV
50 DAV is 165,600
|
$99.74
-2.14%
|
8/27/2012
|
$98.36
|
PP = $99.19
|
|
MB = $104.15
|
Most Recent Note - 8/28/2012 1:01:23 PM
Y - Touched another new 52-week high today then reversed into the red. On the prior session it gapped up and posted a volume-driven gain, however it did not finish above the pivot point cited based on its 8/01/12 high plus 10 cents. A volume-driven gain and strong close above its pivot point may trigger technical buy signal. See the latest FSU analysis for more details and an annotated graph.
>>> The latest Featured Stock Update with an annotated graph appeared on 8/27/2012. Click here.
View all notes |
Alert me of new notes |
CANSLIM.net Company Profile |
SEC |
Zacks Reports |
StockTalk |
News |
Chart |
Request a new note
C
A N
S L
I M
|
VSI
-
NYSE
Vitamin Shoppe Inc
SPECIALTY RETAIL - Specialty Retail, Other
|
$54.24
|
-0.07
-0.13% |
$54.75
|
155,593
38.76% of 50 DAV
50 DAV is 401,400
|
$61.83
-12.27%
|
6/29/2012
|
$54.93
|
PP = $55.03
|
|
MB = $57.78
|
Most Recent Note - 8/28/2012 4:24:40 PM
G - The longer it lingers below its 50 DMA line the worse its outlook gets following recent technical sell signals. Prior low ($52.41 on 7/23/12) defines a near-term support level where any further deterioration would raise more serious concerns.
>>> The latest Featured Stock Update with an annotated graph appeared on 8/2/2012. Click here.
View all notes |
Alert me of new notes |
CANSLIM.net Company Profile |
SEC |
Zacks Reports |
StockTalk |
News |
Chart |
Request a new note
C
A N
S L
I M
|
Symbol/Exchange
Company Name
Industry Group |
PRICE |
CHANGE
(%Change) |
Day High |
Volume
(% DAV)
(% 50 day avg vol) |
52 Wk Hi
% From Hi |
Featured
Date |
Price
Featured |
Pivot Featured |
|
Max Buy |
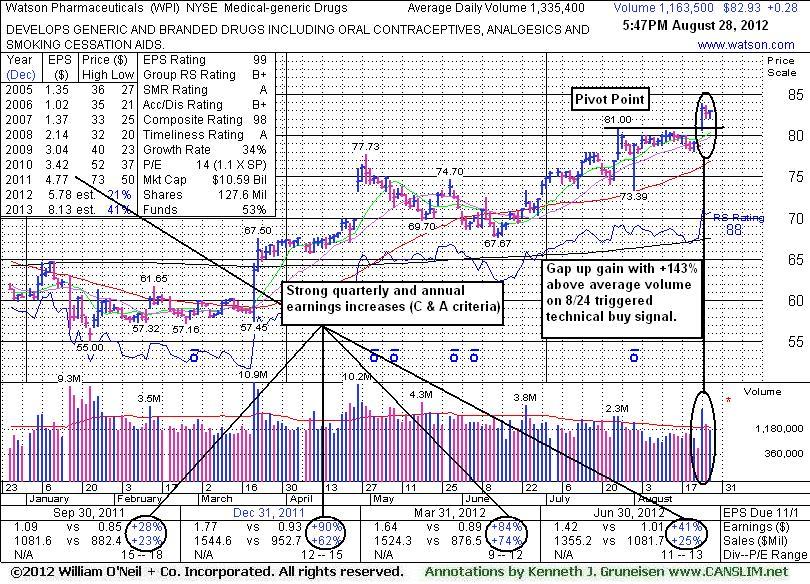
WPI
-
NYSE
Watson Pharmaceuticals
DRUGS - Drugs - Generic
|
$82.93
|
+0.28
0.34% |
$82.97
|
1,170,385
87.64% of 50 DAV
50 DAV is 1,335,400
|
$83.83
-1.07%
|
8/24/2012
|
$82.90
|
PP = $81.10
|
|
MB = $85.16
|
Most Recent Note - 8/28/2012 6:16:14 PM
Y - Holding its ground since triggering a technical buy signal on 8/24/12 when highlighted in the mid-day report with a gap up gain backed by above average volume. Prior highs in the $81 area define initial support to watch on pullbacks. See the latest FSU analysis for more details and a new annotated graph.
>>> The latest Featured Stock Update with an annotated graph appeared on 8/28/2012. Click here.
View all notes |
Alert me of new notes |
CANSLIM.net Company Profile |
SEC |
Zacks Reports |
StockTalk |
News |
Chart |
Request a new note
C
A N
S L
I M
|