You are not logged in.
This means you
CAN ONLY VIEW reports that were published prior to Friday, April 18, 2025.
You
MUST UPGRADE YOUR MEMBERSHIP if you want to see any current reports.
AFTER MARKET UPDATE - FRIDAY, JUNE 28TH, 2024
Previous After Market Report Next After Market Report >>>
|
|
|
|
DOW |
-45.20 |
39,118.86 |
-0.12% |
|
Volume |
3,374,699,700 |
+256% |
|
Volume |
9,221,359,400 |
+69% |
|
NASDAQ |
-126.08 |
17,732.60 |
-0.71% |
|
Advancers |
1,626 |
59% |
|
Advancers |
2,284 |
54% |
|
S&P 500 |
-22.16 |
5,460.71 |
-0.40% |
|
Decliners |
1,146 |
41% |
|
Decliners |
1,960 |
46% |
|
Russell 2000 |
+9.35 |
2,047.69 |
+0.46% |
|
52 Wk Highs |
126 |
|
|
52 Wk Highs |
105 |
|
|
S&P 600 |
+11.88 |
1,296.98 |
+0.92% |
|
52 Wk Lows |
42 |
|
|
52 Wk Lows |
155 |
|
|
 |
Major Indices Erased Early Gains to End Session Lower
Kenneth J. Gruneisen - Passed the CAN SLIM® Master's Exam
The major indices, up between 0.7% and 1.0% at Friday's highs, slumpeds to close the session in red. The exception was the Russell 2000 (+0.5%). The reconstitution of the Russell indices was responsible for much heavier than average trading volume versus the prior session on the NYSE and on the Nasdaq exchange. Breadth was positive as advancers led decliners by 4-3 margin on the NYSE but the lead was narrower on the Nasdaq exchange. There were 30 high-ranked companies from the Leaders List that hit new 52-week highs and were listed on the BreakOuts Page, versus the total of 31 on the prior session. New 52-week highs outnumbered new 52-week lows on the NYSE but new lows outnumbered new highs on the Nasdaq exchange for a 10th consecutive session. The major indices are in a confirmed uptrend (M criteria) that recently endured some pressure. Remember that any uptrend requires healthy leadership.
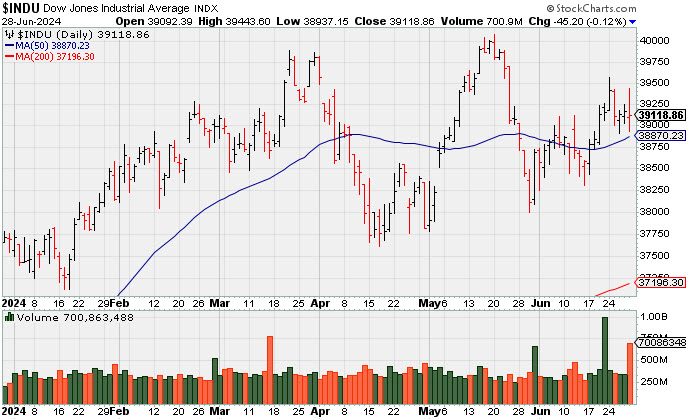 PICTURED: The Dow Jones Industrial Average is consolidating above its 50-day moving average (DMA) line.
The Personal Income and Spending Report for May featured increases in real disposable personal income and real personal spending along with a moderation in inflation pressures. The 2-yr note yield settled the session unchanged at 4.72%. The 10-yr note yield settled the session up six basis points to 4.34%.
Dow component Nike (NKE -19.98%) dove after it greatly disappointed investors with its FY25 sales outlook. Four S&P 500 sectors finished higher. The biggest gainer was the real estate sector (+0.6%) followed by the financial (+0.4%) and energy (+0.4%) sectors. On the losing side were the communication services (-1.6%), consumer discretionary (-1.4%), and utilities (-1.1%) sectors. The information technology sector, up 1.6% at one point, finished the day down -0.4%.
Uncertainty over the presidential election rose as Democrats considered replacing President Biden on the Democratic ticket after his debate performance.
|
 Kenneth J. Gruneisen started out as a licensed stockbroker in August 1987, a couple of months prior to the historic stock market crash that took the Dow Jones Industrial Average down -22.6% in a single day. He has published daily fact-based fundamental and technical analysis on high-ranked stocks online for two decades. Through FACTBASEDINVESTING.COM, Kenneth provides educational articles, news, market commentary, and other information regarding proven investment systems that work in good times and bad.
Comments contained in the body of this report are technical opinions only and are not necessarily those of Gruneisen Growth Corp. The material herein has been obtained from sources believed to be reliable and accurate, however, its accuracy and completeness cannot be guaranteed. Our firm, employees, and customers may effect transactions, including transactions contrary to any recommendation herein, or have positions in the securities mentioned herein or options with respect thereto. Any recommendation contained in this report may not be suitable for all investors and it is not to be deemed an offer or solicitation on our part with respect to the purchase or sale of any securities. |
|
 |
Finanacial, Networking, Semi, and Energy-Linked Groups Rose
Kenneth J. Gruneisen - Passed the CAN SLIM® Master's Exam
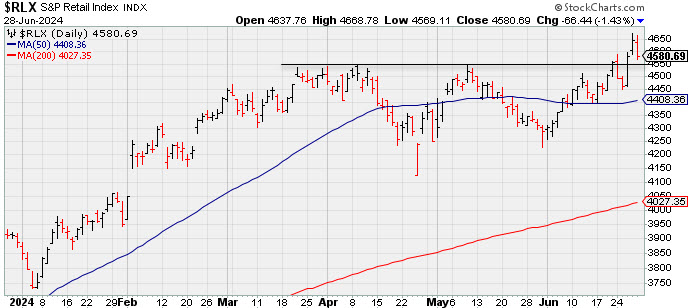
The Bank Index ($BKX +2.32%) and the Broker/Dealer Index ($XBD +0.83%) both rose while the Retail Index ($RLX -1.43%) lost ground on Friday. The Networking Index ($NWX +2.44%) and the Semiconductor Index ($SOX +0.94%) both posted gains while the Biotech Index ($BTK -0.63%) edged lower. The Integrated Oil Index ($XOI +0.55%) and the Oil Services Index ($OSX +0.77%) each posted a small gain while the Gold & Silver Index ($XAU -0.49%) lost ground.
PICTURED: The Retail Index ($RLX -1.43%) pulled back after hitting new all-time highs with recent gains.
| Oil Services |
$OSX |
85.39 |
+0.65 |
+0.77% |
+1.79% |
| Integrated Oil |
$XOI |
2,045.43 |
+11.18 |
+0.55% |
+9.82% |
| Semiconductor |
$SOX |
5,472.26 |
+51.17 |
+0.94% |
+31.06% |
| Networking |
$NWX |
826.94 |
+19.70 |
+2.44% |
-0.71% |
| Broker/Dealer |
$XBD |
631.49 |
+5.19 |
+0.83% |
+13.31% |
| Retail |
$RLX |
4,580.69 |
-66.44 |
-1.43% |
+17.79% |
| Gold & Silver |
$XAU |
137.37 |
-0.67 |
-0.49% |
+9.29% |
| Bank |
$BKX |
104.50 |
+2.37 |
+2.32% |
+8.83% |
| Biotech |
$BTK |
5,287.36 |
-33.76 |
-0.63% |
-2.43% |
|
|
|
 |
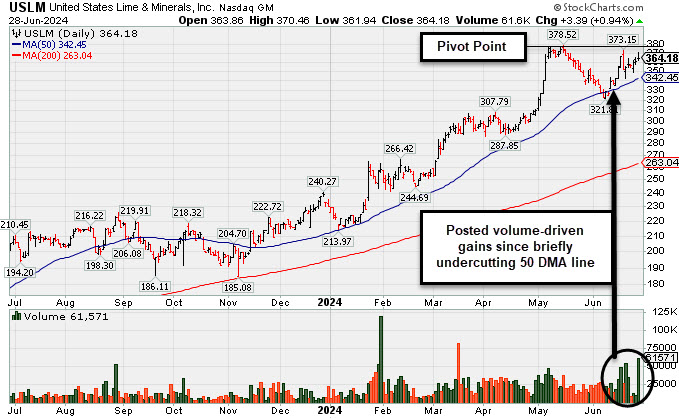
in Striking Distance of All-Time High After Volume-Driven Gains
Kenneth J. Gruneisen - Passed the CAN SLIM® Master's Exam
U.S. Lime & Minerals (USLM +$3.39 or +0.94% to $364.18) has posted several gains backed by above average volume while recently consolidating above its 50-day moving average (DMA) line ($342.57). It is perched within close striking distance of its all-time high. Its color code was changed to yellow with new pivot point cited based on its 5/15/24 high plus 10 cents. Subsequent gains above the pivot point backed by at least +40% above average volume may trigger a new (or add-on) technical buy signal. It found prompt support after a streak of losses briefly undercut its 50 DMA line.
Fundamentals remain strong. USLM reported Mar '24 quarterly earnings +31% on +7% sales revenues versus the year-ago period. USLM has a highest possible Earnings Per Share Rating of 99. Prior quarterly and annual earnings (C and A criteria) history has been strong, a good match with the fact-based investment system's guidelines. The thinly traded firm has only 5.7 million shares outstanding (S criteria), which can contribute to greater price volatility in the event of institutional buying or selling.
USLM was highlighted in yellow in the 2/09/24 mid-day report (read here). It was last shown in this FSU section on 6/06/24 with an annotated graph under the headline, "Streak of Losses Testing 50-Day Moving Average Line". The number of top-rated funds owning its shares rose from 192 in Mar '23 to 231 in Mar '24, a reassuring sign concerning the I criteria. Its current Up/Down Volume Ratio of 1.3 is an unbiased indication its shares have been under accumulation over the past 50 days. |
|
|
Color Codes Explained :
Y - Better candidates highlighted by our
staff of experts.
G - Previously featured
in past reports as yellow but may no longer be buyable under the
guidelines.
***Last / Change / Volume data in this table is the closing quote data***
Symbol/Exchange
Company Name
Industry Group |
PRICE |
CHANGE
(%Change) |
Day High |
Volume
(% DAV)
(% 50 day avg vol) |
52 Wk Hi
% From Hi |
Featured
Date |
Price
Featured |
Pivot Featured |
|
Max Buy |
 TDG
-
NYSE
TDG
-
NYSE
TransDigm Group
Aerospace/Defense
|
$1,277.61
|
-11.04
-0.86% |
$1,303.89
|
1,131,205
509.55% of 50 DAV
50 DAV is 222,000
|
$1,369.58
-6.72%
|
4/12/2024
|
$1,224.21
|
PP = $1,246.32
|
|
MB = $1,308.64
|
 Most Recent Note - 6/28/2024 6:57:28 PM
G - Slumped further below its 50 DMA line ($1,298) with heavy volume behind today's 4th consecutive loss raising greater concerns and triggering a technical sell signal. Only a prompt rebound above the 50 DMA line would help its outlook improve. Fundamentals remain strong.
>>> FEATURED STOCK ARTICLE : Transdigm Consolidating Above 50-Day Moving Average - 6/12/2024 |
View all notes |
Set NEW NOTE alert |
Company Profile |
SEC
News |
Chart |
Request a new note
C
A
S
I |
USLM
-
NASDAQ
U.S. Lime & Minerals
Bldg-Cement/Concrt/Ag
|
$364.18
|
+3.39
0.94% |
$370.46
|
38,227
159.28% of 50 DAV
50 DAV is 24,000
|
$378.78
-3.85%
|
6/18/2024
|
$356.30
|
PP = $378.88
|
|
MB = $397.82
|
Most Recent Note - 6/28/2024 6:40:52 PM
Y - Perched within striking distance of all-time high after volume-driven gains. Color code was changed to yellow with new pivot point cited based on its 5/15/24 high plus 10 cents. Subsequent gains above the pivot point backed by at least +40% above average volume may trigger a new (or add-on) technical buy signal. Found prompt support after briefly undercutting its 50 DMA line ($342.57) in recent weeks. Fundamentals remain strong. See the latest FSU analysis for more details and a new annotated graph
>>> FEATURED STOCK ARTICLE : in Striking Distance of All-Time High After Volume-Driven Gains - 6/28/2024 |
View all notes |
Set NEW NOTE alert |
Company Profile |
SEC
News |
Chart |
Request a new note
C
A
S
I |
CLS
-
NYSE
Celestica
Elec-Contract Mfg
|
$57.33
|
+0.13
0.23% |
$58.37
|
1,181,206
48.00% of 50 DAV
50 DAV is 2,461,000
|
$61.06
-6.11%
|
5/15/2024
|
$51.52
|
PP = $51.22
|
|
MB = $53.78
|
Most Recent Note - 6/27/2024 6:00:11 PM
G - Consolidating in an orderly fashion but it has not formed a sound base of sufficient length. Important support is at prior highs in the $51 area and its 50 DMA line. See the latest FSU analysis for more details and a new annotated graph.
>>> FEATURED STOCK ARTICLE : Consolidating Above Prior Highs in an Orderly Fashion - 6/27/2024 |
View all notes |
Set NEW NOTE alert |
Company Profile |
SEC
News |
Chart |
Request a new note
C
A
S
I |
DECK
-
NYSE
Deckers Outdoor
Apparel-Shoes and Rel Mfg
|
$967.95
|
-31.96
-3.20% |
$1,004.31
|
557,342
162.97% of 50 DAV
50 DAV is 342,000
|
$1,106.89
-12.55%
|
5/24/2024
|
$1,010.60
|
PP = $956.27
|
|
MB = $1,004.08
|
Most Recent Note - 6/28/2024 6:45:30 PM
G - Pulled back today for a big loss with higher volume and it recently endured distributional pressure. Prior highs in the $956 area define initial support to watch above its 50 DMA line ($940).
>>> FEATURED STOCK ARTICLE : Deckers Consolidating Near High - 6/13/2024 |
View all notes |
Set NEW NOTE alert |
Company Profile |
SEC
News |
Chart |
Request a new note
C
A
S
I |
ELF
-
NYSE
e.l.f. Beauty
Cosmetics/Personal Care
|
$210.72
|
-7.28
-3.34% |
$215.99
|
6,555,723
418.09% of 50 DAV
50 DAV is 1,568,000
|
$221.83
-5.01%
|
6/18/2024
|
$212.40
|
PP = $221.93
|
|
MB = $233.03
|
Most Recent Note - 6/28/2024 6:46:38 PM
Y - Pulled back today with higher volume after wedging to a best-ever close on the prior session. Color code was changed to yellow with new pivot point cited based on its 3/04/24 high plus 10 cents. Subsequent gains above the pivot point backed by at least +40% above average volume may trigger a new (or add-on) technical buy signal. Its 50 DMA line ($180) defines important near-term support to watch.
>>> FEATURED STOCK ARTICLE : Perched Within Striking Distance of All-Time High - 6/20/2024 |
View all notes |
Set NEW NOTE alert |
Company Profile |
SEC
News |
Chart |
Request a new note
C
A
S
I |
Symbol/Exchange
Company Name
Industry Group |
PRICE |
CHANGE
(%Change) |
Day High |
Volume
(% DAV)
(% 50 day avg vol) |
52 Wk Hi
% From Hi |
Featured
Date |
Price
Featured |
Pivot Featured |
|
Max Buy |
PDD
-
NASDAQ
PDD Holdings ADR
Retail-Internet
|
$132.95
|
+1.01
0.77% |
$135.64
|
8,815,996
90.12% of 50 DAV
50 DAV is 9,783,000
|
$164.69
-19.27%
|
5/24/2024
|
$161.85
|
PP = $153.09
|
|
MB = $160.74
|
Most Recent Note - 6/27/2024 6:03:40 PM
G - Color code is changed to green after slumping well below its 50 DMA line ($139.66) with today's 9th consecutive loss. A rebound above the 50 DMA line is needed for its outlook to improve.
>>> FEATURED STOCK ARTICLE : Still Sputtering Below Pivot Point After Negating Breakout - 6/17/2024 |
View all notes |
Set NEW NOTE alert |
Company Profile |
SEC
News |
Chart |
Request a new note
C
A
S
I |
CRWD
-
NASDAQ
CrowdStrike Holdings
Computer Sftwr-Security
|
$383.19
|
-4.10
-1.06% |
$393.29
|
7,154,270
146.63% of 50 DAV
50 DAV is 4,879,000
|
$394.64
-2.90%
|
5/28/2024
|
$351.47
|
PP = $365.10
|
|
MB = $383.36
|
Most Recent Note - 6/28/2024 6:43:20 PM
Y - Pulled back today for a small loss with higher volume, hovering near its "max buy" level. Its 50 DMA line ($338) defines near-term support to watch. Fundamentals remain strong.
>>> FEATURED STOCK ARTICLE : Encountered Distributional Pressure Hovering Near All-Time High - 6/21/2024 |
View all notes |
Set NEW NOTE alert |
Company Profile |
SEC
News |
Chart |
Request a new note
C
A
S
I |
NVO
-
NYSE
Novo Nordisk ADR
Medical-Ethical Drugs
|
$142.74
|
-1.75
-1.21% |
$145.59
|
2,588,487
68.61% of 50 DAV
50 DAV is 3,773,000
|
$148.15
-3.65%
|
6/7/2024
|
$143.06
|
PP = $138.38
|
|
MB = $145.30
|
Most Recent Note - 6/26/2024 12:14:01 PM
G - Gapped down today, pulling back from its all-time high after a gap up on the prior session capped a streak of 5 consecutive gains. Color code is changed to yellow after retreating below its "max buy" level. Fundamentals remain strong.
>>> FEATURED STOCK ARTICLE : Wedging Into New High Ground - 6/7/2024 |
View all notes |
Set NEW NOTE alert |
Company Profile |
SEC
News |
Chart |
Request a new note
C
A
S
I |
GVA
-
NYSE
Granite Construction
Bldg-Heavy Construction
|
$61.97
|
+0.52
0.85% |
$63.05
|
846,679
182.47% of 50 DAV
50 DAV is 464,000
|
$65.08
-4.78%
|
6/11/2024
|
$59.76
|
PP = $64.33
|
|
MB = $67.55
|
Most Recent Note - 6/26/2024 5:31:15 PM
Y - Volume totals have been cooling while hovering near its 52-week high. Color code was changed to yellow when highlighted on the 6/11/24 mid-day report as it was noted that a valid secondary buy point exists up to +5% above the recent high after finding support at its 10 WMA line following a prior breakout. Reported improved earnings in the Jun, Sep, Dec '23, and Mar '24 quarters versus the year ago periods. Annual earnings growth has been strong and steady.
>>> FEATURED STOCK ARTICLE : Granite Construction Found Support at 10-Week Moving Average - 6/11/2024 |
View all notes |
Set NEW NOTE alert |
Company Profile |
SEC
News |
Chart |
Request a new note
C
A
S
I |
|
|
|
THESE ARE NOT BUY RECOMMENDATIONS!
Comments contained in the body of this report are technical
opinions only. The material herein has been obtained
from sources believed to be reliable and accurate, however,
its accuracy and completeness cannot be guaranteed.
This site is not an investment advisor, hence it does
not endorse or recommend any securities or other investments.
Any recommendation contained in this report may not
be suitable for all investors and it is not to be deemed
an offer or solicitation on our part with respect to
the purchase or sale of any securities. All trademarks,
service marks and trade names appearing in this report
are the property of their respective owners, and are
likewise used for identification purposes only.
This report is a service available
only to active Paid Premium Members.
You may opt-out of receiving report notifications
at any time. Questions or comments may be submitted
by writing to Premium Membership Services 665 S.E. 10 Street, Suite 201 Deerfield Beach, FL 33441-5634 or by calling 1-800-965-8307
or 954-785-1121.
|
|
|