You are not logged in.
This means you
CAN ONLY VIEW reports that were published prior to Sunday, April 27, 2025.
You
MUST UPGRADE YOUR MEMBERSHIP if you want to see any current reports.
AFTER MARKET UPDATE - TUESDAY, JUNE 24TH, 2014
Previous After Market Report Next After Market Report >>>
|
|
|
|
DOW |
-119.13 |
16,818.13 |
-0.70% |
|
Volume |
635,208,450 |
+14% |
|
Volume |
1,835,272,150 |
+16% |
|
NASDAQ |
-18.32 |
4,350.36 |
-0.42% |
|
Advancers |
1,145 |
36% |
|
Advancers |
860 |
29% |
|
S&P 500 |
-12.63 |
1,949.98 |
-0.64% |
|
Decliners |
1,923 |
60% |
|
Decliners |
2,005 |
67% |
|
Russell 2000 |
-11.71 |
1,173.24 |
-0.99% |
|
52 Wk Highs |
194 |
|
|
52 Wk Highs |
77 |
|
|
S&P 600 |
-5.58 |
672.44 |
-0.82% |
|
52 Wk Lows |
23 |
|
|
52 Wk Lows |
28 |
|
|
 |
After Positive Start Major Averages Endured Distributional Pressure
Kenneth J. Gruneisen - Passed the CAN SLIM® Master's Exam
The major averages erased early gains and finished lower on Tuesday. The session's volume was reported higher than the prior session totals on the NYSE and on the Nasdaq exchange, a clear sign of distributional pressure. Decliners led advancer by almost a 2-1 margin on the NYSE and by more than a 2-1 margin on the Nasdaq exchange. Leadership contracted as here were 50 high-ranked companies from the CANSLIM.net Leaders List that made new 52-week highs and appeared on the CANSLIM.net BreakOuts Page, down from the total of 58 stocks on the prior session. New 52-week highs contracted yet still easily outnumbered new 52-week lows on the NYSE and Nasdaq exchange. There were gains for only 3 of the 13 high-ranked companies currently included on the Featured Stocks Page. The S&P 500 Index and Dow Jones Industrial Average recently surged into new high territory with healthy leadership (new 52-week highs) sending a reassuring signal that the market direction (M criteria) is in a "confirmed uptrend". Any new buying efforts should be selective and focused in stocks meeting all key criteria of the fact-based investment system.
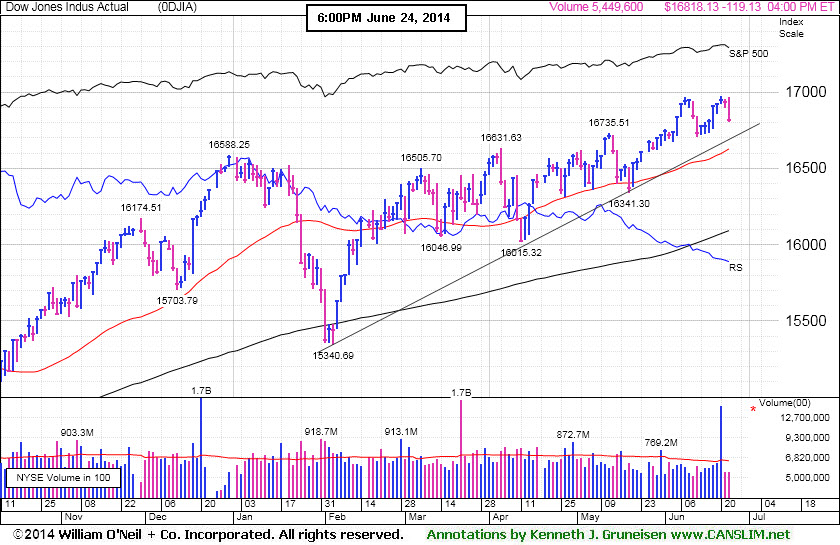
PICTURED: The Dow fell 119 points to 16,818. The S&P 500 Index touched a fresh intra-day high but closed lower as it declined 12 points to 1,949. The Nasdaq Composite Index retreated 18 points to 4,350.
Escalating violence in the Middle East prompted a round of profit taking following news that Syrian warplanes struck targets in Iraq. The situation overseas overshadowed some better-than-expected economic data. A gauge of consumer confidence unexpectedly rose in June to the highest level in more than six years. In addition, new home sales surprisingly jumped in May by the most since January 1992. Other data showed home prices increased at a slower than anticipated pace last month while manufacturing activity in the region covered by the Richmond Fed slowed in June.
Overall, eight of the 10 S&P 500 sectors declined. Energy and industrials were the worst performing groups as Exxon Mobil (XOM -1.5%) and Precision Castparts (PCP -2.9%) dropped. On the upside, utilities and health care finished higher. NextEra Energy (NEE +1.1%) rose. Vertex Pharmaceuticals (VRTX +40.5%) tallied a considerable gain following positive drug trial results.
NYSE Composite volume totaled more n 3 billion shares. On the NYSE, decliners beat advancers by 5-3 on issues and 4-1 on volume. The NASDAQ was 7-3 negative on issues and 5-2 negative on volume.
Treasuries rose and the government sold $30 billion in two-year notes at the highest yield since May 2011. The 10-year note gained 13/32 to yield 2.58%.
The CANSLIM.net Featured Stocks Page shows the most action-worthy candidates and their latest notes and a Headline Link directs members to the latest detailed analysis with data-packed graphs annotated by a Certified expert along with links to additional resources. The Premium Member Homepage includes "dynamic archives" to all prior pay reports published. Watch for an announcement via email concerning the next WEBCAST.
|
 Kenneth J. Gruneisen started out as a licensed stockbroker in August 1987, a couple of months prior to the historic stock market crash that took the Dow Jones Industrial Average down -22.6% in a single day. He has published daily fact-based fundamental and technical analysis on high-ranked stocks online for two decades. Through FACTBASEDINVESTING.COM, Kenneth provides educational articles, news, market commentary, and other information regarding proven investment systems that work in good times and bad.
Comments contained in the body of this report are technical opinions only and are not necessarily those of Gruneisen Growth Corp. The material herein has been obtained from sources believed to be reliable and accurate, however, its accuracy and completeness cannot be guaranteed. Our firm, employees, and customers may effect transactions, including transactions contrary to any recommendation herein, or have positions in the securities mentioned herein or options with respect thereto. Any recommendation contained in this report may not be suitable for all investors and it is not to be deemed an offer or solicitation on our part with respect to the purchase or sale of any securities. |
|
 |
Commodity-Linked Groups Led Broad-Based Retreat
Kenneth J. Gruneisen - Passed the CAN SLIM® Master's Exam
Commodity-linked groups led Tuesday's broad-based retreat as the Gold & Silver Index ($XAU -2.87%) outpaced the Oil Services Index ($OSX -2.13%) and the Integrated Oil Index ($XOI -1.90%) to the downside. Financials were a negative influence on the major averages as the Broker/Dealer Index ($XBD -1.48%) and the Bank Index ($BKX -0.85%) both fell, meanwhile, the Retail Index ($RLX -0.43%) suffered a smaller loss. The Semiconductor Index ($SOX -0.73%) and the Networking Index ($NWX -1.16%) lost ground while the Biotechnology Index ($BTK +0.95%) was a standout gainer.
Charts courtesy www.stockcharts.com
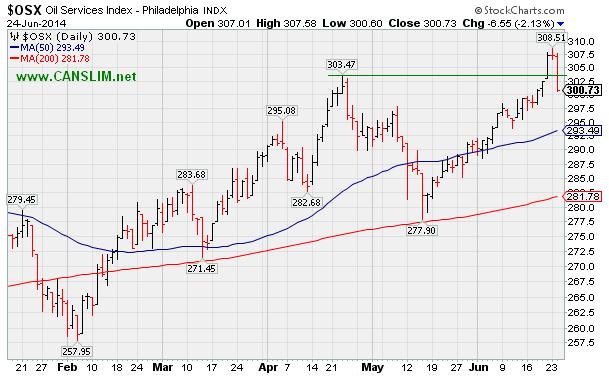
PICTURED: The Oil Services Index ($OSX -2.13%) abruptly retreated and sank below its April highs with a large loss. It had only recently rallied to new 2014 highs.
| Oil Services |
$OSX |
300.73 |
-6.55 |
-2.13% |
+7.01% |
| Integrated Oil |
$XOI |
1,693.42 |
-32.80 |
-1.90% |
+12.66% |
| Semiconductor |
$SOX |
628.50 |
-4.63 |
-0.73% |
+17.47% |
| Networking |
$NWX |
330.69 |
-3.88 |
-1.16% |
+2.08% |
| Broker/Dealer |
$XBD |
158.11 |
-2.38 |
-1.48% |
-1.53% |
| Retail |
$RLX |
886.89 |
-3.83 |
-0.43% |
-5.63% |
| Gold & Silver |
$XAU |
97.31 |
-2.88 |
-2.87% |
+15.64% |
| Bank |
$BKX |
71.15 |
-0.61 |
-0.85% |
+2.73% |
| Biotech |
$BTK |
2,752.67 |
+25.85 |
+0.95% |
+18.12% |
|
|
|
 |
Volume Above Average as Generic Drug Firm Approaches Highs
Kenneth J. Gruneisen - Passed the CAN SLIM® Master's Exam
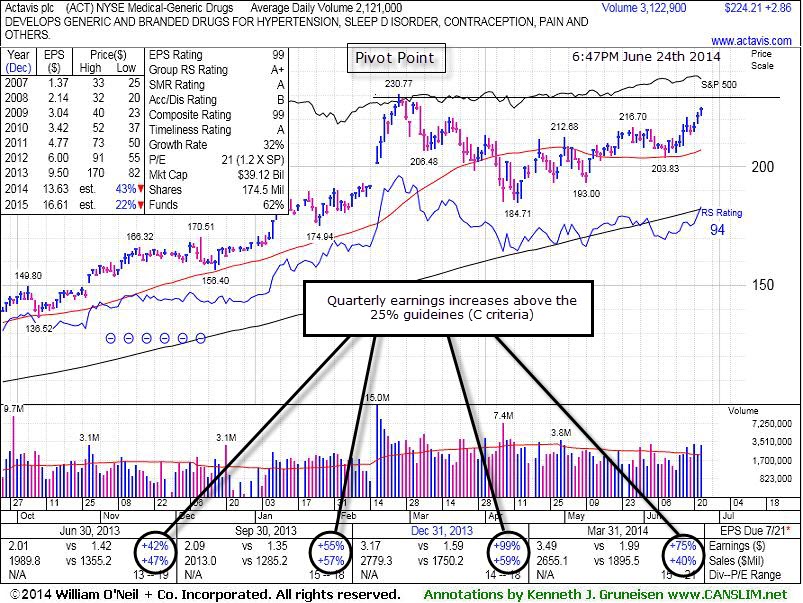
Atavis plc (ACT +$2.86 or +1.29% to $224.21) traded +47% above average volume as it rallied for a 3rd consecutive gain today, approaching its pivot point. It was highlighted in yellow in the 6/20/14 mid-day report (read here) with a pivot point based on its 2/26/14 high plus 10 cents Subsequent volume-driven gains should be backed by at least +40% above average volume as it hits new highs to trigger a proper technical buy signal.
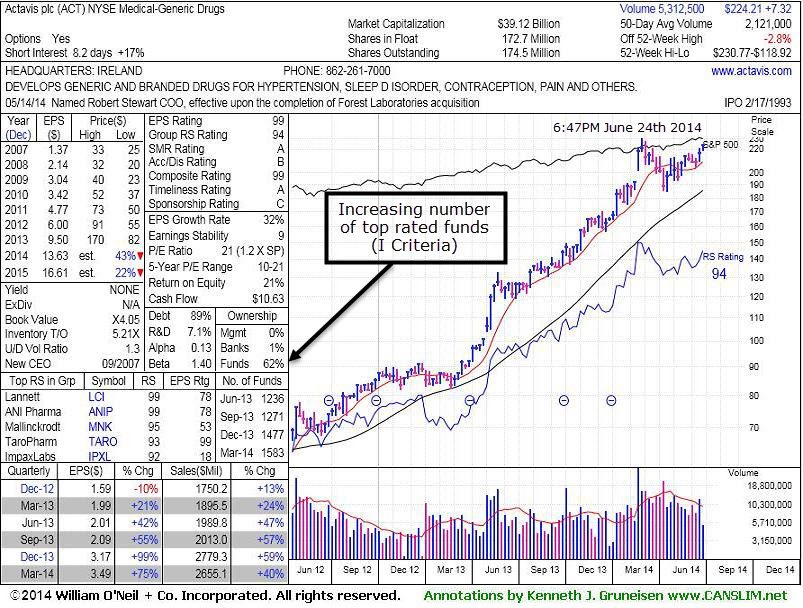
The Medical - Generic Drugs industry group currently has a 94 Group Relative Strength Rating and leadership from other issues is a reassuring sign concerning the L criteria. It reported earnings +75% on +40% sales revenues for the Mar '14 quarter, and its strong record satisfies the C criteria. Its annual earnings (A criteria) history has also been strong. The number of top-rated funds owning its shares rose from 1,236 in Jun '13 to 1,583 in Mar '14, a very reassuring sign concerning the I criteria. Its current Up/Down Volume Ratio of 1.3 is an unbiased indication its shares have been under accumulation over the past 50 days.
|
|
|
Color Codes Explained :
Y - Better candidates highlighted by our
staff of experts.
G - Previously featured
in past reports as yellow but may no longer be buyable under the
guidelines.
***Last / Change / Volume data in this table is the closing quote data***
Symbol/Exchange
Company Name
Industry Group |
PRICE |
CHANGE
(%Change) |
Day High |
Volume
(% DAV)
(% 50 day avg vol) |
52 Wk Hi
% From Hi |
Featured
Date |
Price
Featured |
Pivot Featured |
|
Max Buy |
ACT
-
NYSE
Actavis plc
Medical-Generic Drugs
|
$224.21
|
+2.86
1.29% |
$224.95
|
3,123,379
147.26% of 50 DAV
50 DAV is 2,121,000
|
$230.77
-2.84%
|
6/20/2014
|
$216.53
|
PP = $230.87
|
|
MB = $242.41
|
 Most Recent Note - 6/24/2014 7:20:46 PM
Y - Tallied a 3rd consecutive gain today, approaching its pivot point based on its 2/26/14 high plus 10 cents. Subsequent volume-driven gains to new highs may trigger a technical buy signal. See the latest FSU analysis for more details and new annotated graphs.
>>> FEATURED STOCK ARTICLE : Volume Above Average as Generic Drug Firm Approaches Highs - 6/24/2014
View all notes |
Set NEW NOTE alert |
CANSLIM.net Company Profile |
SEC
News |
Chart |
Request a new note
C
A N
S L
I M


|
AFSI
-
NASDAQ
Amtrust Financial Svcs
INSURANCE - Property and; Casualty Insurance
|
$42.74
|
+0.05
0.12% |
$43.59
|
471,980
70.76% of 50 DAV
50 DAV is 667,000
|
$47.10
-9.26%
|
5/21/2014
|
$44.85
|
PP = $44.85
|
|
MB = $47.09
|
Most Recent Note - 6/20/2014 5:49:04 PM
G - Still consolidating in a tight trading range above its 50 DMA line which acted as support. Disciplined investors always limit losses by selling any stock that falls more than -7% from their purchase price.
>>> FEATURED STOCK ARTICLE : Halted Slide at 50-Day Moving Average After Distributional Pressure - 6/6/2014
View all notes |
Set NEW NOTE alert |
CANSLIM.net Company Profile |
SEC
News |
Chart |
Request a new note
C
A N
S L
I M
|
AL
-
NYSE
Air Lease Corp Cl A
DIVERSIFIED SERVICES - Rental and Leasing Services
|
$38.22
|
-1.05
-2.67% |
$39.20
|
1,029,271
98.87% of 50 DAV
50 DAV is 1,041,000
|
$42.89
-10.89%
|
5/9/2014
|
$38.27
|
PP = $38.25
|
|
MB = $40.16
|
Most Recent Note - 6/19/2014 10:10:12 AM
G - Found prompt support near its 50 DMA line and prior highs. Any violation of its recent low ($36.55 on 6/13/017) would raise serious concerns and trigger a worrisome technical sell signal.
>>> FEATURED STOCK ARTICLE : Enduring Mild Distributional Pressure on Pullback - 6/11/2014
View all notes |
Set NEW NOTE alert |
CANSLIM.net Company Profile |
SEC
News |
Chart |
Request a new note
C
A N
S L
I M
|
BWLD
-
NASDAQ
Buffalo Wild Wings Inc
LEISURE - Restaurants
|
$162.20
|
-4.05
-2.44% |
$166.00
|
598,370
136.30% of 50 DAV
50 DAV is 439,000
|
$166.35
-2.49%
|
6/19/2014
|
$158.52
|
PP = $159.91
|
|
MB = $167.91
|
Most Recent Note - 6/23/2014 12:15:56 PM
Y - Hitting a new 52-week high with today's volume-driven gain above its pivot point. No resistance remains due to overhead supply, and a strong finish may clinch a convincing technical buy signal. Disciplined investors avoid chasing stocks more than +5% above prior highs and always limit losses by selling any stock that falls more than -7% from their purchase price.
>>> FEATURED STOCK ARTICLE : Perched Near Highs With Strong Fundamentals - 6/19/2014
View all notes |
Set NEW NOTE alert |
CANSLIM.net Company Profile |
SEC
News |
Chart |
Request a new note
C
A N
S L
I M
|
EQM
-
NYSE
E Q T Midstream Partners
ENERGY - Oil and Gas Pipelines
|
$97.35
|
-1.77
-1.79% |
$100.14
|
258,752
61.90% of 50 DAV
50 DAV is 418,000
|
$102.51
-5.03%
|
12/12/2013
|
$53.17
|
PP = $56.51
|
|
MB = $59.34
|
Most Recent Note - 6/20/2014 5:53:01 PM
G - Powered to yet another new 52-week high with today's big volume-driven gain. Prior reports repeatedly cautioned members - "It is very extended from any sound base. Fundamental concerns remain after 2 consecutive sub par quarters below the +25% minimum earnings guideline."
>>> FEATURED STOCK ARTICLE : New Highs Again With Light Volume Behind Streak of Gains - 6/4/2014
View all notes |
Set NEW NOTE alert |
CANSLIM.net Company Profile |
SEC
News |
Chart |
Request a new note
C
A N
S L
I M
|
Symbol/Exchange
Company Name
Industry Group |
PRICE |
CHANGE
(%Change) |
Day High |
Volume
(% DAV)
(% 50 day avg vol) |
52 Wk Hi
% From Hi |
Featured
Date |
Price
Featured |
Pivot Featured |
|
Max Buy |
GRFS
-
NASDAQ
Grifols Sa Ads
Medical-Ethical Drugs
|
$44.67
|
+0.83
1.89% |
$45.03
|
883,573
123.23% of 50 DAV
50 DAV is 717,000
|
$46.66
-4.26%
|
5/15/2014
|
$41.14
|
PP = $43.55
|
|
MB = $45.73
|
Most Recent Note - 6/23/2014 12:25:10 PM
Y - Color code is changed to yellow again as it found prompt support and rebounded quickly after undercutting prior highs near $43 and briefly violating its 50 DMA line with above average volume behind today's considerable early loss. Disciplined investors always limit losses by selling any stock that falls more than -7% from their purchase price. Keep in mind that any stock which is sold can be bought again later if strength returns.
>>> FEATURED STOCK ARTICLE : Consolidating Just Below "Max Buy" Level - 6/17/2014
View all notes |
Set NEW NOTE alert |
CANSLIM.net Company Profile |
SEC
News |
Chart |
Request a new note
C
A N
S L
I M
|
HF
-
NYSE
H F F Inc Cl A
RETAIL - Grocery Stores
|
$35.69
|
-0.04
-0.11% |
$36.26
|
287,241
163.21% of 50 DAV
50 DAV is 176,000
|
$36.06
-1.03%
|
6/20/2014
|
$34.60
|
PP = $36.16
|
|
MB = $37.97
|
Most Recent Note - 6/23/2014 5:55:50 PM
Y - Rallying near its 52-week high with volume-driven gains. A gain above its pivot point with at least +40% above average volume is needed to trigger a proper technical buy signal. See the latest FSU analysis for more details and new annotated graphs.
>>> FEATURED STOCK ARTICLE : Approached 52-Week High With Volume-Driven Gain - 6/23/2014
View all notes |
Set NEW NOTE alert |
CANSLIM.net Company Profile |
SEC
News |
Chart |
Request a new note
C
A N
S L
I M
|
ICON
-
NASDAQ
Iconix Brand Group Inc
CONSUMER NON-DURABLES - Textile - Apparel Footwear
|
$42.21
|
-0.78
-1.81% |
$43.22
|
773,713
146.81% of 50 DAV
50 DAV is 527,000
|
$44.81
-5.80%
|
6/5/2014
|
$43.54
|
PP = $43.44
|
|
MB = $45.61
|
Most Recent Note - 6/23/2014 5:52:52 PM
Y - Finished near the session low today with a loss on above average volume. Slumping near prior highs in the $43-42 area defining initial support to watch.
>>> FEATURED STOCK ARTICLE : Found Support Above Prior Highs During Consolidation - 6/18/2014
View all notes |
Set NEW NOTE alert |
CANSLIM.net Company Profile |
SEC
News |
Chart |
Request a new note
C
A N
S L
I M
|
KS
-
NYSE
Kapstone Paper&Packaging
MANUFACTURING - Paper and Packaging
|
$32.46
|
-0.51
-1.55% |
$33.77
|
1,140,562
119.31% of 50 DAV
50 DAV is 956,000
|
$34.43
-5.72%
|
6/20/2014
|
$32.30
|
PP = $31.92
|
|
MB = $33.52
|
Most Recent Note - 6/23/2014 12:28:54 PM
Y - Reversed into the red after briefly rallying beyond its "max buy" level in today's early session. Prior highs near $32 define initial support to watch on pullbacks. It was highlighted in yellow while rallying from a cup-with-handle base in the 6/20/14 mid-day report (read here).
>>> FEATURED STOCK ARTICLE : Four Times Average Volume Behind Big Breakout Gain - 6/20/2014
View all notes |
Set NEW NOTE alert |
CANSLIM.net Company Profile |
SEC
News |
Chart |
Request a new note
C
A N
S L
I M
|
PANW
-
NYSE
Palo Alto Networks
Computer Sftwr-Security
|
$78.77
|
-1.40
-1.75% |
$80.39
|
1,976,201
110.09% of 50 DAV
50 DAV is 1,795,000
|
$82.27
-4.25%
|
5/29/2014
|
$75.95
|
PP = $72.50
|
|
MB = $76.13
|
Most Recent Note - 6/23/2014 5:48:06 PM
G - Volume totals have been cooling while holding its ground stubbornly near its 52-week high. Prior highs near $72 define important support above its 50 DMA line.
>>> FEATURED STOCK ARTICLE : Encountered Distributional Pressure After Touching New 52-Week High - 6/12/2014
View all notes |
Set NEW NOTE alert |
CANSLIM.net Company Profile |
SEC
News |
Chart |
Request a new note
C
A N
S L
I M
|
Symbol/Exchange
Company Name
Industry Group |
PRICE |
CHANGE
(%Change) |
Day High |
Volume
(% DAV)
(% 50 day avg vol) |
52 Wk Hi
% From Hi |
Featured
Date |
Price
Featured |
Pivot Featured |
|
Max Buy |
SN
-
NYSE
Sanchez Energy Corp
ENERGY - Independent Oil and Gas
|
$36.11
|
-2.02
-5.30% |
$37.92
|
2,020,804
134.36% of 50 DAV
50 DAV is 1,504,000
|
$38.95
-7.29%
|
5/22/2014
|
$33.00
|
PP = $31.59
|
|
MB = $33.17
|
Most Recent Note - 6/24/2014 7:17:52 PM
G - Retreated from its 52-week high with above average volume behind its loss today after getting very extended from its prior base. Disciplined investors avoid chasing extended stocks. Prior highs near $31-32 define support to watch on pullbacks.
>>> FEATURED STOCK ARTICLE : Finished Near Session Low After Hitting new 52-Week High - 6/9/2014
View all notes |
Set NEW NOTE alert |
CANSLIM.net Company Profile |
SEC
News |
Chart |
Request a new note
C
A N
S L
I M
|
TRN
-
NYSE
Trinity Industries Inc
TRANSPORTATION - Railroads
|
$41.69
|
-0.80
-1.88% |
$42.85
|
2,342,001
72.19% of 50 DAV
50 DAV is 3,244,000
|
$43.94
-5.13%
|
4/30/2014
|
$75.57
|
PP = $76.05
|
|
MB = $79.85
|
Most Recent Note - 6/19/2014 1:18:10 PM
G - Perched within close striking distance of its 52-week high, extended from its prior base. Recent lows in the $79 area and its 50 DMA line coincide defining important near-term support to watch.
>>> FEATURED STOCK ARTICLE : Recent Lows and 50-Day Moving Average Line Define Near-Term Support - 6/16/2014
View all notes |
Set NEW NOTE alert |
CANSLIM.net Company Profile |
SEC
News |
Chart |
Request a new note
C
A N
S L
I M
|
WLK
-
NYSE
Westlake Chemical Corp
CHEMICALS - Specialty Chemicals
|
$83.53
|
-1.06
-1.25% |
$85.01
|
367,671
50.64% of 50 DAV
50 DAV is 726,000
|
$84.91
-1.63%
|
4/29/2014
|
$72.79
|
PP = $69.31
|
|
MB = $72.78
|
Most Recent Note - 6/20/2014 5:51:52 PM
G - Inched to another new 52-week high with today's 4th consecutive gain. Prior highs near $77 define important near-term support to watch on pullbacks.
>>> FEATURED STOCK ARTICLE : Chemical Firm Quietly Posted 7th Consecutive Weekly Gain - 6/13/2014
View all notes |
Set NEW NOTE alert |
CANSLIM.net Company Profile |
SEC
News |
Chart |
Request a new note
C
A N
S L
I M
|
|
|
|
THESE ARE NOT BUY RECOMMENDATIONS!
Comments contained in the body of this report are technical
opinions only. The material herein has been obtained
from sources believed to be reliable and accurate, however,
its accuracy and completeness cannot be guaranteed.
This site is not an investment advisor, hence it does
not endorse or recommend any securities or other investments.
Any recommendation contained in this report may not
be suitable for all investors and it is not to be deemed
an offer or solicitation on our part with respect to
the purchase or sale of any securities. All trademarks,
service marks and trade names appearing in this report
are the property of their respective owners, and are
likewise used for identification purposes only.
This report is a service available
only to active Paid Premium Members.
You may opt-out of receiving report notifications
at any time. Questions or comments may be submitted
by writing to Premium Membership Services 665 S.E. 10 Street, Suite 201 Deerfield Beach, FL 33441-5634 or by calling 1-800-965-8307
or 954-785-1121.
|
|
|

