You are not logged in.
This means you
CAN ONLY VIEW reports that were published prior to Sunday, March 9, 2025.
You
MUST UPGRADE YOUR MEMBERSHIP if you want to see any current reports.
AFTER MARKET UPDATE - TUESDAY, JUNE 18TH, 2024
Previous After Market Report Next After Market Report >>>
|
|
|
|
DOW |
+56.76 |
38,834.86 |
+0.15% |
|
Volume |
939,555,538 |
+13% |
|
Volume |
5,964,167,900 |
+2% |
|
NASDAQ |
+5.21 |
17,862.23 |
+0.03% |
|
Advancers |
1,565 |
57% |
|
Advancers |
1,842 |
43% |
|
S&P 500 |
+13.80 |
5,487.03 |
+0.25% |
|
Decliners |
1,171 |
43% |
|
Decliners |
2,397 |
57% |
|
Russell 2000 |
+3.22 |
2,025.23 |
+0.16% |
|
52 Wk Highs |
89 |
|
|
52 Wk Highs |
134 |
|
|
S&P 600 |
+0.63 |
1,284.81 |
+0.05% |
|
52 Wk Lows |
64 |
|
|
52 Wk Lows |
219 |
|
|
 |
S&P 500 and Nasdaq Composite Indexes Hit New Record Highs
Kenneth J. Gruneisen - Passed the CAN SLIM® Master's Exam
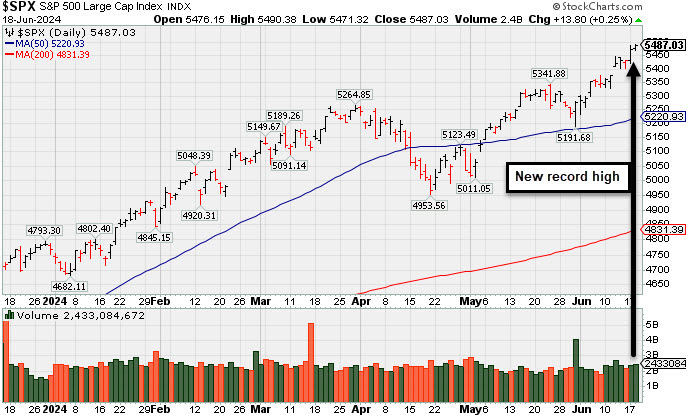
The S&P 500 and Nasdaq Composite posted gains on Tuesday for new record highs. Keep in mind that bond and equity markets are closed Wednesday for Juneteenth. Volume totals reported were higher than the prior session on the NYSE and on the Nasdaq exchange. Advancers led decliners by a 5-4 margin on the NYSE but decliners led advancers by a 4-3 margin on the Nasdaq exchange. Leadership improved as there were 57 high-ranked companies from the Leaders List that hit new 52-week highs and were listed on the BreakOuts Page, versus the total of 47 on the prior session. New 52-week highs outnumbered new 52-week lows on the NYSE but new lows outnumbered new highs on the Nasdaq exchange. The major indices are in a confirmed uptrend (M criteria) that recently endured some pressure. It was encouraging to see recent improvement in the new highs totals with the market showing some broad-based strength and resilience. Remember that any uptrend requires healthy leadership.
PICTURED: The S&P 500 Index is perched at a record high.
Shares of NVIDIA (NVDA +3.51%) rose following news that Delloite announced a collaboration with Hewlett Packard Enterprise (HPE +0.83%) and NVIDIA on co-developed generative AI solutions.
The information technology sector (+0.6%) and financial sector +0.6% were top performers. Consumer discretionary -0.4% fell in part due to weakness in homebuilder stocks after Lennar (LEN -4.98%) reported earnings with a disappointing outlook for a sequential decline in orders.
Tuesday brought a batch of mixed economic data that included weaker-than-expected retail sales, stronger-than-expected industrial production, and in-line business inventories. There was impressive demand for a fresh $13 billion 20-yr bond sale. The 10-yr note yield settled six basis points lower at 4.22% and the 2-yr note yield declined six basis points to 4.70%. |
 Kenneth J. Gruneisen started out as a licensed stockbroker in August 1987, a couple of months prior to the historic stock market crash that took the Dow Jones Industrial Average down -22.6% in a single day. He has published daily fact-based fundamental and technical analysis on high-ranked stocks online for two decades. Through FACTBASEDINVESTING.COM, Kenneth provides educational articles, news, market commentary, and other information regarding proven investment systems that work in good times and bad.
Comments contained in the body of this report are technical opinions only and are not necessarily those of Gruneisen Growth Corp. The material herein has been obtained from sources believed to be reliable and accurate, however, its accuracy and completeness cannot be guaranteed. Our firm, employees, and customers may effect transactions, including transactions contrary to any recommendation herein, or have positions in the securities mentioned herein or options with respect thereto. Any recommendation contained in this report may not be suitable for all investors and it is not to be deemed an offer or solicitation on our part with respect to the purchase or sale of any securities. |
|
 |
Bank, Semiconductor, and Commodity-Linked Indexes Rose
Kenneth J. Gruneisen - Passed the CAN SLIM® Master's Exam
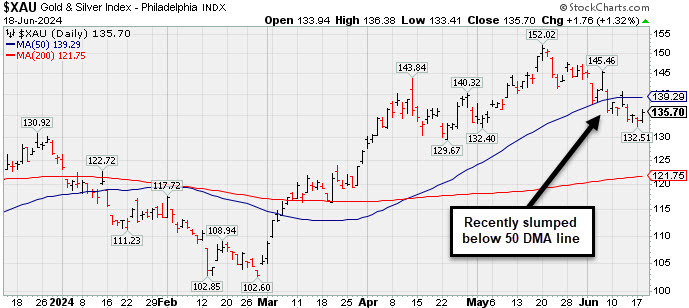
The Bank Index ($BKX +0.96%) posted a solid gain while the Broker/Dealer Index ($XBD +0.02%) finished flat and the Retail Index ($RLX -0.20%) edged lower.The Semiconductor Index ($SOX +1.35%) led the tech sector while the Networking Index ($NWX -0.45%) and the Biotech Index ($BTK -0.49%) both lost ground. Commodity-linked groups had a positive bias as the Gold & Silver Index ($XAU +1.32%), Oil Services Index ($OSX +0.42%) and the Integrated Oil Index ($XOI +0.32%) each posted gains.
PICTURED: The Gold & Silver Index ($XAU +1.32%) has recently sputtered below its 50-day moving average (DMA) line.
| Oil Services |
$OSX |
81.41 |
+0.34 |
+0.42% |
-2.95% |
| Integrated Oil |
$XOI |
1,975.15 |
+6.28 |
+0.32% |
+6.05% |
| Semiconductor |
$SOX |
5,765.12 |
+77.03 |
+1.35% |
+38.07% |
| Networking |
$NWX |
810.65 |
-3.65 |
-0.45% |
-2.66% |
| Broker/Dealer |
$XBD |
622.85 |
+0.11 |
+0.02% |
+11.76% |
| Retail |
$RLX |
4,452.96 |
-9.03 |
-0.20% |
+14.51% |
| Gold & Silver |
$XAU |
135.70 |
+1.76 |
+1.32% |
+7.96% |
| Bank |
$BKX |
102.40 |
+0.97 |
+0.96% |
+6.65% |
| Biotech |
$BTK |
5,145.65 |
-25.17 |
-0.49% |
-5.04% |
|
|
|
 |
Featured Stocks
Kenneth J. Gruneisen - Passed the CAN SLIM® Master's Exam
Symbol/Exchange
Company Name
Industry Group | PRICE | CHANGE
(%Change) | Day High | Volume
(% DAV)
(% 50 day avg vol) | 52 Wk Hi
% From Hi | Featured
Date | Price
Featured | Pivot Featured | | Max Buy |  TDG - NYSE TDG - NYSE
TransDigm Group
Aerospace/Defense | $1,339.48 | +20.57
1.56% | $1,345.95 | 159,621
76.01% of 50 DAV
50 DAV is 210,000 | $1,369.58
-2.20%
| 4/12/2024 | $1,224.21 | PP = $1,246.32 | | MB = $1,308.64 | Most Recent Note - 6/17/2024 3:54:05 PM
G - Quietly consolidating above its "max buy" level. Its 50 DMA line ($1,283) defines near-term support to watch. Fundamentals remain strong.
>>> FEATURED STOCK ARTICLE : Transdigm Consolidating Above 50-Day Moving Average - 6/12/2024 | View all notes | Set NEW NOTE alert | Company Profile | SEC News | Chart | Request a new note C A S I | USLM - NASDAQ
U.S. Lime & Minerals
Bldg-Cement/Concrt/Ag | $366.47 | +11.88
3.35% | $366.47 | 49,220
205.08% of 50 DAV
50 DAV is 24,000 | $378.78
-3.25%
| 6/18/2024 | $356.30 | PP = $378.88 | | MB = $397.82 |  Most Recent Note - 6/18/2024 12:34:11 PM Most Recent Note - 6/18/2024 12:34:11 PM
Y - Color code is changed to yellow with new pivot point cited based on its 5/15/24 high plus 10 cents. Subsequent gains above the pivot point backed by at least +40% above average volume may trigger a new technical buy signal. Rebounding toward the prior high with today's 3rd consecutive gain with ever-increasing volume. Recently found prompt support near its 50 DMA line ($333). Fundamentals remain strong.
>>> FEATURED STOCK ARTICLE : Streak of Losses Testing 50-Day Moving Average Line - 6/6/2024 | View all notes | Set NEW NOTE alert | Company Profile | SEC News | Chart | Request a new note C A S I | CLS - NYSE
Celestica
Elec-Contract Mfg | $59.09 | +2.07
3.63% | $60.13 | 2,278,745
95.95% of 50 DAV
50 DAV is 2,375,000 | $61.06
-3.23%
| 5/15/2024 | $51.52 | PP = $51.22 | | MB = $53.78 | Most Recent Note - 6/18/2024 3:26:23 PM
G - Wedging higher approaching the prior high. It has not formed a sound base of sufficient length yet found support near prior highs in the $51 area. Its 50 DMA line ($50) defines additional near-term support to watch on pullbacks.
>>> FEATURED STOCK ARTICLE : Steady Pullback to Below "Max Buy" Level Following Rally - 6/4/2024 | View all notes | Set NEW NOTE alert | Company Profile | SEC News | Chart | Request a new note C A S I | DECK - NYSE
Deckers Outdoor
Apparel-Shoes and Rel Mfg | $1,008.39 | -9.10
-0.89% | $1,026.41 | 420,333
118.40% of 50 DAV
50 DAV is 355,000 | $1,106.89
-8.90%
| 5/24/2024 | $1,010.60 | PP = $956.27 | | MB = $1,004.08 | Most Recent Note - 6/13/2024 4:36:56 PM
G - Consolidating near its all-time high, extended from the prior base. Prior highs in the $956 area define initial support to watch on pullbacks.
>>> FEATURED STOCK ARTICLE : Deckers Consolidating Near High - 6/13/2024 | View all notes | Set NEW NOTE alert | Company Profile | SEC News | Chart | Request a new note C A S I | ELF - NYSE
e.l.f. Beauty
Cosmetics/Personal Care | $213.73 | +18.32
9.38% | $214.61 | 1,775,590
113.24% of 50 DAV
50 DAV is 1,568,000 | $221.83
-3.65%
| 6/18/2024 | $212.40 | PP = $221.93 | | MB = $233.03 | Most Recent Note - 6/18/2024 3:24:53 PM
Y - Rallying above recent highs toward its all-time high with today''s gap up and big gain backed by higher volume. Color code is changed to yellow with new pivot point cited based on its 3/04/24 high plus 10 cents. Subsequent gains above the pivot point backed by at least +40% above average volume may trigger a new (or add-on) technical buy signal. Its 50 DMA line ($174) defines important near-term support to watch.
>>> FEATURED STOCK ARTICLE : Down on Lighter Volume After Breakout From "Double Bottom" Base - 5/29/2024 | View all notes | Set NEW NOTE alert | Company Profile | SEC News | Chart | Request a new note C A S I | Symbol/Exchange
Company Name
Industry Group | PRICE | CHANGE
(%Change) | Day High | Volume
(% DAV)
(% 50 day avg vol) | 52 Wk Hi
% From Hi | Featured
Date | Price
Featured | Pivot Featured | | Max Buy | PDD - NASDAQ
PDD Holdings ADR
Retail-Internet | $144.18 | -4.12
-2.78% | $147.94 | 7,284,125
77.92% of 50 DAV
50 DAV is 9,348,000 | $164.69
-12.45%
| 5/24/2024 | $161.85 | PP = $153.09 | | MB = $160.74 | Most Recent Note - 6/17/2024 5:06:51 PM
Y - Pulled back today with below average. Raised concerns recently as it negated the breakout after clearing a 20-week base. Disciplined investors avoid big losses by selling any stock that falls more than 7-8% below their purchase price. See the latest FSU analysis for more details and a new annotated graph.
>>> FEATURED STOCK ARTICLE : Still Sputtering Below Pivot Point After Negating Breakout - 6/17/2024 | View all notes | Set NEW NOTE alert | Company Profile | SEC News | Chart | Request a new note C A S I | CRWD - NASDAQ
CrowdStrike Holdings
Computer Sftwr-Security | $389.51 | -0.92
-0.24% | $393.29 | 4,089,540
114.59% of 50 DAV
50 DAV is 3,569,000 | $394.64
-1.30%
| 5/28/2024 | $351.47 | PP = $365.10 | | MB = $383.36 | Most Recent Note - 6/13/2024 4:35:53 PM
Y - Color code is changed to yellow after pulling back just below its "max buy" level today with near average volume following 4 consecutive volume-driven gains for new all-time highs. Its 50 DMA line ($323) defines near-term support to watch. Bullish action came after it reported Apr '24 quarterly earnings +63% on +33% sales revenues versus the year-ago period, continuing its strong earnings track record.
>>> FEATURED STOCK ARTICLE : Volume-Driven Loss Triggered Technical Sell Signal - 5/30/2024 | View all notes | Set NEW NOTE alert | Company Profile | SEC News | Chart | Request a new note C A S I | NVO - NYSE
Novo Nordisk ADR
Medical-Ethical Drugs | $140.80 | +0.43
0.31% | $141.71 | 2,637,679
71.52% of 50 DAV
50 DAV is 3,688,000 | $144.50
-2.56%
| 6/7/2024 | $143.06 | PP = $138.38 | | MB = $145.30 | Most Recent Note - 6/17/2024 3:52:17 PM
Y - Pulled back today with light volume. Recently wedged to new all-time highs with gains lacking great volume conviction. Color code was changed to yellow with pivot point cited based on its 3/07/24 high. To clinch a proper technical buy signal gains above the pivot point must be backed by at least +40% above-average volume. Fundamentals remain strong.
>>> FEATURED STOCK ARTICLE : Wedging Into New High Ground - 6/7/2024 | View all notes | Set NEW NOTE alert | Company Profile | SEC News | Chart | Request a new note C A S I | GVA - NYSE
Granite Construction
Bldg-Heavy Construction | $62.85 | +0.88
1.42% | $62.91 | 360,224
83.19% of 50 DAV
50 DAV is 433,000 | $64.33
-2.30%
| 6/11/2024 | $59.76 | PP = $64.33 | | MB = $67.55 | Most Recent Note - 6/18/2024 3:27:57 PM
Y - Perched within close striking distance of its 52-week high with today''s gain backed by light volume. Color code was changed to yellow when highlighted on the 6/11/24 mid-day report as it was noted that a valid secondary buy point exists up to +5% above the recent high after finding support at its 10 WMA line following a prior breakout. Reported improved earnings in the Jun, Sep, Dec ''23, and Mar ''24 quarters versus the year ago periods. Annual earnings growth has been strong and steady.
>>> FEATURED STOCK ARTICLE : Granite Construction Found Support at 10-Week Moving Average - 6/11/2024 | View all notes | Set NEW NOTE alert | Company Profile | SEC News | Chart | Request a new note C A S I |
|
|
|
Color Codes Explained :
Y - Better candidates highlighted by our
staff of experts.
G - Previously featured
in past reports as yellow but may no longer be buyable under the
guidelines.
***Last / Change / Volume data in this table is the closing quote data***
|
|
|
THESE ARE NOT BUY RECOMMENDATIONS!
Comments contained in the body of this report are technical
opinions only. The material herein has been obtained
from sources believed to be reliable and accurate, however,
its accuracy and completeness cannot be guaranteed.
This site is not an investment advisor, hence it does
not endorse or recommend any securities or other investments.
Any recommendation contained in this report may not
be suitable for all investors and it is not to be deemed
an offer or solicitation on our part with respect to
the purchase or sale of any securities. All trademarks,
service marks and trade names appearing in this report
are the property of their respective owners, and are
likewise used for identification purposes only.
This report is a service available
only to active Paid Premium Members.
You may opt-out of receiving report notifications
at any time. Questions or comments may be submitted
by writing to Premium Membership Services 665 S.E. 10 Street, Suite 201 Deerfield Beach, FL 33441-5634 or by calling 1-800-965-8307
or 954-785-1121.
|
|
|