You are not logged in.
This means you
CAN ONLY VIEW reports that were published prior to Wednesday, April 9, 2025.
You
MUST UPGRADE YOUR MEMBERSHIP if you want to see any current reports.
AFTER MARKET UPDATE - MONDAY, JUNE 16TH, 2014
Previous After Market Report Next After Market Report >>>
|
|
|
|
DOW |
+5.27 |
16,781.01 |
+0.03% |
|
Volume |
590,571,860 |
+5% |
|
Volume |
1,558,703,570 |
-4% |
|
NASDAQ |
+10.46 |
4,321.11 |
+0.24% |
|
Advancers |
1,557 |
49% |
|
Advancers |
1,430 |
51% |
|
S&P 500 |
+1.62 |
1,937.78 |
+0.08% |
|
Decliners |
1,496 |
47% |
|
Decliners |
1,271 |
45% |
|
Russell 2000 |
+4.14 |
1,166.82 |
+0.36% |
|
52 Wk Highs |
159 |
|
|
52 Wk Highs |
76 |
|
|
S&P 600 |
+0.73 |
668.02 |
+0.11% |
|
52 Wk Lows |
6 |
|
|
52 Wk Lows |
22 |
|
|
 |
Indices Showed Little Decisiveness While Hovering Near Record Highs
Kenneth J. Gruneisen - Passed the CAN SLIM® Master's Exam
The major averages finished little changed on Monday's session. The volume was reported lighter than the prior session total on the Nasdaq exchange and volume was reported slightly higher on the NYSE. Advancers led decliners by a narrow margin on the NYSE and on the Nasdaq exchange. Leadership expanded as there were 38 high-ranked companies from the CANSLIM.net Leaders List that made new 52-week highs and appeared on the CANSLIM.net BreakOuts Page, up from the total of 25 stocks on the prior session. New 52-week highs outnumbered new 52-week lows on the NYSE and Nasdaq exchange. There were gains for 7 of the 10 high-ranked companies currently included on the Featured Stocks Page. The S&P 500 Index and Dow Jones Industrial Average recently surged into new high territory with healthy leadership (new 52-week highs) sending a reassuring signal that the market direction (M criteria) is in a "confirmed uptrend". Any new buying efforts should be selective and focused in stocks meeting all key criteria of the fact-based investment system.
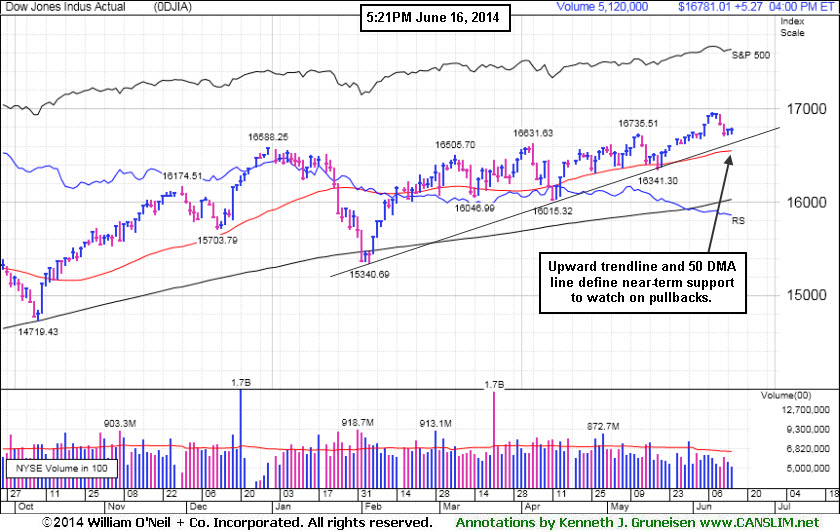
PICTURED: The Dow Jones Industrial Average is consolidating well above its 50-day moving average (DMA) line and above an upward trendline defining near-term support to watch on pullbacks.
The major averages ended a choppy trading session modestly higher as investors weighed the increased violence in Iraq against encouraging updates on the U.S. economy and M&A news. Before the open, reports that showed industrial output improved in May and activity in the Fed's New York region expanded at a faster pace in June. An update on the housing market revealed homebuilder sentiment improved this month to its best level since January.
On the M&A front, Covidien (COV +20.5%) was up significantly after Medtronic (MDT -1.10%) agreed to purchase the company for $43 billion. Williams Company (WMB +18.74%) spiked higher after announcing it would acquire the remainder of Access Midstream Partners (ACMP +1.85%) it doesn't own for $6 billion.
Seven of 10 sectors in the S&P 500 were up on the session. Utilities and energy were the best performing groups as Exelon (EXC +1.09%) and Chevron (CVX +1.01%) rose. Financials and materials were down the most as Bank of America (BAC -1.04%) and Alcoa (AA -1.17%) declined.
In fixed-income trading, the benchmark 10-year note was up 2/32 to yield 2.60%.
The CANSLIM.net Featured Stocks Page shows the most action-worthy candidates and their latest notes and a Headline Link directs members to the latest detailed analysis with data-packed graphs annotated by a Certified expert along with links to additional resources. The Premium Member Homepage includes "dynamic archives" to all prior pay reports published. Watch for an announcement via email concerning the next WEBCAST.
|
 Kenneth J. Gruneisen started out as a licensed stockbroker in August 1987, a couple of months prior to the historic stock market crash that took the Dow Jones Industrial Average down -22.6% in a single day. He has published daily fact-based fundamental and technical analysis on high-ranked stocks online for two decades. Through FACTBASEDINVESTING.COM, Kenneth provides educational articles, news, market commentary, and other information regarding proven investment systems that work in good times and bad.
Comments contained in the body of this report are technical opinions only and are not necessarily those of Gruneisen Growth Corp. The material herein has been obtained from sources believed to be reliable and accurate, however, its accuracy and completeness cannot be guaranteed. Our firm, employees, and customers may effect transactions, including transactions contrary to any recommendation herein, or have positions in the securities mentioned herein or options with respect thereto. Any recommendation contained in this report may not be suitable for all investors and it is not to be deemed an offer or solicitation on our part with respect to the purchase or sale of any securities. |
|
 |
Retail, Semiconductor, and Biotech Indexes Were Positive Influences
Kenneth J. Gruneisen - Passed the CAN SLIM® Master's Exam
On Monday the Bank Index ($BKX -0.71%) created a drag on the major averages and the Broker/Dealer Index ($XBD -0.09%) finished flat. The Retail Index ($RLX +0.52%) was a positive influence, and the tech sector saw modest gains from the Biotechnology Index ($BTK +0.48%) and the Semiconductor Index ($SOX +0.55%). The Networking Index ($NWX -0.18%) edged lower. The Gold & Silver Index ($XAU -0.44%) finished with a small loss while energy-related groups held their ground as the Oil Services Index ($OSX -0.14%) and Integrated Oil Index ($XOI +0.08%) both finished flat.
Charts courtesy www.stockcharts.com
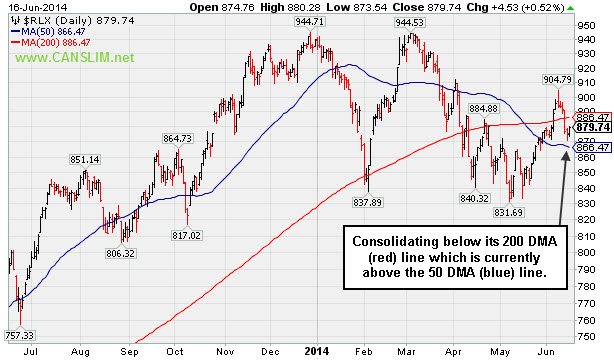
PICTURED: The Retail Index ($RLX +0.52%) is consolidating below its upward sloping 200-day moving average (DMA) line. That long-term average is currently above its downward sloping 50 DMA line.
| Oil Services |
$OSX |
298.90 |
-0.42 |
-0.14% |
+6.36% |
| Integrated Oil |
$XOI |
1,678.42 |
+1.29 |
+0.08% |
+11.66% |
| Semiconductor |
$SOX |
630.93 |
+3.44 |
+0.55% |
+17.92% |
| Networking |
$NWX |
339.01 |
-0.62 |
-0.18% |
+4.65% |
| Broker/Dealer |
$XBD |
156.75 |
-0.14 |
-0.09% |
-2.37% |
| Retail |
$RLX |
879.74 |
+4.53 |
+0.52% |
-6.39% |
| Gold & Silver |
$XAU |
91.89 |
-0.41 |
-0.44% |
+9.20% |
| Bank |
$BKX |
70.21 |
-0.50 |
-0.71% |
+1.37% |
| Biotech |
$BTK |
2,720.12 |
+12.98 |
+0.48% |
+16.72% |
|
|
|
 |
Recent Lows and 50-Day Moving Average Line Define Near-Term Support
Kenneth J. Gruneisen - Passed the CAN SLIM® Master's Exam
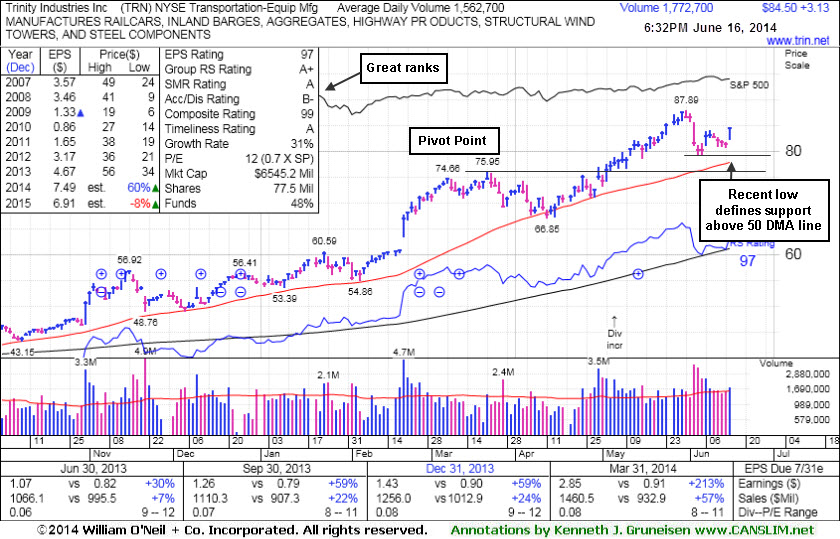
Trinity Industries Inc (TRN +$3.13 or +3.85% to $84.50) gapped up today for a solid gain and finished near the session high, ending a streak of 4 consecutive losses. Recent lows define near-term support that comes into play above its 50-day moving average (DMA) line ($77.79). Subsequent deterioration below those levels would raise concerns and trigger technical sell signals.
TRN traded up as much as +15.57% since first highlighted in yellow in the 4/30/14 mid-day report report (read here). Disciplined investors avoid chasing stocks extended more than +5% above prior highs and they always limit losses by selling any stock that falls more than -7% from their purchase price. The high-ranked Transportation - Equipment Manufacturing firm was last shown in this FSU section on 6/02/14 with annotated graphs under the headline, "Extended From Prior Base After +15% Rally in One Month".
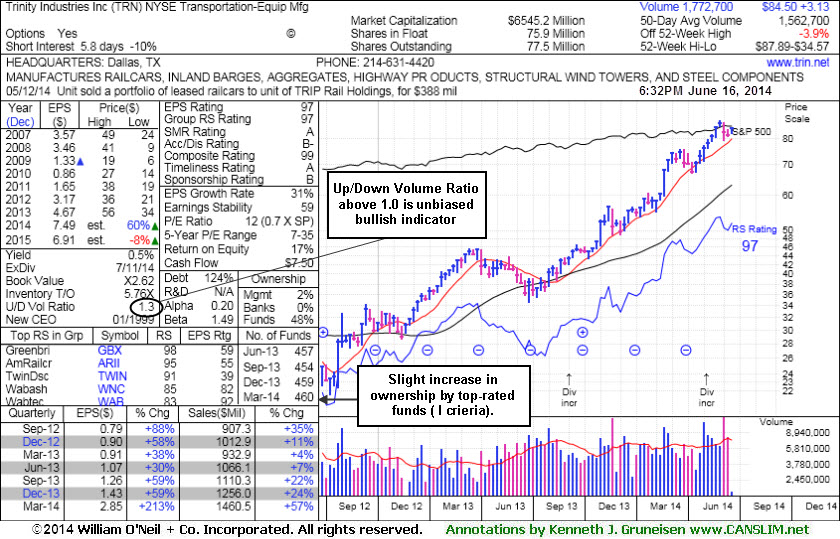
It has earned high ranks and reported earnings +213% on +57% sales revenues for the Mar '14 quarter. Prior quarterly comparisons were above the +25% minimum earnings guideline (C criteria). Annual earnings (A criteria) have improved following a downturn in FY '08-10. Its current Up/Down Volume Ratio of 1.3 is an unbiased indication that its shares have been under accumulation over the past 50 days. Its fairly small supply of 77.5 million shares outstanding (S criteria) can contribute to greater price volatility in the event of institutional buying or selling.
|
|
|
Color Codes Explained :
Y - Better candidates highlighted by our
staff of experts.
G - Previously featured
in past reports as yellow but may no longer be buyable under the
guidelines.
***Last / Change / Volume data in this table is the closing quote data***
Symbol/Exchange
Company Name
Industry Group |
PRICE |
CHANGE
(%Change) |
Day High |
Volume
(% DAV)
(% 50 day avg vol) |
52 Wk Hi
% From Hi |
Featured
Date |
Price
Featured |
Pivot Featured |
|
Max Buy |
AFSI
-
NASDAQ
Amtrust Financial Svcs
INSURANCE - Property and; Casualty Insurance
|
$42.52
|
+0.14
0.33% |
$42.68
|
222,489
33.41% of 50 DAV
50 DAV is 666,000
|
$47.10
-9.72%
|
5/21/2014
|
$44.85
|
PP = $44.85
|
|
MB = $47.09
|
Most Recent Note - 6/13/2014 5:13:01 PM
G - Volume totals have been cooling while consolidating above its 50 DMA line which acted as support. Disciplined investors always limit losses by selling any stock that falls more than -7% from their purchase price.
>>> FEATURED STOCK ARTICLE : Halted Slide at 50-Day Moving Average After Distributional Pressure - 6/6/2014
View all notes |
Set NEW NOTE alert |
CANSLIM.net Company Profile |
SEC
News |
Chart |
Request a new note
C
A N
S L
I M


|
AL
-
NYSE
Air Lease Corp Cl A
DIVERSIFIED SERVICES - Rental and Leasing Services
|
$37.67
|
-0.28
-0.74% |
$38.04
|
1,743,831
174.73% of 50 DAV
50 DAV is 998,000
|
$42.89
-12.17%
|
5/9/2014
|
$38.27
|
PP = $38.25
|
|
MB = $40.16
|
Most Recent Note - 6/13/2014 12:05:54 PM
G - Rebounded from early lows back into positive territory. On the prior session its 50 DMA line violation triggered a technical sell signal as it suffered a damaging loss backed by heavy volume amid widespread losses in the industry group. Only a prompt rebound above its 50 DMA line would help its outlook improve. Disciplined investors limit losses by selling any stock that falls more than -7% from their purchase price.
>>> FEATURED STOCK ARTICLE : Enduring Mild Distributional Pressure on Pullback - 6/11/2014
View all notes |
Set NEW NOTE alert |
CANSLIM.net Company Profile |
SEC
News |
Chart |
Request a new note
C
A N
S L
I M
|
EQM
-
NYSE
E Q T Midstream Partners
ENERGY - Oil and Gas Pipelines
|
$95.05
|
+0.58
0.61% |
$97.22
|
450,826
165.14% of 50 DAV
50 DAV is 273,000
|
$96.35
-1.35%
|
12/12/2013
|
$53.17
|
PP = $56.51
|
|
MB = $59.34
|
 Most Recent Note - 6/16/2014 12:11:40 PM
G - Hit yet another new 52-week high with today's 3rd consecutive gain. Prior reports repeatedly cautioned members - "It is very extended from any sound base. Fundamental concerns remain after 2 consecutive sub par quarters below the +25% minimum earnings guideline."
>>> FEATURED STOCK ARTICLE : New Highs Again With Light Volume Behind Streak of Gains - 6/4/2014
View all notes |
Set NEW NOTE alert |
CANSLIM.net Company Profile |
SEC
News |
Chart |
Request a new note
C
A N
S L
I M
|
GRFS
-
NASDAQ
Grifols Sa Ads
Medical-Ethical Drugs
|
$44.96
|
+0.29
0.65% |
$45.36
|
444,722
64.45% of 50 DAV
50 DAV is 690,000
|
$46.66
-3.64%
|
5/15/2014
|
$41.14
|
PP = $43.55
|
|
MB = $45.73
|
Most Recent Note - 6/13/2014 5:59:46 PM
Y - Color code is changed to yellow after a 4th consecutive loss today on lighter volume led to a close below its "max buy" level. Prior highs near $43 area define near-term support to watch on pullbacks.
>>> FEATURED STOCK ARTICLE : Finding Support Above 50-Day Moving Average - 6/3/2014
View all notes |
Set NEW NOTE alert |
CANSLIM.net Company Profile |
SEC
News |
Chart |
Request a new note
C
A N
S L
I M
|
ICON
-
NASDAQ
Iconix Brand Group Inc
CONSUMER NON-DURABLES - Textile - Apparel Footwear
|
$43.09
|
+0.34
0.80% |
$43.13
|
303,499
58.59% of 50 DAV
50 DAV is 518,000
|
$44.81
-3.84%
|
6/5/2014
|
$43.54
|
PP = $43.44
|
|
MB = $45.61
|
Most Recent Note - 6/12/2014 6:05:32 PM
Y - Pulled back today for a 3rd consecutive loss, quietly retreating from its all-time high. It stalled since triggering its latest technical buy signal. Prior highs in the $43-42 area define initial support to watch. Disciplined investors avoid chasing stocks extended more than +5% above their pivot point, and they always sell if any stock falls more than -7% from their purchase price.
>>> FEATURED STOCK ARTICLE : Gain With Above Average Volume an Encouraging Sign - 6/5/2014
View all notes |
Set NEW NOTE alert |
CANSLIM.net Company Profile |
SEC
News |
Chart |
Request a new note
C
A N
S L
I M
|
Symbol/Exchange
Company Name
Industry Group |
PRICE |
CHANGE
(%Change) |
Day High |
Volume
(% DAV)
(% 50 day avg vol) |
52 Wk Hi
% From Hi |
Featured
Date |
Price
Featured |
Pivot Featured |
|
Max Buy |
KORS
-
NYSE
Michael Kors Hldgs Ltd
RETAIL - Apparel Stores
|
$90.29
|
-3.61
-3.84% |
$93.90
|
5,432,689
196.84% of 50 DAV
50 DAV is 2,760,000
|
$101.04
-10.64%
|
5/27/2014
|
$96.70
|
PP = $101.14
|
|
MB = $106.20
|
Most Recent Note - 6/16/2014 5:51:33 PM
G - Finished near the session low with a damaging volume-driven loss today violating its 50 DMA line triggering a technical sell signal. Color code was changed to green. Only a prompt rebound about the 50 DMA line would help its outlook improve.
>>> FEATURED STOCK ARTICLE : Relative Strength Line's Downward Slope a Discouraging Sign - 6/10/2014
View all notes |
Set NEW NOTE alert |
CANSLIM.net Company Profile |
SEC
News |
Chart |
Request a new note
C
A N
S L
I M
|
PANW
-
NYSE
Palo Alto Networks
Computer Sftwr-Security
|
$80.63
|
+1.83
2.32% |
$81.24
|
1,782,227
89.47% of 50 DAV
50 DAV is 1,992,000
|
$82.00
-1.67%
|
5/29/2014
|
$75.95
|
PP = $72.50
|
|
MB = $76.13
|
Most Recent Note - 6/16/2014 5:54:47 PM
G - Finished at a best-ever close with near average volume behind today's 5th consecutive gain. Prior highs near $72 define important support above its 50 DMA line.
>>> FEATURED STOCK ARTICLE : Encountered Distributional Pressure After Touching New 52-Week High - 6/12/2014
View all notes |
Set NEW NOTE alert |
CANSLIM.net Company Profile |
SEC
News |
Chart |
Request a new note
C
A N
S L
I M
|
SN
-
NYSE
Sanchez Energy Corp
ENERGY - Independent Oil and Gas
|
$36.80
|
+0.41
1.13% |
$36.84
|
1,405,107
101.67% of 50 DAV
50 DAV is 1,382,000
|
$36.72
0.22%
|
5/22/2014
|
$33.00
|
PP = $31.59
|
|
MB = $33.17
|
Most Recent Note - 6/13/2014 12:49:07 PM
G - Perched at its 52-week high today, extended from its prior base. Disciplined investors avoid chasing extended stocks. Prior highs near $31-32 define support to watch on pullbacks. Priced the recently announced offering of Common Stock and Senior Notes.
>>> FEATURED STOCK ARTICLE : Finished Near Session Low After Hitting new 52-Week High - 6/9/2014
View all notes |
Set NEW NOTE alert |
CANSLIM.net Company Profile |
SEC
News |
Chart |
Request a new note
C
A N
S L
I M
|
TRN
-
NYSE
Trinity Industries Inc
TRANSPORTATION - Railroads
|
$84.50
|
+3.13
3.85% |
$84.58
|
1,772,767
113.49% of 50 DAV
50 DAV is 1,562,000
|
$87.89
-3.85%
|
4/30/2014
|
$75.57
|
PP = $76.05
|
|
MB = $79.85
|
Most Recent Note - 6/16/2014 5:58:03 PM
G - Gapped up today for a solid gain and finished near the session high following 4 consecutive losses. Prior highs in the $76 area and its 50 DMA line ($77.79) define important support to watch.
>>> FEATURED STOCK ARTICLE : Recent Lows and 50-Day Moving Average Line Define Near-Term Support - 6/16/2014
View all notes |
Set NEW NOTE alert |
CANSLIM.net Company Profile |
SEC
News |
Chart |
Request a new note
C
A N
S L
I M
|
WLK
-
NYSE
Westlake Chemical Corp
CHEMICALS - Specialty Chemicals
|
$82.38
|
-0.03
-0.04% |
$82.73
|
380,931
50.66% of 50 DAV
50 DAV is 752,000
|
$83.17
-0.95%
|
4/29/2014
|
$72.79
|
PP = $69.31
|
|
MB = $72.78
|
Most Recent Note - 6/13/2014 5:56:43 PM
G - Quietly hovering near its 52-week high. Prior highs near $77 define important near-term support to watch on pullbacks. See the latest FSU analysis for more details and new annotated graphs.
>>> FEATURED STOCK ARTICLE : Chemical Firm Quietly Posted 7th Consecutive Weekly Gain - 6/13/2014
View all notes |
Set NEW NOTE alert |
CANSLIM.net Company Profile |
SEC
News |
Chart |
Request a new note
C
A N
S L
I M
|
Symbol/Exchange
Company Name
Industry Group |
PRICE |
CHANGE
(%Change) |
Day High |
Volume
(% DAV)
(% 50 day avg vol) |
52 Wk Hi
% From Hi |
Featured
Date |
Price
Featured |
Pivot Featured |
|
Max Buy |
|
|
|
THESE ARE NOT BUY RECOMMENDATIONS!
Comments contained in the body of this report are technical
opinions only. The material herein has been obtained
from sources believed to be reliable and accurate, however,
its accuracy and completeness cannot be guaranteed.
This site is not an investment advisor, hence it does
not endorse or recommend any securities or other investments.
Any recommendation contained in this report may not
be suitable for all investors and it is not to be deemed
an offer or solicitation on our part with respect to
the purchase or sale of any securities. All trademarks,
service marks and trade names appearing in this report
are the property of their respective owners, and are
likewise used for identification purposes only.
This report is a service available
only to active Paid Premium Members.
You may opt-out of receiving report notifications
at any time. Questions or comments may be submitted
by writing to Premium Membership Services 665 S.E. 10 Street, Suite 201 Deerfield Beach, FL 33441-5634 or by calling 1-800-965-8307
or 954-785-1121.
|
|
|

