***Last / Change / Volume data in this table is the closing quote data***
Symbol/Exchange
Company Name
Industry Group |
PRICE |
CHANGE
(%Change) |
Day High |
Volume
(% DAV)
(% 50 day avg vol) |
52 Wk Hi
% From Hi |
Featured
Date |
Price
Featured |
Pivot Featured |
|
Max Buy |
CACC
-
NASDAQ
Credit Acceptance Corp
FINANCIAL SERVICES - Credit Services
|
$75.75
|
-0.06
-0.08% |
$77.76
|
25,980
67.83% of 50 DAV
50 DAV is 38,300
|
$82.29
-7.95%
|
6/2/2011
|
$76.10
|
PP = $82.39
|
|
MB = $86.51
|
Most Recent Note - 6/10/2011 4:44:39 PM
G - This high-ranked leader in the Finance - Consumer Loans industry closed the week with a loss on above average volume sending it below its 50 DMA line. Its color code is changed to green while sinking further from its pivot point.
>>> The latest Featured Stock Update with an annotated graph appeared on 6/6/2011. Click here.
View all notes |
Alert me of new notes |
CANSLIM.net Company Profile |
SEC |
Zacks Reports |
StockTalk |
News |
Chart |
Request a new note
C
A N
S L
I M


|
CEVA
-
NASDAQ
Ceva Inc
ELECTRONICS - Semiconductor - Specialized
|
$29.77
|
-0.60
-1.98% |
$30.74
|
118,118
52.66% of 50 DAV
50 DAV is 224,300
|
$35.60
-16.38%
|
5/25/2011
|
$32.98
|
PP = $32.05
|
|
MB = $33.65
|
 Most Recent Note - 6/13/2011 6:42:10 PM
G - Color code is changed to green after today's loss on light volume led to a close just under its 50 DMA line while it slumped further below its pivot point and under prior highs. Its prior low ($27.82 on 5/17/11) defines the next important chart support level to watch.
>>> The latest Featured Stock Update with an annotated graph appeared on 5/25/2011. Click here.
View all notes |
Alert me of new notes |
CANSLIM.net Company Profile |
SEC |
Zacks Reports |
StockTalk |
News |
Chart |
Request a new note
C
A N
S L
I M
|
CMG
-
NYSE
Chipotle Mexican Grill
LEISURE - Restaurants
|
$270.90
|
-0.97
-0.36% |
$275.64
|
627,079
59.94% of 50 DAV
50 DAV is 1,046,200
|
$295.99
-8.48%
|
4/1/2011
|
$274.00
|
PP = $275.10
|
|
MB = $288.86
|
Most Recent Note - 6/10/2011 4:51:45 PM
G - Down today with below average volume, slumping to a close below its 50 DMA line, raising concerns. Its lows from early May define the next chart support level to watch.
>>> The latest Featured Stock Update with an annotated graph appeared on 5/17/2011. Click here.
View all notes |
Alert me of new notes |
CANSLIM.net Company Profile |
SEC |
Zacks Reports |
StockTalk |
News |
Chart |
Request a new note
C
A N
S L
I M
|
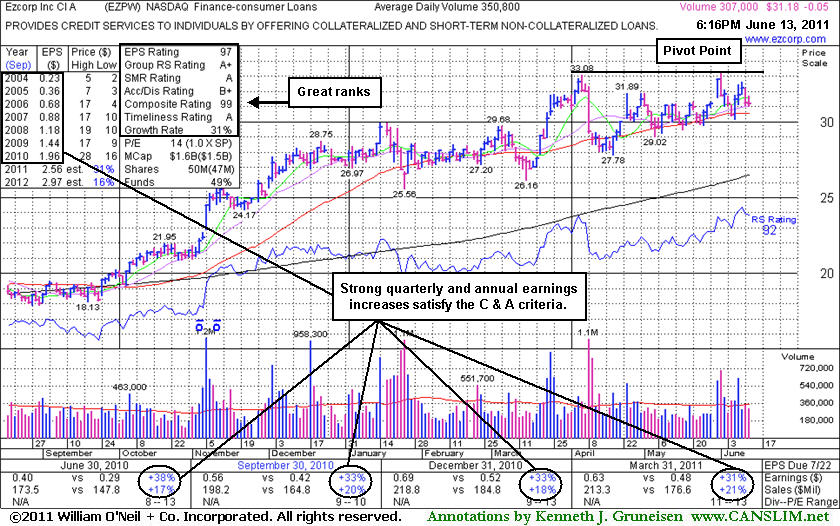
EZPW
-
NASDAQ
Ezcorp Inc Cl A
SPECIALTY RETAIL - Specialty Retail, Other
|
$31.18
|
-0.05
-0.16% |
$31.69
|
309,398
88.20% of 50 DAV
50 DAV is 350,800
|
$33.31
-6.39%
|
6/13/2011
|
$31.18
|
PP = $33.41
|
|
MB = $35.08
|
Most Recent Note - 6/13/2011 6:50:20 PM
Y - Consolidating -6.4% off its 52-week high. Color code is changed to yellow with new pivot point cited following a choppy cup-with-handle base. Recent lows and its 50 DMA line define important nearby chart support. The M criteria argues against new buying efforts without a FTD from at least one of the major averages as confirmation of a new rally. See the latest FSU analysis for more details and a new annotated graph.
>>> The latest Featured Stock Update with an annotated graph appeared on 6/13/2011. Click here.
View all notes |
Alert me of new notes |
CANSLIM.net Company Profile |
SEC |
Zacks Reports |
StockTalk |
News |
Chart |
Request a new note
C
A N
S L
I M
|
FCFS
-
NASDAQ
First Cash Financial Svs
SPECIALTY RETAIL - Specialty Retail, Other
|
$39.58
|
+0.08
0.20% |
$39.87
|
157,903
81.31% of 50 DAV
50 DAV is 194,200
|
$42.36
-6.56%
|
5/31/2011
|
$42.00
|
PP = $40.23
|
|
MB = $42.24
|
Most Recent Note - 6/10/2011 5:00:15 PM
G - Recently found support near its 50 DMA line and prior lows. Its color code was changed to green after damaging losses on higher volume negated its latest breakout.
>>> The latest Featured Stock Update with an annotated graph appeared on 5/31/2011. Click here.
View all notes |
Alert me of new notes |
CANSLIM.net Company Profile |
SEC |
Zacks Reports |
StockTalk |
News |
Chart |
Request a new note
C
A N
S L
I M
|
Symbol/Exchange
Company Name
Industry Group |
PRICE |
CHANGE
(%Change) |
Day High |
Volume
(% DAV)
(% 50 day avg vol) |
52 Wk Hi
% From Hi |
Featured
Date |
Price
Featured |
Pivot Featured |
|
Max Buy |
FOSL
-
NASDAQ
Fossil Inc
CONSUMER DURABLES - Recreational Goods, Other
|
$106.90
|
+1.42
1.35% |
$108.81
|
821,759
109.82% of 50 DAV
50 DAV is 748,300
|
$108.35
-1.34%
|
2/1/2011
|
$73.30
|
PP = $74.44
|
|
MB = $78.16
|
Most Recent Note - 6/10/2011 5:02:09 PM
G - Touched a new 52-week high today but encountered distributional pressure while completing the 5th week of trading in a tight range forming a "late-stage" base. Prior highs near $96 define initial support to watch coinciding with its 50 DMA line.
>>> The latest Featured Stock Update with an annotated graph appeared on 6/7/2011. Click here.
View all notes |
Alert me of new notes |
CANSLIM.net Company Profile |
SEC |
Zacks Reports |
StockTalk |
News |
Chart |
Request a new note
C
A N
S L
I M
|
HS
-
NYSE
Healthspring Inc
HEALTH SERVICES - Health Care Plans
|
$40.95
|
-0.22
-0.53% |
$41.68
|
796,905
92.19% of 50 DAV
50 DAV is 864,400
|
$45.11
-9.22%
|
3/22/2011
|
$38.29
|
PP = $38.85
|
|
MB = $40.79
|
Most Recent Note - 6/10/2011 5:03:51 PM
G - Volume was near average while today's loss continued testing its 50 DMA line. That important short-term average defines chart support to watch where a violation would trigger a technical sell signal.
>>> The latest Featured Stock Update with an annotated graph appeared on 5/20/2011. Click here.
View all notes |
Alert me of new notes |
CANSLIM.net Company Profile |
SEC |
Zacks Reports |
StockTalk |
News |
Chart |
Request a new note
C
A N
S L
I M
|
INFA
-
NASDAQ
Informatica Corp
COMPUTER SOFTWARE and SERVICES - Business Software and Services
|
$53.86
|
-0.47
-0.86% |
$54.86
|
870,632
72.16% of 50 DAV
50 DAV is 1,206,500
|
$59.98
-10.21%
|
3/24/2011
|
$50.04
|
PP = $49.86
|
|
MB = $52.35
|
Most Recent Note - 6/10/2011 5:05:03 PM
G - Down today with below average volume, slumping to its 50 DMA line which defines near-term support to watch. It hit a new 52-week high on 6/01/11 and then there was a negative reversal for a loss on above average volume. This high-ranked Computer Software - Database firm did not form a sound new base pattern.
>>> The latest Featured Stock Update with an annotated graph appeared on 5/24/2011. Click here.
View all notes |
Alert me of new notes |
CANSLIM.net Company Profile |
SEC |
Zacks Reports |
StockTalk |
News |
Chart |
Request a new note
C
A N
S L
I M
|
MELI
-
NASDAQ
Mercadolibre Inc
INTERNET - Internet Software and; Services
|
$77.31
|
-1.55
-1.97% |
$79.31
|
758,212
106.69% of 50 DAV
50 DAV is 710,700
|
$92.73
-16.63%
|
6/1/2011
|
$90.55
|
PP = $92.83
|
|
MB = $97.47
|
Most Recent Note - 6/13/2011 6:44:00 PM
Down today with slightly higher volume after damaging losses last week violated its 50 DMA line and prior lows triggering technical sell signals. Based on its technical deterioration it will be dropped from the Featured Stocks list tonight
>>> The latest Featured Stock Update with an annotated graph appeared on 6/3/2011. Click here.
View all notes |
Alert me of new notes |
CANSLIM.net Company Profile |
SEC |
Zacks Reports |
StockTalk |
News |
Chart |
Request a new note
C
A N
S L
I M
|
MG
-
NYSE
Mistras Group Inc
DIVERSIFIED SERVICES - Bulding and Faci;ity Management Services
|
$15.97
|
-0.18
-1.11% |
$16.30
|
173,963
111.87% of 50 DAV
50 DAV is 155,500
|
$18.46
-13.49%
|
3/15/2011
|
$15.48
|
PP = $15.90
|
|
MB = $16.70
|
Most Recent Note - 6/10/2011 5:16:01 PM
G - Volume was below average today as it finished the session at its lowest close since completing a Public Offering on 5/05/11. Struggling below its 50 DMA line and that important short-term average acted as resistance.
>>> The latest Featured Stock Update with an annotated graph appeared on 5/12/2011. Click here.
View all notes |
Alert me of new notes |
CANSLIM.net Company Profile |
SEC |
Zacks Reports |
StockTalk |
News |
Chart |
Request a new note
C
A N
S L
I M
|
Symbol/Exchange
Company Name
Industry Group |
PRICE |
CHANGE
(%Change) |
Day High |
Volume
(% DAV)
(% 50 day avg vol) |
52 Wk Hi
% From Hi |
Featured
Date |
Price
Featured |
Pivot Featured |
|
Max Buy |
MWIV
-
NASDAQ
M W I Veterinary Supply
HEALTH SERVICES - Medical Instruments and; Supplies
|
$79.56
|
-0.44
-0.55% |
$80.80
|
43,344
47.47% of 50 DAV
50 DAV is 91,300
|
$86.99
-8.54%
|
11/4/2010
|
$61.79
|
PP = $59.60
|
|
MB = $62.58
|
Most Recent Note - 6/10/2011 5:20:04 PM
G - Pulled back today on above average volume after 3 consecutive gains on lighter volume. Its 50 DMA line acted as resistance. See the latest FSU analysis for more details and a new annotated graph.
>>> The latest Featured Stock Update with an annotated graph appeared on 6/9/2011. Click here.
View all notes |
Alert me of new notes |
CANSLIM.net Company Profile |
SEC |
Zacks Reports |
StockTalk |
News |
Chart |
Request a new note
C
A N
S L
I M
|
OPNT
-
NASDAQ
Opnet Technologies
INTERNET - Internet Software and Services
|
$38.00
|
+0.11
0.29% |
$38.54
|
72,341
55.10% of 50 DAV
50 DAV is 131,300
|
$42.51
-10.61%
|
5/11/2011
|
$41.21
|
PP = $40.50
|
|
MB = $42.53
|
Most Recent Note - 6/10/2011 5:20:52 PM
G - Still consolidating near its 50 DMA line. Subsequent deterioration under recent lows in the $35-36 area would raise greater concerns.
>>> The latest Featured Stock Update with an annotated graph appeared on 6/10/2011. Click here.
View all notes |
Alert me of new notes |
CANSLIM.net Company Profile |
SEC |
Zacks Reports |
StockTalk |
News |
Chart |
Request a new note
C
A N
S L
I M
|
OTEX
-
NASDAQ
Open Text Corp
INTERNET - Internet Software and Services
|
$58.42
|
-0.77
-1.30% |
$59.48
|
236,056
67.41% of 50 DAV
50 DAV is 350,200
|
$67.08
-12.91%
|
6/1/2011
|
$65.86
|
PP = $67.18
|
|
MB = $70.54
|
Most Recent Note - 6/10/2011 5:22:24 PM
G - Down considerably today with above average volume, closing near old highs prior to its 3/29/11 breakout. It faces resistance now due to the overhead supply created while trading at higher levels in recent months. Color code was changed to green based on damaging technical deterioration.
>>> The latest Featured Stock Update with an annotated graph appeared on 6/2/2011. Click here.
View all notes |
Alert me of new notes |
CANSLIM.net Company Profile |
SEC |
Zacks Reports |
StockTalk |
News |
Chart |
Request a new note
C
A N
S L
I M
|
PCLN
-
NASDAQ
Priceline.Com Inc
INTERNET - Internet Software and Services
|
$482.13
|
-11.05
-2.24% |
$497.60
|
1,167,730
111.53% of 50 DAV
50 DAV is 1,047,000
|
$561.88
-14.19%
|
1/3/2011
|
$399.55
|
PP = $428.20
|
|
MB = $449.61
|
Most Recent Note - 6/13/2011 6:11:10 PM
G - Volume today was above average as it slumped below the recently noted chart low ($487.70 on 5/25/11) raising even greater concerns with its technical deterioration.
>>> The latest Featured Stock Update with an annotated graph appeared on 5/19/2011. Click here.
View all notes |
Alert me of new notes |
CANSLIM.net Company Profile |
SEC |
Zacks Reports |
StockTalk |
News |
Chart |
Request a new note
C
A N
S L
I M
|
RAX
-
NYSE
Rackspace Hosting Inc
INTERNET - Internet Software and; Services
|
$40.30
|
-0.28
-0.69% |
$41.19
|
1,316,843
71.99% of 50 DAV
50 DAV is 1,829,300
|
$46.50
-13.32%
|
6/3/2011
|
$43.36
|
PP = $46.59
|
|
MB = $48.92
|
Most Recent Note - 6/10/2011 5:28:30 PM
G - Color code was changed to green based on recent deterioration. A rebound above its 50 DMA line would be an encouraging sign, meanwhile a breach of its recent chart low ($38.84 on 5/12/11) would trigger a more worrisome technical sell signal.
>>> The latest Featured Stock Update with an annotated graph appeared on 5/13/2011. Click here.
View all notes |
Alert me of new notes |
CANSLIM.net Company Profile |
SEC |
Zacks Reports |
StockTalk |
News |
Chart |
Request a new note
C
A N
S L
I M
|
Symbol/Exchange
Company Name
Industry Group |
PRICE |
CHANGE
(%Change) |
Day High |
Volume
(% DAV)
(% 50 day avg vol) |
52 Wk Hi
% From Hi |
Featured
Date |
Price
Featured |
Pivot Featured |
|
Max Buy |
SWI
-
NYSE
Solarwinds Inc
COMPUTER SOFTWARE and SERVICES - Application Software
|
$24.45
|
+0.56
2.34% |
$24.62
|
740,068
129.00% of 50 DAV
50 DAV is 573,700
|
$24.95
-2.00%
|
6/7/2011
|
$24.22
|
PP = $25.05
|
|
MB = $26.30
|
Most Recent Note - 6/13/2011 6:45:39 PM
Y - Gain today with higher volume leaves it perched just -2.0% off its all-time high. Minimal overhead supply remains to hinder its progress. To trigger a buy signal it needs a gain above its pivot point with sufficient volume and a follow-through day to confirm the broader market (M criteria) is favorable.
>>> The latest Featured Stock Update with an annotated graph appeared on 6/8/2011. Click here.
View all notes |
Alert me of new notes |
CANSLIM.net Company Profile |
SEC |
Zacks Reports |
StockTalk |
News |
Chart |
Request a new note
C
A N
S L
I M
|
TIBX
-
NASDAQ
Tibco Software Inc
COMPUTER SOFTWARE and SERVICES - Business Software and Services
|
$24.90
|
-0.61
-2.39% |
$25.78
|
2,749,276
105.45% of 50 DAV
50 DAV is 2,607,200
|
$30.75
-19.02%
|
3/18/2011
|
$23.88
|
PP = $26.04
|
|
MB = $27.34
|
Most Recent Note - 6/13/2011 6:05:34 PM
Down further today on slightly higher volume, slumping under its February-March highs leading to even more technical damage. Based on weak action it will be dropped from the Featured Stocks list tonight.
>>> The latest Featured Stock Update with an annotated graph appeared on 5/18/2011. Click here.
View all notes |
Alert me of new notes |
CANSLIM.net Company Profile |
SEC |
Zacks Reports |
StockTalk |
News |
Chart |
Request a new note
C
A N
S L
I M
|
ULTA
-
NASDAQ
Ulta Salon Cosm & Frag
SPECIALTY RETAIL - Specialty Retail, Other
|
$57.75
|
+1.59
2.83% |
$58.22
|
1,258,733
194.13% of 50 DAV
50 DAV is 648,400
|
$57.25
0.87%
|
1/6/2011
|
$36.12
|
PP = $37.34
|
|
MB = $39.21
|
Most Recent Note - 6/13/2011 12:10:29 PM
G - Hit a new 52-week high and all-time high today, adding to recent volume-driven gains. It has not formed a sound base pattern. The M criteria argues against new buying efforts in stocks until a new confirmed rally with follow-through day from at least one of the major averages.
>>> The latest Featured Stock Update with an annotated graph appeared on 5/26/2011. Click here.
View all notes |
Alert me of new notes |
CANSLIM.net Company Profile |
SEC |
Zacks Reports |
StockTalk |
News |
Chart |
Request a new note
C
A N
S L
I M
|
ZAGG
-
NASDAQ
Zagg Inc
SPECIALTY RETAIL - Specialty Retail, Other
|
$12.28
|
+0.65
5.59% |
$12.50
|
2,671,513
226.00% of 50 DAV
50 DAV is 1,182,100
|
$11.98
2.50%
|
6/1/2011
|
$10.92
|
PP = $10.59
|
|
MB = $11.12
|
Most Recent Note - 6/13/2011 12:19:28 PM
G - Hitting new all-time highs for a 2nd consecutive session with gains backed by above average volume. It is extended from the previously noted cup-with-handle type base pattern. Its recent low ($10.15 on 6/07/11) now defines an important near-term chart support level to watch on pullbacks.
>>> The latest Featured Stock Update with an annotated graph appeared on 6/1/2011. Click here.
View all notes |
Alert me of new notes |
CANSLIM.net Company Profile |
SEC |
Zacks Reports |
StockTalk |
News |
Chart |
Request a new note
C
A N
S L
I M
|