You are not logged in.
This means you
CAN ONLY VIEW reports that were published prior to Friday, April 18, 2025.
You
MUST UPGRADE YOUR MEMBERSHIP if you want to see any current reports.
AFTER MARKET UPDATE - WEDNESDAY, JUNE 12TH, 2024
Previous After Market Report Next After Market Report >>>
|
|
|
|
DOW |
-35.21 |
38,712.21 |
-0.09% |
|
Volume |
922,767,094 |
+7% |
|
Volume |
5,614,690,400 |
+11% |
|
NASDAQ |
+264.89 |
17,608.44 |
+1.53% |
|
Advancers |
1,935 |
70% |
|
Advancers |
2,693 |
63% |
|
S&P 500 |
+45.71 |
5,421.03 |
+0.85% |
|
Decliners |
830 |
30% |
|
Decliners |
1,590 |
37% |
|
Russell 2000 |
+32.75 |
2,057.10 |
+1.62% |
|
52 Wk Highs |
158 |
|
|
52 Wk Highs |
220 |
|
|
S&P 600 |
+21.18 |
1,306.19 |
+1.65% |
|
52 Wk Lows |
30 |
|
|
52 Wk Lows |
91 |
|
|
 |
Nasdaq Composite and S&P 500 Index Rise to New Highs
Kenneth J. Gruneisen - Passed the CAN SLIM® Master's Exam
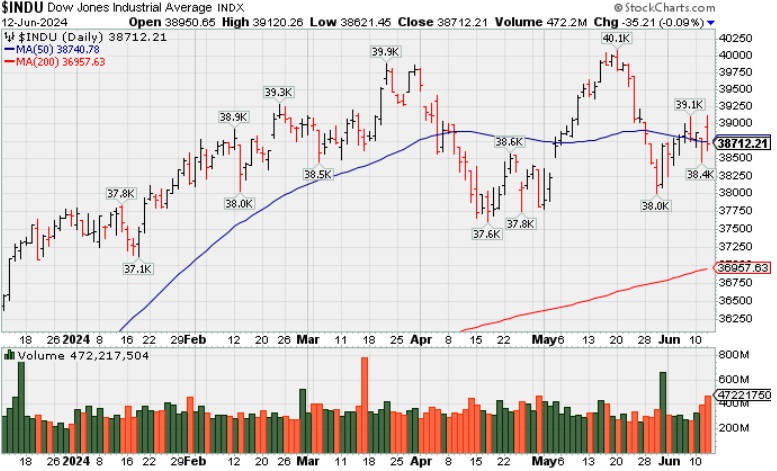
The S&P 500 Index (+0.9%) and Nasdaq Composite Index (+1.5%) rallied further into record territory. The Dow Jones Industrial Average (-0.1%) ended slightly lower. Volume totals reported were higher than the prior session on the NYSE and on the Nasdaq exchange. Market breadth was positive as advancers led decliners by more than a 2-1 margin on the NYSE and by a 5-3 margin on the Nasdaq exchange. There were 66 high-ranked companies from the Leaders List that hit new 52-week highs and were listed on the BreakOuts Page, more than tripling the total of 21 on the prior session. New 52-week highs totals expanded and solidly outnumbered new 52-week lows on the NYSE and on the Nasdaq exchange. The major indices are in a confirmed uptrend (M criteria) that recently endured some pressure. It was encouraging to see improvement in the new highs totals with the market showing some broad-based strength and resilience. Any uptrend requires healthy leadership.
PICTURED: The Dow Jones Industrial Average is consolidating near its 50-day moving average (DMA) line.
The May Consumer Price Index reflected some welcome disinflation on a year-over-year basis in total CPI (actual +3.3%; prior +3.4%) and core CPI (actual +3.4%; prior +3.6%). The FOMC left the target range for the fed funds rate unchanged at 5.25-5.50%, as expected. The Summary of Economic Projections (SEP) showed a median estimate of only one rate cut this year versus three at the time of the March projections. The 10-yr note yield fell 11 basis points to 4.30% and the 2-yr note yield fell eight basis points to 4.75%.
Seven of the 11 S&P 500 sectors rose and information technology logged the biggest gain. Apple (AAPL +2.9%), NVIDIA (NVDA +3.6%), and Microsoft (MSFT +1.9%) were standouts. Oracle (ORCL +13.3%) jumped 13% on quarterly results and guidance.
|
 Kenneth J. Gruneisen started out as a licensed stockbroker in August 1987, a couple of months prior to the historic stock market crash that took the Dow Jones Industrial Average down -22.6% in a single day. He has published daily fact-based fundamental and technical analysis on high-ranked stocks online for two decades. Through FACTBASEDINVESTING.COM, Kenneth provides educational articles, news, market commentary, and other information regarding proven investment systems that work in good times and bad.
Comments contained in the body of this report are technical opinions only and are not necessarily those of Gruneisen Growth Corp. The material herein has been obtained from sources believed to be reliable and accurate, however, its accuracy and completeness cannot be guaranteed. Our firm, employees, and customers may effect transactions, including transactions contrary to any recommendation herein, or have positions in the securities mentioned herein or options with respect thereto. Any recommendation contained in this report may not be suitable for all investors and it is not to be deemed an offer or solicitation on our part with respect to the purchase or sale of any securities. |
|
 |
Financial and Tech Indexes Led Gainers
Kenneth J. Gruneisen - Passed the CAN SLIM® Master's Exam
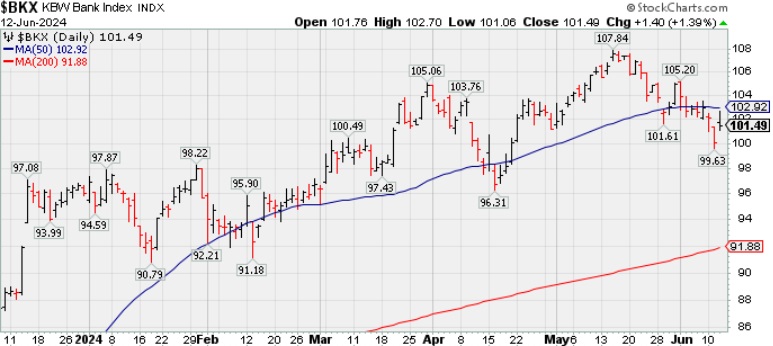
The Broker/Dealer Index ($XBD +0.93%) and the Bank Index ($BKX +1.39%) both ended solidly higher while the Retail Index ($RLX +0.37%) eked out a small gain. The tech sector was led by the Semiconductor Index ($SOX +2.90%) as the Networking Index ($NWX +0.89%) and Biotech Index ($BTK +0.61%) each posted a smaller gain. The Gold & Silver Index ($XAU +0.70%) and the Oil Services Index ($OSX +0.54%) both edged higher while the Integrated Oil Index ($XOI -1.28%) ended lower.
![]() PICTURED: The Bank Index ($BKX +1.39%) rebounded toward its 50-day moving average (DMA) line.
| Oil Services |
$OSX |
83.40 |
+0.45 |
+0.54% |
-0.57% |
| Integrated Oil |
$XOI |
1,994.45 |
-25.96 |
-1.28% |
+7.09% |
| Semiconductor |
$SOX |
5,520.87 |
+155.49 |
+2.90% |
+32.22% |
| Networking |
$NWX |
815.82 |
+7.20 |
+0.89% |
-2.04% |
| Broker/Dealer |
$XBD |
627.48 |
+5.76 |
+0.93% |
+12.59% |
| Retail |
$RLX |
4,477.51 |
+16.41 |
+0.37% |
+15.14% |
| Gold & Silver |
$XAU |
137.67 |
+0.95 |
+0.70% |
+9.53% |
| Bank |
$BKX |
101.49 |
+1.40 |
+1.39% |
+5.69% |
| Biotech |
$BTK |
5,285.77 |
+32.28 |
+0.61% |
-2.45% |
|
|
|
 |
Transdigm Consolidating Above 50-Day Moving Average
Kenneth J. Gruneisen - Passed the CAN SLIM® Master's Exam
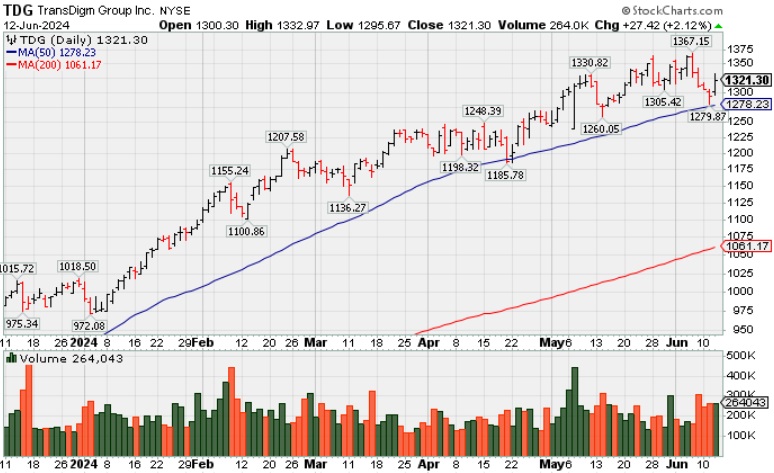
Transdigm Group Inc (TDG +$28.25 or +2.18% to $1,322.13) rose back above its "max buy" level with today's gain and its color code was changed to green. Its 50-day moving average (DMA) line ($1,278) defines important near-term support to watch. Fundamentals remain strong.
TDG was last shown in this FSU section on 5/21/24 with an annotated graph under the headline, "Aerospace/Defense Firm Hitting Another All-Time High". TDG reported Mar '24 quarterly earnings +34% on +21% sales revenues versus the year-ago period, its 12th consecutive comparison above the +25% minimum earnings guideline (C criteria). Growth has been very strong after a downturn in FY '20 and '21 (A criteria) hurt its earnings track record. It has a 92 Earnings Per Share Rating.
The number of top-rated funds owning its shares rose from 1,332 in Dec '22 to 1,580 in Mar '24, a reassuring trend concerning the I criteria. Its small supply of 53.7 million shares (S criteria) in the public float can contribute to greater price volatility in the event of institutional buying or selling. It has a Timeliness Rating of A and an Accumulation/Distribution rating of C-. |
|
|
Color Codes Explained :
Y - Better candidates highlighted by our
staff of experts.
G - Previously featured
in past reports as yellow but may no longer be buyable under the
guidelines.
***Last / Change / Volume data in this table is the closing quote data***
Symbol/Exchange
Company Name
Industry Group |
PRICE |
CHANGE
(%Change) |
Day High |
Volume
(% DAV)
(% 50 day avg vol) |
52 Wk Hi
% From Hi |
Featured
Date |
Price
Featured |
Pivot Featured |
|
Max Buy |
 TDG
-
NYSE
TDG
-
NYSE
TransDigm Group
Aerospace/Defense
|
$1,322.13
|
+28.25
2.18% |
$1,332.97
|
265,250
126.91% of 50 DAV
50 DAV is 209,000
|
$1,369.58
-3.46%
|
4/12/2024
|
$1,224.21
|
PP = $1,246.32
|
|
MB = $1,308.64
|
 Most Recent Note - 6/12/2024 5:29:08 PM
G - Color code is changed to green after rising back above its "max buy" level. Its 50 DMA line ($1,278) defines near-term support to watch. Fundamentals remain strong. See the latest FSU analysis for more details and a new annotated graph.
>>> FEATURED STOCK ARTICLE : Transdigm Consolidating Above 50-Day Moving Average - 6/12/2024 |
View all notes |
Set NEW NOTE alert |
Company Profile |
SEC
News |
Chart |
Request a new note
C
A
S
I |
USLM
-
NASDAQ
U.S. Lime & Minerals
Bldg-Cement/Concrt/Ag
|
$338.75
|
+12.05
3.69% |
$343.75
|
27,338
109.35% of 50 DAV
50 DAV is 25,000
|
$378.78
-10.57%
|
2/9/2024
|
$254.68
|
PP = $265.09
|
|
MB = $278.34
|
Most Recent Note - 6/12/2024 5:31:04 PM
G - Gapped up today for a solid gain with average volume, finding prompt support near its 50 DMA line ($329). It has not formed a sound base. Fundamentals remain strong.
>>> FEATURED STOCK ARTICLE : Streak of Losses Testing 50-Day Moving Average Line - 6/6/2024 |
View all notes |
Set NEW NOTE alert |
Company Profile |
SEC
News |
Chart |
Request a new note
C
A
S
I |
CLS
-
NYSE
Celestica
Elec-Contract Mfg
|
$54.89
|
+1.66
3.12% |
$55.34
|
1,908,128
78.98% of 50 DAV
50 DAV is 2,416,000
|
$61.06
-10.10%
|
5/15/2024
|
$51.52
|
PP = $51.22
|
|
MB = $53.78
|
Most Recent Note - 6/11/2024 5:38:28 PM
G - Pulled back today with lighter than average volume. Prior highs in the $51 area define initial support to watch above its 50 DMA line.
>>> FEATURED STOCK ARTICLE : Steady Pullback to Below "Max Buy" Level Following Rally - 6/4/2024 |
View all notes |
Set NEW NOTE alert |
Company Profile |
SEC
News |
Chart |
Request a new note
C
A
S
I |
DECK
-
NYSE
Deckers Outdoor
Apparel-Shoes and Rel Mfg
|
$1,039.52
|
-2.81
-0.27% |
$1,047.39
|
353,947
98.32% of 50 DAV
50 DAV is 360,000
|
$1,106.89
-6.09%
|
5/24/2024
|
$1,010.60
|
PP = $956.27
|
|
MB = $1,004.08
|
Most Recent Note - 6/11/2024 5:28:55 PM
G - Volume totals have been cooling while stubbornly holding its ground near its all-time high. Prior highs in the $956 area define initial support to watch on pullbacks.
>>> FEATURED STOCK ARTICLE : Big "Breakaway Gap" for Deckers Outdoor - 5/24/2024 |
View all notes |
Set NEW NOTE alert |
Company Profile |
SEC
News |
Chart |
Request a new note
C
A
S
I |
ELF
-
NYSE
e.l.f. Beauty
Cosmetics/Personal Care
|
$197.32
|
+7.74
4.08% |
$202.47
|
1,482,604
86.96% of 50 DAV
50 DAV is 1,705,000
|
$221.83
-11.05%
|
5/24/2024
|
$193.79
|
PP = $182.73
|
|
MB = $191.87
|
Most Recent Note - 6/12/2024 5:32:54 PM
G - Color code is changed to green after a 3rd consecutive solid gain today with average volume, rebounding above its "max buy" level near prior highs. Its 50 DMA line ($171) defines important near-term support to watch.
>>> FEATURED STOCK ARTICLE : Down on Lighter Volume After Breakout From "Double Bottom" Base - 5/29/2024 |
View all notes |
Set NEW NOTE alert |
Company Profile |
SEC
News |
Chart |
Request a new note
C
A
S
I |
Symbol/Exchange
Company Name
Industry Group |
PRICE |
CHANGE
(%Change) |
Day High |
Volume
(% DAV)
(% 50 day avg vol) |
52 Wk Hi
% From Hi |
Featured
Date |
Price
Featured |
Pivot Featured |
|
Max Buy |
PDD
-
NASDAQ
PDD Holdings ADR
Retail-Internet
|
$151.00
|
+4.07
2.77% |
$151.02
|
7,069,257
76.35% of 50 DAV
50 DAV is 9,259,000
|
$164.69
-8.31%
|
5/24/2024
|
$161.85
|
PP = $153.09
|
|
MB = $160.74
|
Most Recent Note - 6/11/2024 5:42:50 PM
Y - Pulled back today with near average volume following 3 gains with below average volume. Raised concerns recently as it negated the breakout after clearing a 20-week base. Disciplined investors avoid big losses by selling any stock that falls more than 7-8% below their purchase price.
>>> FEATURED STOCK ARTICLE : Pulled Back Below Prior Highs Raising Concerns - 5/28/2024 |
View all notes |
Set NEW NOTE alert |
Company Profile |
SEC
News |
Chart |
Request a new note
C
A
S
I |
CRWD
-
NASDAQ
CrowdStrike Holdings
Computer Sftwr-Security
|
$387.37
|
+2.74
0.71% |
$390.71
|
5,811,565
171.99% of 50 DAV
50 DAV is 3,379,000
|
$385.00
0.62%
|
5/28/2024
|
$351.47
|
PP = $365.10
|
|
MB = $383.36
|
Most Recent Note - 6/12/2024 12:34:35 PM
G - Color code is changed to green while hitting new all-time highs with today's 4th consecutive volume-driven gain. Rebounded above its 50 DMA line ($321.76) last week. Bullish action came after it reported Apr '24 quarterly earnings +63% on +33% sales revenues versus the year-ago period, continuing its strong earnings track record. Recent lows define important near-term support to watch on pullbacks.
>>> FEATURED STOCK ARTICLE : Volume-Driven Loss Triggered Technical Sell Signal - 5/30/2024 |
View all notes |
Set NEW NOTE alert |
Company Profile |
SEC
News |
Chart |
Request a new note
C
A
S
I |
NVO
-
NYSE
Novo Nordisk ADR
Medical-Ethical Drugs
|
$143.26
|
+1.47
1.04% |
$144.50
|
3,236,433
85.51% of 50 DAV
50 DAV is 3,785,000
|
$143.94
-0.47%
|
6/7/2024
|
$143.06
|
PP = $138.38
|
|
MB = $145.30
|
Most Recent Note - 6/11/2024 12:20:46 PM
Y - Pausing today after 8 consecutive gains while wedging to new all-time highs. Color code was changed to yellow with pivot point cited based on its 3/07/24 high. To clinch a proper technical buy signal gains above the pivot point must be backed by at least +40% above-average volume. Fundamentals remain strong.
>>> FEATURED STOCK ARTICLE : Wedging Into New High Ground - 6/7/2024 |
View all notes |
Set NEW NOTE alert |
Company Profile |
SEC
News |
Chart |
Request a new note
C
A
S
I |
GVA
-
NYSE
Granite Construction
Bldg-Heavy Construction
|
$62.44
|
+2.59
4.33% |
$63.06
|
664,834
156.06% of 50 DAV
50 DAV is 426,000
|
$64.33
-2.94%
|
6/11/2024
|
$59.76
|
PP = $64.33
|
|
MB = $67.55
|
Most Recent Note - 6/12/2024 5:34:03 PM
Y - Gapped up today for a 3rd consecutive volume-driven gain. Color code was changed to yellow when highlighted on the earlier mid-day report as it was noted that a valid secondary buy point exists up to +5% above the recent high after finding support at its 10 WMA line following a prior breakout. Reported improved earnings in the Jun, Sep, Dec '23, and Mar '24 quarters versus the year ago periods. Annual earnings growth has been strong and steady. See the latest FSU analysis for more details and an annotated graph.
>>> FEATURED STOCK ARTICLE : Granite Construction Found Support at 10-Week Moving Average - 6/11/2024 |
View all notes |
Set NEW NOTE alert |
Company Profile |
SEC
News |
Chart |
Request a new note
C
A
S
I |
|
|
|
THESE ARE NOT BUY RECOMMENDATIONS!
Comments contained in the body of this report are technical
opinions only. The material herein has been obtained
from sources believed to be reliable and accurate, however,
its accuracy and completeness cannot be guaranteed.
This site is not an investment advisor, hence it does
not endorse or recommend any securities or other investments.
Any recommendation contained in this report may not
be suitable for all investors and it is not to be deemed
an offer or solicitation on our part with respect to
the purchase or sale of any securities. All trademarks,
service marks and trade names appearing in this report
are the property of their respective owners, and are
likewise used for identification purposes only.
This report is a service available
only to active Paid Premium Members.
You may opt-out of receiving report notifications
at any time. Questions or comments may be submitted
by writing to Premium Membership Services 665 S.E. 10 Street, Suite 201 Deerfield Beach, FL 33441-5634 or by calling 1-800-965-8307
or 954-785-1121.
|
|
|