You are not logged in.
This means you
CAN ONLY VIEW reports that were published prior to Tuesday, April 8, 2025.
You
MUST UPGRADE YOUR MEMBERSHIP if you want to see any current reports.
AFTER MARKET UPDATE - THURSDAY, JUNE 6TH, 2024
Previous After Market Report Next After Market Report >>>
|
|
|
|
DOW |
+78.84 |
38,886.17 |
+0.20% |
|
Volume |
829,016,195 |
-3% |
|
Volume |
5,164,037,300 |
-4% |
|
NASDAQ |
-14.78 |
17,173.12 |
-0.09% |
|
Advancers |
1,289 |
47% |
|
Advancers |
1,712 |
41% |
|
S&P 500 |
-1.07 |
5,352.96 |
-0.02% |
|
Decliners |
1,452 |
53% |
|
Decliners |
2,474 |
59% |
|
Russell 2000 |
-14.43 |
2,049.44 |
-0.70% |
|
52 Wk Highs |
90 |
|
|
52 Wk Highs |
123 |
|
|
S&P 600 |
-8.44 |
1,310.90 |
-0.64% |
|
52 Wk Lows |
30 |
|
|
52 Wk Lows |
124 |
|
|
 |
Major Indices Were Mixed and Little Changed
Kenneth J. Gruneisen - Passed the CAN SLIM® Master's Exam
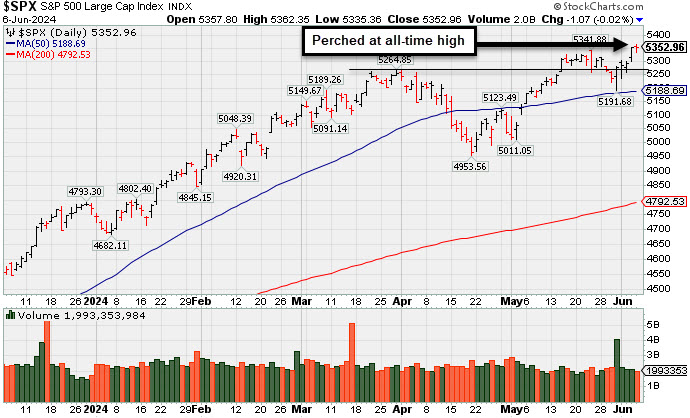
The major indices ended mixed and little changed on Thursday. Volume totals reported were slightly lower than the prior session on the NYSE and on the Nasdaq exchange. Breadth was slightly negative as decliners led advancer by a narrow margin on the NYSE and by a 4-3 margin on the Nasdaq exchange. There were 38 high-ranked companies from the Leaders List that hit new 52-week highs and were listed on the BreakOuts Page matching the total of 38 on the prior session. New 52-week high outnumbered new 52-week lows on the NYSE while totals were evenly matched on the Nasdaq exchange. The major indices are in a confirmed uptrend (M criteria) that recently endured some pressure. Disciplined investors will watch for encouraging new highs totals to see the market showing some broad-based strength and resiience. Any uptrend requires healthy leadership.
PICTURED: The Dow Jones Industrial Average has rebounded to its 50-day moving average (DMA) line.
A mixed batch of economic data included higher-than-expected initial jobless claims, a soothing downward revision to Q1 unit labor costs, and a widening in the April trade deficit. The market appeared indecisive ahead of Friday's release of the May Employment Report.
Lululemon athletica (LULU +4.8%) and J.M. Smucker (SJM +4.6%) were sold gainers following solid earnings and/or guidance, and as top performing components in their respective sectors, they boosted the consumer discretionary sector +1.0% and the consumer staples sector +0.4%. There was slight weakness in the information technology sector (-0.5%).
The 10-yr note yield settle one basis point lower at 4.28% and the 2-yr note yield fell one basis point to 4.72%.
|
 Kenneth J. Gruneisen started out as a licensed stockbroker in August 1987, a couple of months prior to the historic stock market crash that took the Dow Jones Industrial Average down -22.6% in a single day. He has published daily fact-based fundamental and technical analysis on high-ranked stocks online for two decades. Through FACTBASEDINVESTING.COM, Kenneth provides educational articles, news, market commentary, and other information regarding proven investment systems that work in good times and bad.
Comments contained in the body of this report are technical opinions only and are not necessarily those of Gruneisen Growth Corp. The material herein has been obtained from sources believed to be reliable and accurate, however, its accuracy and completeness cannot be guaranteed. Our firm, employees, and customers may effect transactions, including transactions contrary to any recommendation herein, or have positions in the securities mentioned herein or options with respect thereto. Any recommendation contained in this report may not be suitable for all investors and it is not to be deemed an offer or solicitation on our part with respect to the purchase or sale of any securities. |
|
 |
Retail and Gold & Silver Indexes Led Gainers
Kenneth J. Gruneisen - Passed the CAN SLIM® Master's Exam
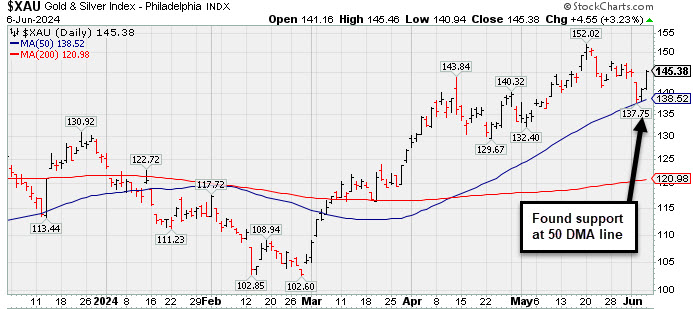
The Retail Index ($RLX +1.28%) outpaced the Broker/Dealer Index ($XBD +0.33%) while the Bank Index ($BKX -0.26%) edged lower. The tech sector was mixed as the Semiconductor Index ($SOX -0.86%) slumped while the Networking Index ($NWX +0.10%) and the Biotech Index ($BTK +0.15%) both inched higher for minimal gains. Energy-linked groups had a slightly positive bias as the Oil Services ($OSX +0.52%) and the Integrated Oil Index ($XOI +0.71%) both edged higher.
![]() PICTURED: The Gold & Silver Index ($XAU +3.23%) posted a solid gain, finding prompt support at its 50-day moving average (DMA) line.
| Oil Services |
$OSX |
80.05 |
-0.04 |
-0.05% |
-4.57% |
| Integrated Oil |
$XOI |
2,021.82 |
+14.10 |
+0.70% |
+8.56% |
| Semiconductor |
$SOX |
5,298.44 |
-49.01 |
-0.92% |
+26.89% |
| Networking |
$NWX |
826.07 |
+6.81 |
+0.83% |
-0.81% |
| Broker/Dealer |
$XBD |
630.93 |
+2.72 |
+0.43% |
+13.21% |
| Retail |
$RLX |
4,360.23 |
+42.96 |
+1.00% |
+12.12% |
| Gold & Silver |
$XAU |
145.19 |
+4.36 |
+3.09% |
+15.51% |
| Bank |
$BKX |
102.83 |
-0.05 |
-0.05% |
+7.09% |
| Biotech |
$BTK |
5,304.94 |
+19.30 |
+0.37% |
-2.10% |
|
|
|
 |
Streak of Losses Testing 50-Day Moving Average Line
Kenneth J. Gruneisen - Passed the CAN SLIM® Master's Exam
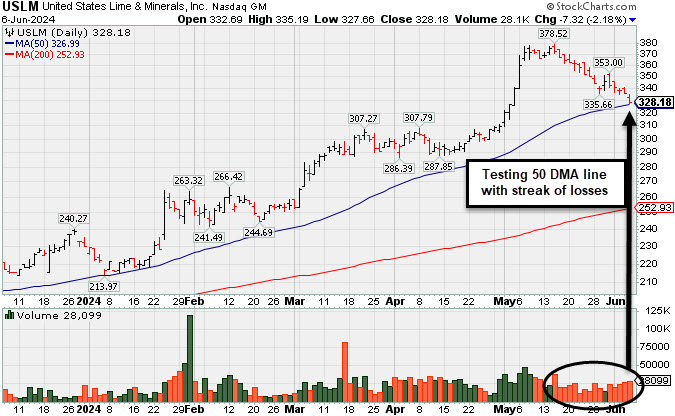
U.S. Lime & Minerals (USLM -$7.36 -or 2.19% to $328.14) ended near the session low as it fell for a 15th loss in the span of 16 sessions, testing its 50-day moving average (DMA) line ($327) which defines important near-term support to watch. More damaging losses would raise concerns and trigger a technical sell signal.
Fundamentals remain strong. USLM reported Mar '24 quarterly earnings +31% on +7% sales revenues versus the year-ago period. USLM has a highest possible Earnings Per Share Rating of 99. Prior quarterly and annual earnings (C and A criteria) history has been strong, a good match with the fact-based investment system's guidelines. The thinly traded firm has only 5.7 million shares outstanding (S criteria), which can contribute to greater price volatility in the event of institutional buying or selling.
USLM was highlighted in yellow in the 2/09/24 mid-day report (read here). It was last shown in this FSU section on 5/14/24 with an annotated graph under the headline, "Stubbornly Held Ground and Posted Quiet Gain for Best-Ever Close". The number of top-rated funds owning its shares rose from 192 in Mar '23 to 230 in Mar '24, a reassuring sign concerning the I criteria. Its current Up/Down Volume Ratio of 0.9 is an unbiased indication its shares have been under slight distributional pressure over the past 50 days. |
|
|
Color Codes Explained :
Y - Better candidates highlighted by our
staff of experts.
G - Previously featured
in past reports as yellow but may no longer be buyable under the
guidelines.
***Last / Change / Volume data in this table is the closing quote data***
Symbol/Exchange
Company Name
Industry Group |
PRICE |
CHANGE
(%Change) |
Day High |
Volume
(% DAV)
(% 50 day avg vol) |
52 Wk Hi
% From Hi |
Featured
Date |
Price
Featured |
Pivot Featured |
|
Max Buy |
 TDG
-
NYSE
TDG
-
NYSE
TransDigm Group
Aerospace/Defense
|
$1,334.65
|
-27.65
-2.03% |
$1,369.58
|
161,781
80.49% of 50 DAV
50 DAV is 201,000
|
$1,364.22
-2.17%
|
4/12/2024
|
$1,224.21
|
PP = $1,246.32
|
|
MB = $1,308.64
|
 Most Recent Note - 6/6/2024 3:52:40 PM
G - Touched a new all-time high today but again made a "negative reversal". It is extended from any sound base and its 50 DMA line ($1,271) defines near-term support to watch on pullbacks. Fundamentals remain strong.
>>> FEATURED STOCK ARTICLE : Aerospace/Defense Firm Hitting Another All-Time High - 5/21/2024 |
View all notes |
Set NEW NOTE alert |
Company Profile |
SEC
News |
Chart |
Request a new note
C
A
S
I |
USLM
-
NASDAQ
U.S. Lime & Minerals
Bldg-Cement/Concrt/Ag
|
$328.18
|
-7.32
-2.18% |
$335.19
|
28,123
112.49% of 50 DAV
50 DAV is 25,000
|
$378.78
-13.36%
|
2/9/2024
|
$254.68
|
PP = $265.09
|
|
MB = $278.34
|
Most Recent Note - 6/6/2024 9:50:42 PM
G - Suffered a 15th loss in the span of 16 sessions and testing its 50 DMA line ($327) which defines important near-term support to watch. More damaging losses would raise concerns and trigger a technical sell signal. Fundamentals remain strong. See the latest FSU analysis for more details and a new annotated graph.
>>> FEATURED STOCK ARTICLE : Streak of Losses Testing 50-Day Moving Average Line - 6/6/2024 |
View all notes |
Set NEW NOTE alert |
Company Profile |
SEC
News |
Chart |
Request a new note
C
A
S
I |
CLS
-
NYSE
Celestica
Elec-Contract Mfg
|
$52.49
|
-3.88
-6.88% |
$56.43
|
2,139,660
91.36% of 50 DAV
50 DAV is 2,342,000
|
$61.06
-14.04%
|
5/15/2024
|
$51.52
|
PP = $51.22
|
|
MB = $53.78
|
Most Recent Note - 6/6/2024 3:49:10 PM
G - Negating most of the prior gain with today's big loss raising concerns. Prior highs in the $51 area define initial support to watch above its 50 DMA line.
>>> FEATURED STOCK ARTICLE : Steady Pullback to Below "Max Buy" Level Following Rally - 6/4/2024 |
View all notes |
Set NEW NOTE alert |
Company Profile |
SEC
News |
Chart |
Request a new note
C
A
S
I |
AROC
-
NYSE
Archrock
OilandGas-Machinery/Equip
|
$18.87
|
-0.28
-1.46% |
$19.12
|
1,001,058
66.78% of 50 DAV
50 DAV is 1,499,000
|
$21.61
-12.68%
|
5/20/2024
|
$21.23
|
PP = $21.50
|
|
MB = $22.58
|
Most Recent Note - 6/6/2024 3:55:32 PM
Still lingering well below its 50 DMA line ($20) and below prior lows in the $19 area. A rebound above the 50 DMA line is needed to help its outlook improve. It will be dropped from the Featured Stocks list tonight.
>>> FEATURED STOCK ARTICLE : Slump Below 50-Day Moving Average Again Hurts Outlook - 6/3/2024 |
View all notes |
Set NEW NOTE alert |
Company Profile |
SEC
News |
Chart |
Request a new note
C
A
S
I |
DECK
-
NYSE
Deckers Outdoor
Apparel-Shoes and Rel Mfg
|
$1,065.43
|
-27.83
-2.55% |
$1,101.77
|
254,563
69.55% of 50 DAV
50 DAV is 366,000
|
$1,106.89
-3.75%
|
5/24/2024
|
$1,010.60
|
PP = $956.27
|
|
MB = $1,004.08
|
Most Recent Note - 6/6/2024 3:50:43 PM
G - Pulling back today with lighter volume. It has been stubbornly holding its ground near its all-time high following noted volume-driven gains, extended from prior highs in the $956 area that define initial support to watch on pullbacks.
>>> FEATURED STOCK ARTICLE : Big "Breakaway Gap" for Deckers Outdoor - 5/24/2024 |
View all notes |
Set NEW NOTE alert |
Company Profile |
SEC
News |
Chart |
Request a new note
C
A
S
I |
Symbol/Exchange
Company Name
Industry Group |
PRICE |
CHANGE
(%Change) |
Day High |
Volume
(% DAV)
(% 50 day avg vol) |
52 Wk Hi
% From Hi |
Featured
Date |
Price
Featured |
Pivot Featured |
|
Max Buy |
ELF
-
NYSE
e.l.f. Beauty
Cosmetics/Personal Care
|
$183.51
|
-1.22
-0.66% |
$187.34
|
1,021,813
59.97% of 50 DAV
50 DAV is 1,704,000
|
$221.83
-17.27%
|
5/24/2024
|
$193.79
|
PP = $182.73
|
|
MB = $191.87
|
Most Recent Note - 6/5/2024 5:02:05 PM
Y - Pulled back again today with below-average volume, quietly consolidating below its "max buy" level after breaking out a "double-bottom" base. Prior low ($177.99 pn 5/31/24) and 50 DMA line ($172) define important near-term support to watch.
>>> FEATURED STOCK ARTICLE : Down on Lighter Volume After Breakout From "Double Bottom" Base - 5/29/2024 |
View all notes |
Set NEW NOTE alert |
Company Profile |
SEC
News |
Chart |
Request a new note
C
A
S
I |
PDD
-
NASDAQ
PDD Holdings ADR
Retail-Internet
|
$143.83
|
+1.03
0.72% |
$144.68
|
6,998,077
74.90% of 50 DAV
50 DAV is 9,343,000
|
$164.69
-12.67%
|
5/24/2024
|
$161.85
|
PP = $153.09
|
|
MB = $160.74
|
Most Recent Note - 6/5/2024 12:33:07 PM
Y - Slumping further below prior highs with today's 4th consecutive loss raising concerns as it negated the breakout after rallying to new 52-week highs with 3 consecutive volume-driven gains clearing a 20-week base. Disciplined investors avoid big losses by selling any stock that falls more than 7-8% below their purchase price.
>>> FEATURED STOCK ARTICLE : Pulled Back Below Prior Highs Raising Concerns - 5/28/2024 |
View all notes |
Set NEW NOTE alert |
Company Profile |
SEC
News |
Chart |
Request a new note
C
A
S
I |
CRWD
-
NASDAQ
CrowdStrike Holdings
Computer Sftwr-Security
|
$340.49
|
-1.69
-0.49% |
$349.34
|
4,683,531
160.18% of 50 DAV
50 DAV is 2,924,000
|
$365.00
-6.72%
|
5/28/2024
|
$351.47
|
PP = $365.10
|
|
MB = $383.36
|
Most Recent Note - 6/6/2024 12:14:27 PM
Y - Up again today following a big volume-driven gain on the prior session rebounding above its 50 DMA line ($317). Bullish action came after it reported Apr '24 quarterly earnings +63% on +33% sales revenues versus the year-ago period, continuing its strong earnings track record. Recent lows define important near-term support to watch on pullbacks.
>>> FEATURED STOCK ARTICLE : Volume-Driven Loss Triggered Technical Sell Signal - 5/30/2024 |
View all notes |
Set NEW NOTE alert |
Company Profile |
SEC
News |
Chart |
Request a new note
C
A
S
I |
|
|
|
THESE ARE NOT BUY RECOMMENDATIONS!
Comments contained in the body of this report are technical
opinions only. The material herein has been obtained
from sources believed to be reliable and accurate, however,
its accuracy and completeness cannot be guaranteed.
This site is not an investment advisor, hence it does
not endorse or recommend any securities or other investments.
Any recommendation contained in this report may not
be suitable for all investors and it is not to be deemed
an offer or solicitation on our part with respect to
the purchase or sale of any securities. All trademarks,
service marks and trade names appearing in this report
are the property of their respective owners, and are
likewise used for identification purposes only.
This report is a service available
only to active Paid Premium Members.
You may opt-out of receiving report notifications
at any time. Questions or comments may be submitted
by writing to Premium Membership Services 665 S.E. 10 Street, Suite 201 Deerfield Beach, FL 33441-5634 or by calling 1-800-965-8307
or 954-785-1121.
|
|
|