You are not logged in.
This means you
CAN ONLY VIEW reports that were published prior to Tuesday, April 8, 2025.
You
MUST UPGRADE YOUR MEMBERSHIP if you want to see any current reports.
AFTER MARKET UPDATE - FRIDAY, JUNE 3RD, 2022
Previous After Market Report Next After Market Report >>>
|
|
|
|
DOW |
-348.58 |
32,899.70 |
-1.05% |
|
Volume |
786,792,477 |
-13% |
|
Volume |
4,098,302,900 |
-7% |
|
NASDAQ |
-304.16 |
12,012.73 |
-2.47% |
|
Advancers |
867 |
28% |
|
Advancers |
1,677 |
38% |
|
S&P 500 |
-68.28 |
4,108.54 |
-1.63% |
|
Decliners |
2,220 |
72% |
|
Decliners |
2,684 |
62% |
|
Russell 2000 |
-14.62 |
1,883.05 |
-0.77% |
|
52 Wk Highs |
50 |
|
|
52 Wk Highs |
37 |
|
|
S&P 600 |
-11.47 |
1,243.51 |
-0.91% |
|
52 Wk Lows |
25 |
|
|
52 Wk Lows |
136 |
|
|
Lower volume on the NYSE and Nasdaq exchange suggested that the latest solid gains for the major indices were not the result of increasing institutional buying demand. The market remains in a correction (M criteria), as arguably the rally still needs a solid confirmation. An opportunity for a valid follow-through day remains open unless the recent lows or May 20th lows are violated.
|
 |
Major Indices Fell With Lighter Volume Totals
Kenneth J. Gruneisen - Passed the CAN SLIM® Master's Exam
The Dow slid 348 points, posting a 0.9% weekly drop. The S&P 500 declined 1.6%, while the Nasdaq Composite shed 2.5%. Both benchmarks turned negative for the week, falling 1.2% and 1%, respectively. Volume totals for Friday were reported lighter than the prior session on the NYSE and on the Nasdaq exchange. Breadth was negative as decliners led advancers by an 11-4 margin on the NYSE and almost 3-2 on the Nasdaq exchange. There were 31 high-ranked companies from the Leaders List that hit new 52-week highs and were listed on the BreakOuts Page, versus the total of 32 on the prior session. New 52-week highs outnumbered new 52-week lows on the NYSE, but new lows still outnumbered new 52-week highs on the Nasdaq exchange. The major indices have been in a noted market correction (M criteria). Sources at the newspaper, following last Thursday's session, relabeled it a "confirmed uptrend" despite flaws noted in our ongoing market commentaries. Followers of the fact-based investment system know to watch for a follow-through day backed by higher volume which could signal a new confirmed uptrend.
Chart courtesy of www.stockcharts.com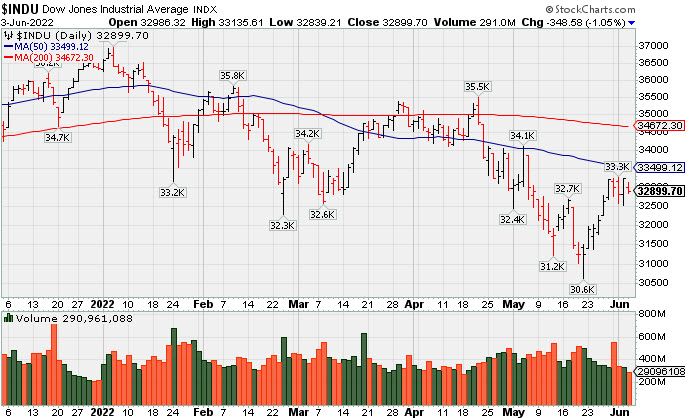 PICTURED: The Dow Jones Industrial Average ended lower on Friday with lighter volume. The 3 major indexes cannot be said to be in "healthy" technical shape while all of them are sputtering well below both their 50-day and 200-day moving average (DMA) lines.
Regular readers of this commentary know to be watching closely for signs of truly increasing institutional buying demand. Arguably, the rally still needs confirmation, and an opportunity for a valid follow-through day remains open unless the recent lows or May 20th lows are violated.
U.S. stocks ended firmly lower on Friday as a solid monthly jobs report heightened expectations that the Federal Reserve (Fed) would continue to aggressively tighten monetary policy in a bid to combat inflation. On the data front, the Department of Labor showed nonfarm payrolls climbed a better-than-expected 390,000 in May, easing from April’s upwardly revised 436,000 addition. The unemployment rate held steady at 3.6% for a third straight month. Average hourly earnings climbed 5.2% year-over-year, moderating from April’s 5.5% annual uptick. Elsewhere, the Institute for Supply Management (ISM) revealed growth in the U.S. services sector eased last month, with the purchasing managers’ index (PMI) declining to 55.9 from the prior 57.1 print. Treasuries weakened, with the yield on the 10-year note adding three basis points (0.03%) to 2.94%, settling the week 0.20% higher.
Ten of 11 S&P 500 sectors finished in negative territory, with Energy the lone advancer. Consumer Discretionary stocks lagged amid a drop in Tesla Inc. (TSLA -9.22%) after its CEO provided a gloomy economic outlook and said the electric car maker needs to reduce 10% of its workforce. Information Technology also underperformed, with Micron Technology Inc (MU -7.20%) down after being the subject of an analyst downgrade. In other corporate news, Turning Point Therapeutics Inc. (TPTX +118.35%) gapped higher after Bristol Myers Squibb Co. (BMY +0.13%) said it would pay $76 a share to acquire the biotech company known for developing lung cancer treatments.
|
 Kenneth J. Gruneisen started out as a licensed stockbroker in August 1987, a couple of months prior to the historic stock market crash that took the Dow Jones Industrial Average down -22.6% in a single day. He has published daily fact-based fundamental and technical analysis on high-ranked stocks online for two decades. Through FACTBASEDINVESTING.COM, Kenneth provides educational articles, news, market commentary, and other information regarding proven investment systems that work in good times and bad.
Comments contained in the body of this report are technical opinions only and are not necessarily those of Gruneisen Growth Corp. The material herein has been obtained from sources believed to be reliable and accurate, however, its accuracy and completeness cannot be guaranteed. Our firm, employees, and customers may effect transactions, including transactions contrary to any recommendation herein, or have positions in the securities mentioned herein or options with respect thereto. Any recommendation contained in this report may not be suitable for all investors and it is not to be deemed an offer or solicitation on our part with respect to the purchase or sale of any securities. |
|
 |
Energy-Linked Groups Posted Standout Gains
Kenneth J. Gruneisen - Passed the CAN SLIM® Master's Exam
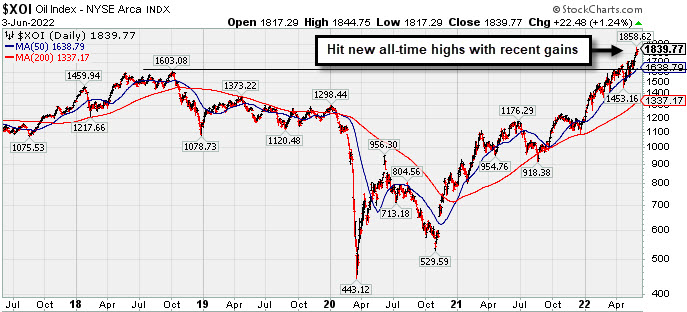
The Retail Index ($RLX -1.63%) lost ground and created a drag on the major indices along with weakness in the Broker/Dealer Index ($XBD -2.28%) and the Bank Index ($BKX -1.41%). Commodity-linked groups were mixed as the Gold & Silver Index ($XAU -2.34%) slumped, meanwhile, the Oil Services Index ($OSX +2.27%) and Integrated Oil Index ($XOI +1.24%) both posted gains. The Semiconductor Index ($SOX -3.02%) led the tech sector lower while the Networking Index ($NWX -1.72%) also fell and the Biotech Index ($BTK +0.09%) finished flat.
PICTURED: The 5-year graph of the Integrated Oil Index ($XOI +1.24%) shows it hitting new all-time highs with recent gains.
| Oil Services |
$OSX |
84.80 |
+1.89 |
+2.27% |
+60.86% |
| Integrated Oil |
$XOI |
1,839.77 |
+22.48 |
+1.24% |
+56.15% |
| Semiconductor |
$SOX |
3,062.59 |
-95.40 |
-3.02% |
-22.39% |
| Networking |
$NWX |
755.94 |
-13.20 |
-1.72% |
-22.15% |
| Broker/Dealer |
$XBD |
413.58 |
-9.66 |
-2.28% |
-15.05% |
| Retail |
$RLX |
3,182.25 |
-52.83 |
-1.63% |
-24.71% |
| Gold & Silver |
$XAU |
133.59 |
-3.19 |
-2.34% |
+0.86% |
| Bank |
$BKX |
114.33 |
-1.64 |
-1.41% |
-13.53% |
| Biotech |
$BTK |
4,609.17 |
+4.05 |
+0.09% |
-16.48% |
|
|
|
 |
Featured Stocks
Kenneth J. Gruneisen - Passed the CAN SLIM® Master's Exam
|
|
|
Color Codes Explained :
Y - Better candidates highlighted by our
staff of experts.
G - Previously featured
in past reports as yellow but may no longer be buyable under the
guidelines.
***Last / Change / Volume data in this table is the closing quote data***
Symbol/Exchange
Company Name
Industry Group |
PRICE |
CHANGE
(%Change) |
Day High |
Volume
(% DAV)
(% 50 day avg vol) |
52 Wk Hi
% From Hi |
Featured
Date |
Price
Featured |
Pivot Featured |
|
Max Buy |
 CI
-
NYSE
CI
-
NYSE
Cigna Corp
Medical-Managed Care
|
$253.97
|
-9.46
-3.59% |
$263.31
|
2,331,231
155.83% of 50 DAV
50 DAV is 1,496,000
|
$273.58
-7.17%
|
5/6/2022
|
$263.52
|
PP = $269.97
|
|
MB = $283.47
|
 Most Recent Note - 6/3/2022 5:17:33 PM
G - Color code is changed to green after it pulled back for a 4th consecutive loss with higher volume today and violated its 50 DMA line ($256) triggering a technical sell signal. A prompt rebound above the 50 DMA line is needed for its outlook to improve. Fundamentals remain strong.
>>> FEATURED STOCK ARTICLE : Consolidating Above 50-Day Moving Average Near All-Time High - 5/25/2022 |
View all notes |
Set NEW NOTE alert |
Company Profile |
SEC
News |
Chart |
Request a new note
C
A
S
I |
PAG
-
NYSE
Penske Automotive Grp
Retail/Whlsle-Automobile
|
$117.20
|
+0.29
0.25% |
$117.31
|
301,185
87.30% of 50 DAV
50 DAV is 345,000
|
$119.47
-1.90%
|
5/13/2022
|
$114.88
|
PP = $114.57
|
|
MB = $120.30
|
Most Recent Note - 6/3/2022 5:19:41 PM
Y - Posted a 3rd consecutive small gain today with lighter than average volume. No overhead supply remains to act as resistance. Rebounded back above the previously cited pivot point following a recent pullback. Its 50 DMA line ($104.78) defines important near term support to watch. See the latest FSU analysis for more details and an annotated graph.
>>> FEATURED STOCK ARTICLE : Penske Perched at High With No Resistance Remaining - 6/2/2022 |
View all notes |
Set NEW NOTE alert |
Company Profile |
SEC
News |
Chart |
Request a new note
C
A
S
I |
LLY
-
NYSE
Eli Lilly & Co
Medical-Diversified
|
$301.65
|
-0.78
-0.26% |
$305.81
|
2,487,582
83.53% of 50 DAV
50 DAV is 2,978,000
|
$324.08
-6.92%
|
5/16/2022
|
$302.46
|
PP = $314.10
|
|
MB = $329.81
|
Most Recent Note - 6/3/2022 5:18:39 PM
Y - Pulled back with lighter than average volume today for a 4th consecutive loss. Its 50 DMA line ($296.52) defines important near-term support to watch. Pivot point cited was based on its 4/07/22 high plus 10 cents. Subsequent gains above the pivot point backed by at least +40% above average volume may trigger a convincing technical buy signal. Fundamentals remain strong.
>>> FEATURED STOCK ARTICLE : Eli Lilly & Co Challenges All-Time High - 5/16/2022 |
View all notes |
Set NEW NOTE alert |
Company Profile |
SEC
News |
Chart |
Request a new note
C
A
S
I |
WCC
-
NYSE
Wesco International Inc
WHOLESALE - Electronics Wholesale
|
$138.62
|
+2.16
1.58% |
$138.92
|
492,584
104.36% of 50 DAV
50 DAV is 472,000
|
$144.43
-4.02%
|
6/1/2022
|
$128.79
|
PP = $139.10
|
|
MB = $146.06
|
Most Recent Note - 6/3/2022 5:20:22 PM
Y - Posted a 3rd consecutive gain today with near average volume. Highlighted again in yellow in the 6/01/22 mid-day report after rebounding above its 50 and 200 DMA lines. The gain backed by great volume helped its outlook improve. Subsequent gains for a new high close backed by at least +40% above average volume may indicate fresh institutional buying demand. Fundamentals remain strong after it reported Mar '22 quarterly earnings +154% on +22% sales revenues versus the year ago period. See the latest FSU analysis for more details and an annotated graph.
>>> FEATURED STOCK ARTICLE : Big Volume-Driven Gain Helped Technical Stance Improve - 6/1/2022 |
View all notes |
Set NEW NOTE alert |
Company Profile |
SEC
News |
Chart |
Request a new note
C
A
S
I |
|
|
|
THESE ARE NOT BUY RECOMMENDATIONS!
Comments contained in the body of this report are technical
opinions only. The material herein has been obtained
from sources believed to be reliable and accurate, however,
its accuracy and completeness cannot be guaranteed.
This site is not an investment advisor, hence it does
not endorse or recommend any securities or other investments.
Any recommendation contained in this report may not
be suitable for all investors and it is not to be deemed
an offer or solicitation on our part with respect to
the purchase or sale of any securities. All trademarks,
service marks and trade names appearing in this report
are the property of their respective owners, and are
likewise used for identification purposes only.
This report is a service available
only to active Paid Premium Members.
You may opt-out of receiving report notifications
at any time. Questions or comments may be submitted
by writing to Premium Membership Services 665 S.E. 10 Street, Suite 201 Deerfield Beach, FL 33441-5634 or by calling 1-800-965-8307
or 954-785-1121.
|
|
|