You are not logged in.
This means you
CAN ONLY VIEW reports that were published prior to Tuesday, April 8, 2025.
You
MUST UPGRADE YOUR MEMBERSHIP if you want to see any current reports.
AFTER MARKET UPDATE - THURSDAY, MAY 30TH, 2019
Previous After Market Report Next After Market Report >>>
|
|
|
|
DOW |
+43.47 |
25,169.88 |
+0.17% |
|
Volume |
700,236,750 |
-15% |
|
Volume |
1,858,367,856 |
-18% |
|
NASDAQ |
+20.41 |
7,567.72 |
+0.27% |
|
Advancers |
1,560 |
53% |
|
Advancers |
1,511 |
49% |
|
S&P 500 |
+5.84 |
2,788.86 |
+0.21% |
|
Decliners |
1,395 |
47% |
|
Decliners |
1,560 |
51% |
|
Russell 2000 |
-4.42 |
1,485.53 |
-0.30% |
|
52 Wk Highs |
60 |
|
|
52 Wk Highs |
59 |
|
|
S&P 600 |
-2.77 |
901.32 |
-0.31% |
|
52 Wk Lows |
122 |
|
|
52 Wk Lows |
141 |
|
|
 |
Major Indices Lacked Leadership While Volume Totals Were Light
Kenneth J. Gruneisen - Passed the CAN SLIM® Master's Exam
Stocks finished slightly higher Thursday, as investors continue to await further trade updates. The Dow added 43 points, while the S&P 500 gained 0.2%. The Nasdaq Composite climbed 0.3%. The volume totals reported were lighter on the NYSE and on the Nasdaq exchange, revealing less conviction behind institutional buying. Advancers narrowly outnumbered decliners on the NYSE while decliners barely outnumbered advancers on the Nasdaq exchange. Leadership remained thin as only 7 high-ranked companies from the Leaders List hit new 52-week highs and were listed on the BreakOuts Page, versus the total of 5 on the prior session. New 52-week lows outnumbered shrinking new 52-week highs totals on the NYSE and on the Nasdaq exchange. The major indices (M criteria) are showing action indicative of a more worrisome "market correction". The fact-based investment system discourages any new buying efforts and suggests selling stocks on a case-by-case basis, raising cash levels to reduce market exposure. The Featured Stocks Page provides the most timely analysis on high-ranked leaders. Charts used courtesy of www.stockcharts.com
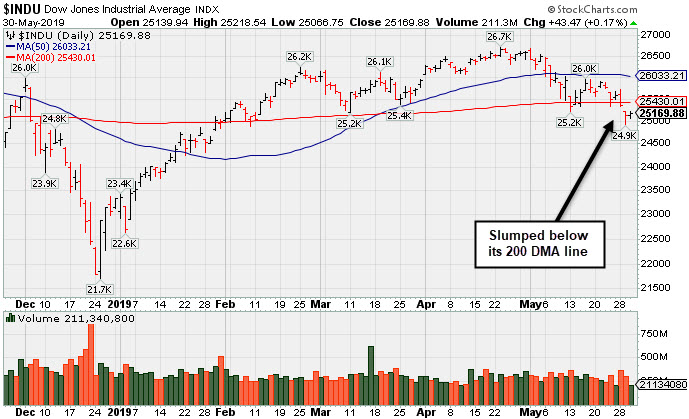
PICTURED: The Dow Jones Industrial Average slumped below its 200-day moving average (DMA) line. Losses on higher volume in recent weeks indicate distributional pressure.
The S&P 500 Index and Nasdaq Composite Index have tested their respective 200 DMA lines and found support. Disciplined investors have been watching for a follow-through day of big gains (more than +1%) from at least one of the major indices backed with higher volume and an expansion in stocks reaching new 52-week highs - all of which are critical components for a new confirmed uptrend under the fact-based system.
Amidst all of the trade headlines, market participants also digested a flurry of economic updates. The second revision of U.S. first-quarter GDP figure showed the economy expanded at an annualized pace of 3.1% during in the first quarter, revised down by less than anticipated. Separately, a report revealed the U.S. trade deficit widened by a narrower margin than anticipated last month. Additional releases showed initial jobless claims came in at 215,000 in the most recent week and pending home sales dropped 1.5% in April versus projections of a 0.5% gain. Treasuries extended their recent rally with the yield on the 10-year note falling three basis points to 2.22%.
Seven of 11 S&P 500 sectors finished higher with Technology pacing the gains. Energy stocks underperformed as WTI crude declined 3.9% following a smaller than expected drawn down in U.S. stockpiles. In earnings news, Dollar Tree (DLTR +3.14%) rose after revenue and same-store sales topping analyst projections. Rival Dollar General (DG +7.16%) rose after delivering a top and bottom line beat. PVH Corp. (PHV -14.9%) slumped after missing sales estimates and cutting full-year guidance. In commodities, COMEX gold added 0.5% to $1287.60/ounce.
|
 Kenneth J. Gruneisen started out as a licensed stockbroker in August 1987, a couple of months prior to the historic stock market crash that took the Dow Jones Industrial Average down -22.6% in a single day. He has published daily fact-based fundamental and technical analysis on high-ranked stocks online for two decades. Through FACTBASEDINVESTING.COM, Kenneth provides educational articles, news, market commentary, and other information regarding proven investment systems that work in good times and bad.
Comments contained in the body of this report are technical opinions only and are not necessarily those of Gruneisen Growth Corp. The material herein has been obtained from sources believed to be reliable and accurate, however, its accuracy and completeness cannot be guaranteed. Our firm, employees, and customers may effect transactions, including transactions contrary to any recommendation herein, or have positions in the securities mentioned herein or options with respect thereto. Any recommendation contained in this report may not be suitable for all investors and it is not to be deemed an offer or solicitation on our part with respect to the purchase or sale of any securities. |
|
 |
Retail, Tech, and Gold & Silver Indexes Rose
Kenneth J. Gruneisen - Passed the CAN SLIM® Master's Exam
The Retail Index ($RLX +0.48%) posted a modest gain but losses for the Broker/Dealer Index ($XBD -0.62%) and Bank Index ($BKX -1.25%) weighed on the major averages. The tech sector had a positive bias as the Semiconductor Index ($SOX +0.74%) and the Biotech Index ($BTK +0.55%) rose, but the Networking Index ($NWX -0.01%) finished flat. Commodity-linked groups were mixed as the Gold & Silver Index ($XAU +1.58%) rose while the Oil Services Index ($OSX -1.68%) and the Integrated Oil Index ($XOI -1.31%) lost ground. Charts courtesy of www.stockcharts.com
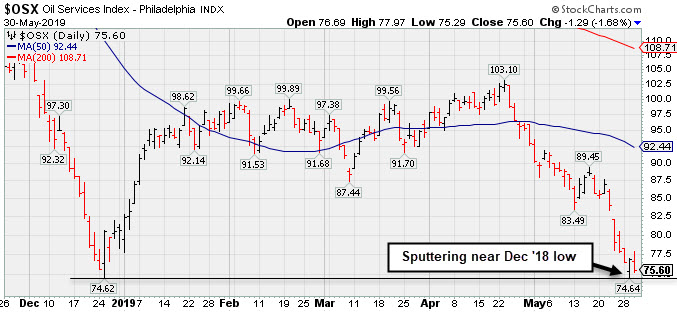 PICTURED: The Oil Services Index ($OSX -1.68%) is sputtering near its December 2018 low.
| Oil Services |
$OSX |
75.60 |
-1.29 |
-1.68% |
-6.20% |
| Integrated Oil |
$XOI |
1,191.24 |
-15.83 |
-1.31% |
+2.77% |
| Semiconductor |
$SOX |
1,315.29 |
+9.72 |
+0.74% |
+13.86% |
| Networking |
$NWX |
547.75 |
-0.06 |
-0.01% |
+12.09% |
| Broker/Dealer |
$XBD |
256.62 |
-1.61 |
-0.62% |
+8.12% |
| Retail |
$RLX |
2,232.38 |
+10.57 |
+0.48% |
+14.40% |
| Gold & Silver |
$XAU |
67.45 |
+1.05 |
+1.58% |
-4.54% |
| Bank |
$BKX |
93.40 |
-1.18 |
-1.25% |
+8.87% |
| Biotech |
$BTK |
4,422.08 |
+24.02 |
+0.55% |
+4.77% |
|
|
|
 |
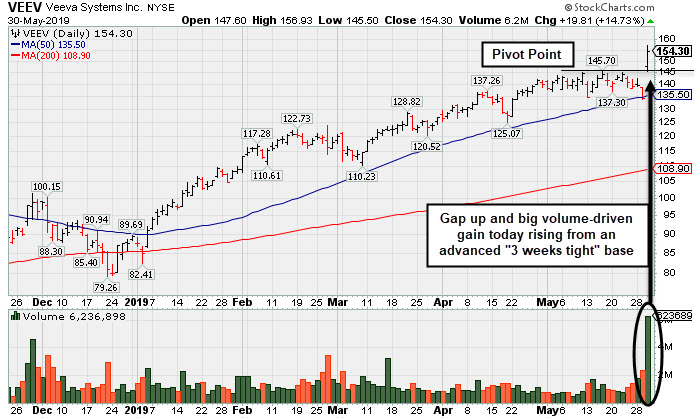
Big Volume-Driven Gain for New High Following Earnings News
Kenneth J. Gruneisen - Passed the CAN SLIM® Master's Exam
Veeva Systems Inc Cl A (VEEV +$18.94 or +14.08% to $153.43) finished strong today after it was highlighted in yellow with pivot point cited based on its 5/16/19 high plus 10 cents in the earlier mid-day report (read here). It gapped up hitting a new all-time high, rallying from the previously noted advanced "3 weeks tight" base. Members were recently reminded, "Volume and volatility often increase near earnings news."
Bullish action came after it reported earnings +52% on +25% sales revenues for the Apr '19 quarter, marking its 5th strong quarter with earnings above the +25% minimum guideline (C criteria). Disciplined investors will note that no new buying efforts are to be made during market corrections (M criteria) under the fact-based investment system's rules. Watch for a confirmed rally with a follow-through day first.
Its annual earnings (A criteria) history has been strong. It has the highest possible 99 Earnings Per Share (EPS) rank and it has a 96 Relative Strength (RS) rating. Both of those ratings must be above 80 for a stock to meet the guidelines for consideration.
The number of top-rated funds owning its shares rose from 814 in Jun '18 to 1,101 in Mar '19, a reassuring sign concerning the I criteria. Its current Up/Down Volume Ratio of 1.4 is an unbiased indication its shares have been under accumulation over the past 50 days.
|
|
|
Color Codes Explained :
Y - Better candidates highlighted by our
staff of experts.
G - Previously featured
in past reports as yellow but may no longer be buyable under the
guidelines.
***Last / Change / Volume data in this table is the closing quote data***
Symbol/Exchange
Company Name
Industry Group |
PRICE |
CHANGE
(%Change) |
Day High |
Volume
(% DAV)
(% 50 day avg vol) |
52 Wk Hi
% From Hi |
Featured
Date |
Price
Featured |
Pivot Featured |
|
Max Buy |
SPSC
-
NASDAQ
S P S Commerce Inc
COMPUTER SOFTWARE and SERVICES - Application Software
|
$103.49
|
+1.60
1.57% |
$103.69
|
69,584
44.89% of 50 DAV
50 DAV is 155,000
|
$115.00
-10.01%
|
3/26/2019
|
$107.12
|
PP = $113.41
|
|
MB = $119.08
|
 Most Recent Note - 5/30/2019 5:57:51 PM
G - Still meeting resistance while sputtering below its 50 DMA line ($104.30) and it faces resistance due to overhead supply up to the $115 level. Recent low ($98.59 on 4/18/19) defines important near-term support to watch. Fundamentals remain strong.
>>> FEATURED STOCK ARTICLE : Sputtering Near 50-Day Average Line Building Base-On-Base - 5/1/2019 |
View all notes |
Set NEW NOTE alert |
Company Profile |
SEC
News |
Chart |
Request a new note
C
A
S
I |
EPAM
-
NYSE
Epam Systems Inc
COMPUTER SOFTWARE and SERVICES - Information Technology Service
|
$173.04
|
+6.27
3.76% |
$173.04
|
660,703
148.14% of 50 DAV
50 DAV is 446,000
|
$180.55
-4.16%
|
5/9/2019
|
$169.25
|
PP = $180.55
|
|
MB = $189.58
|
Most Recent Note - 5/29/2019 1:01:03 PM
G - Met resistance near its 50 DMA line ($171) while sputtering in recent weeks, and a rebound above that important short-term average is needed for its outlook to improve. Reported earnings +34% on +23% sales revenues for the Mar '19 quarter, continuing its strong earnings track record.
>>> FEATURED STOCK ARTICLE : Found Support and Closed in Upper Third of Day's Range - 5/9/2019 |
View all notes |
Set NEW NOTE alert |
Company Profile |
SEC
News |
Chart |
Request a new note
C
A
S
I |
ENV
-
NYSE
Envestnet Inc
FINANCIAL SERVICES - Diversified Investments
|
$68.28
|
+0.00
0.00% |
$68.72
|
156,164
54.22% of 50 DAV
50 DAV is 288,000
|
$72.67
-6.04%
|
3/15/2019
|
$66.05
|
PP = $64.90
|
|
MB = $68.15
|
Most Recent Note - 5/28/2019 8:21:33 PM
G - Consolidating above its 50 DMA line ($68.07). Weak action came after recently reporting earnings +5% on +1% sales revenues for the Mar '19 quarter, below the +25% minimum earnings guideline (C criteria). The prior high ($64.80 on 9/14/18) defines important near-term support to watch.
>>> FEATURED STOCK ARTICLE : Negative Reversal After Another New High - 4/24/2019 |
View all notes |
Set NEW NOTE alert |
Company Profile |
SEC
News |
Chart |
Request a new note
C
A
S
I |
TPL
-
NYSE
Texas Pacific Land Trust
Real Estate Dvlpmt/Ops
|
$776.61
|
-33.32
-4.11% |
$803.10
|
7,931
52.52% of 50 DAV
50 DAV is 15,100
|
$915.66
-15.19%
|
5/15/2019
|
$850.01
|
PP = $915.76
|
|
MB = $961.55
|
Most Recent Note - 5/30/2019 5:59:27 PM
G - Still sputtering below its 50 DMA line ($820) and a prompt rebound is needed for its outlook to improve. Subsequent gains above the pivot point backed by at least +40% above average volume may trigger a technical buy signal. Keep in mind that the major averages (M criteria) need a follow-through day to confirm a new uptrend before any new buying efforts are justified under the fact-based investment system. Reported earnings +222% on +219% sales revenues for the Mar '19 quarter continuing its strong earnings track record.
>>> FEATURED STOCK ARTICLE : Recently Found Support and Rose Toward All-Time High - 5/17/2019 |
View all notes |
Set NEW NOTE alert |
Company Profile |
SEC
News |
Chart |
Request a new note
C
A
S
I |
LHCG
-
NASDAQ
L H C Group Inc
HEALTH SERVICES - Home Health Care
|
$112.68
|
+0.13
0.12% |
$114.87
|
150,605
58.60% of 50 DAV
50 DAV is 257,000
|
$122.20
-7.79%
|
4/29/2019
|
$110.94
|
PP = $115.64
|
|
MB = $121.42
|
Most Recent Note - 5/30/2019 5:46:08 PM
Y - Still sputtering below its pivot point after losses on higher volume. Its 50 DMA line ($111) defines near-term support. Fundamentals remain strong.
>>> FEATURED STOCK ARTICLE : Long-Term Care Firm Hovering Near All-Time High - 5/14/2019 |
View all notes |
Set NEW NOTE alert |
Company Profile |
SEC
News |
Chart |
Request a new note
C
A
S
I |
Symbol/Exchange
Company Name
Industry Group |
PRICE |
CHANGE
(%Change) |
Day High |
Volume
(% DAV)
(% 50 day avg vol) |
52 Wk Hi
% From Hi |
Featured
Date |
Price
Featured |
Pivot Featured |
|
Max Buy |
ENSG
-
NASDAQ
Ensign Group Inc
HEALTH SERVICES - Long-Term Care Facilities
|
$53.50
|
+0.15
0.28% |
$54.45
|
179,915
60.17% of 50 DAV
50 DAV is 299,000
|
$58.14
-7.98%
|
4/30/2019
|
$51.46
|
PP = $53.30
|
|
MB = $55.97
|
Most Recent Note - 5/30/2019 6:00:48 PM
Y - Showed resilience in recent weeks after it reported earnings +22% on +12% sales revenues for the Mar '19 quarter, below the +25% minimum earnings guideline (C criteria), raising fundamental concerns. Its 50 DMA line ($51.94) defines near-term support to watch.
>>> FEATURED STOCK ARTICLE : Two Damaging Losses Hurt Outlook - 4/17/2019 |
View all notes |
Set NEW NOTE alert |
Company Profile |
SEC
News |
Chart |
Request a new note
C
A
S
I |
LULU
-
NASDAQ
Lululemon Athletica
MANUFACTURING - Textile Manufacturing
|
$163.85
|
+2.26
1.40% |
$165.29
|
1,816,317
79.94% of 50 DAV
50 DAV is 2,272,000
|
$179.50
-8.72%
|
3/28/2019
|
$169.20
|
PP = $164.89
|
|
MB = $173.13
|
Most Recent Note - 5/29/2019 1:18:13 PM
G - Color code is changed to green after violating its 50 DMA line ($168.48) and prior highs in the $164 area with today's big volume-driven loss triggering technical sell signals. Due to report Apr '19 quarterly earnings news after the close on Wednesday, June 12th
>>> FEATURED STOCK ARTICLE : Volume Light While Hovering Near High - 5/10/2019 |
View all notes |
Set NEW NOTE alert |
Company Profile |
SEC
News |
Chart |
Request a new note
C
A
S
I |
ULTA
-
NASDAQ
Ulta Beauty Inc
SPECIALTY RETAIL - Specialty Retail, Other
|
$328.46
|
+6.39
1.98% |
$334.03
|
1,205,939
177.34% of 50 DAV
50 DAV is 680,000
|
$359.69
-8.68%
|
3/15/2019
|
$341.27
|
PP = $322.59
|
|
MB = $338.72
|
Most Recent Note - 5/30/2019 12:54:30 PM
G - Due to report earnings news after the close today. Volume and volatility often increase near earnings news. Slumped further below its 50 DMA line ($345) and violated the prior low ($325.62 on 5/14/19) with damaging volume-driven losses hurting its outlook. A rebound above the 50 DMA line is needed for its outlook to improve. Faces resistance due to overhead supply up to the $359 level.
>>> FEATURED STOCK ARTICLE : Volume Totals Cooling in Recent Weeks While Hovering Near High - 4/26/2019 |
View all notes |
Set NEW NOTE alert |
Company Profile |
SEC
News |
Chart |
Request a new note
C
A
S
I |
ESNT
-
NYSE
Essent Group Ltd
Finance-MrtgandRel Svc
|
$47.49
|
-0.69
-1.43% |
$48.70
|
492,600
80.62% of 50 DAV
50 DAV is 611,000
|
$48.88
-2.84%
|
3/18/2019
|
$45.84
|
PP = $45.06
|
|
MB = $47.31
|
Most Recent Note - 5/28/2019 8:22:43 PM
Y - Still perched near its 52-week high. Recently reported earnings +15% on +20% sales revenues for the Mar '19 quarter, below the +25% minimum earnings guideline (C criteria), raising fundamental concerns. Its 50 DMA line ($46.16) defines near term support to watch. Faces very little resistance due to overhead supply up to the $50 level.
>>> FEATURED STOCK ARTICLE : Perched Above Pivot Point With Earnings News Due May 3rd - 4/25/2019 |
View all notes |
Set NEW NOTE alert |
Company Profile |
SEC
News |
Chart |
Request a new note
C
A
S
I |
FIVE
-
NASDAQ
Five Below Inc
Retail-DiscountandVariety
|
$129.32
|
+3.52
2.80% |
$130.59
|
1,290,258
111.13% of 50 DAV
50 DAV is 1,161,000
|
$148.22
-12.75%
|
4/11/2019
|
$132.05
|
PP = $133.75
|
|
MB = $140.44
|
Most Recent Note - 5/29/2019 5:22:23 PM
G - Color code is changed to green after slumping below its 50 DMA line ($131.62) again with today's big loss. Recent low ($123.64 on 5/20/19) defines the next important near-term support above its 200 DMA line.
>>> FEATURED STOCK ARTICLE : Rallied But Slumped Back Near 50-Day Moving Average - 5/28/2019 |
View all notes |
Set NEW NOTE alert |
Company Profile |
SEC
News |
Chart |
Request a new note
C
A
S
I |
Symbol/Exchange
Company Name
Industry Group |
PRICE |
CHANGE
(%Change) |
Day High |
Volume
(% DAV)
(% 50 day avg vol) |
52 Wk Hi
% From Hi |
Featured
Date |
Price
Featured |
Pivot Featured |
|
Max Buy |
NOW
-
NYSE
Servicenow Inc
Computer Sftwr-Enterprse
|
$262.60
|
-1.59
-0.60% |
$265.41
|
1,234,356
69.82% of 50 DAV
50 DAV is 1,768,000
|
$281.74
-6.79%
|
4/22/2019
|
$242.64
|
PP = $251.75
|
|
MB = $264.34
|
Most Recent Note - 5/29/2019 5:30:52 PM
G - The 50 DMA line ($255) and prior high ($251.65 on 3/21/19) define important near-term support to watch while consolidating near its all-time high. Recently reported earnings +20% on +34% sales revenues for the Mar '19 quarter, below the +25% minimum earnings guideline (C criteria), raising concerns, fundamentally. See the latest FSU analysis for more details and a new annotated graph.
>>> FEATURED STOCK ARTICLE : Leader Consolidating Above 50-Day Moving Average Line - 5/29/2019 |
View all notes |
Set NEW NOTE alert |
Company Profile |
SEC
News |
Chart |
Request a new note
C
A
S
I |
QLYS
-
NASDAQ
Qualys Inc
Computer Sftwr-Security
|
$90.18
|
+0.97
1.09% |
$90.92
|
201,544
63.98% of 50 DAV
50 DAV is 315,000
|
$98.30
-8.26%
|
5/23/2019
|
$90.43
|
PP = $98.40
|
|
MB = $103.32
|
Most Recent Note - 5/30/2019 5:54:07 PM
Y - Subsequent volume-driven gains above the pivot point are still needed to trigger a technical buy signal. Its Relative Strength Rating is 87, above the 80+ minimum guideline for buy candidates. Near-term support to watch is its 50 DMA line ($85.66) and prior low ($83.68). Met stubborn resistance in the $97-98 area. Reported earnings +36% on +16% sales revenues for the Mar '19 quarter, continuing its strong earnings history.
>>> FEATURED STOCK ARTICLE : Rallying to Challenge Previously Stubborn Resistance - 5/2/2019 |
View all notes |
Set NEW NOTE alert |
Company Profile |
SEC
News |
Chart |
Request a new note
C
A
S
I |
SPLK
-
NASDAQ
Splunk Inc
Computer Sftwr-Database
|
$117.60
|
-1.17
-0.99% |
$120.20
|
1,550,210
95.32% of 50 DAV
50 DAV is 1,626,400
|
$143.70
-18.16%
|
5/22/2019
|
$136.52
|
PP = $143.80
|
|
MB = $150.99
|
Most Recent Note - 5/30/2019 5:56:55 PM
A prompt rebound above its 50 DMA ($130.58) is needed for its outlook to improve. Testing support at its 200 DMA line ($117.57) after damaging volume-driven loss. It will be dropped from the Featured Stocks list tonight. Relative Strength Rating has slumped to 57, below the 80+ minimum for buy candidates. Weakness came after it reported earnings of 2 cents per share versus a loss of 7 cents per share on +36% sales revenues from the year ago period ended April 30th. Members were repeatedly reminded - "Volume and volatility often increase near earnings news."
>>> FEATURED STOCK ARTICLE : Perched Near Prior High With Earnings News Due - 5/22/2019 |
View all notes |
Set NEW NOTE alert |
Company Profile |
SEC
News |
Chart |
Request a new note
C
A
S
I |
VEEV
-
NYSE
Veeva Systems Inc Cl A
Computer Sftwr-Medical
|
$154.30
|
+19.81
14.73% |
$156.93
|
6,231,786
599.79% of 50 DAV
50 DAV is 1,039,000
|
$145.70
5.90%
|
5/30/2019
|
$154.32
|
PP = $145.80
|
|
MB = $153.09
|
Most Recent Note - 5/30/2019 5:43:24 PM
Y - Finished strong today after highlighted in yellow with pivot point cited based on its 5/16/19 high plus 10 cents in the earlier mid-day report. Gapped up hitting a new all-time high, rallying from the previously noted advanced "3 weeks tight" base. Bullish action came after it reported earnings +52% on +25% sales revenues for the Apr '19 quarter, marking its 5th strong quarter with earnings above the +25% minimum guideline (C criteria). Disciplined investors will note that no new buying efforts are to be made during market corrections (M criteria) under the fact-based investment system's rules. Watch for a confirmed rally with a follow-through day first. See the latest FSU analysis for more details and a new annotated graph.
>>> FEATURED STOCK ARTICLE : Big Volume-Driven Gain for New High Following Earnings News - 5/30/2019 |
View all notes |
Set NEW NOTE alert |
Company Profile |
SEC
News |
Chart |
Request a new note
C
A
S
I |
PAYC
-
NYSE
Paycom Software Inc
COMPUTER SOFTWARE and SERVICES - Application Software
|
$209.14
|
+3.09
1.50% |
$209.34
|
524,647
75.38% of 50 DAV
50 DAV is 696,000
|
$215.65
-3.02%
|
2/6/2019
|
$171.66
|
PP = $164.18
|
|
MB = $172.39
|
Most Recent Note - 5/30/2019 5:47:29 PM
G - Holding its ground stubbornly, but extended from any sound base. Its 50 DMA line ($196.47) defines important near-term support to watch. Reported earnings +25% on +30% sales revenues for the Mar '19 quarter.
>>> FEATURED STOCK ARTICLE : Paycom Software Quietly Hovering Near All-Time High - 4/16/2019 |
View all notes |
Set NEW NOTE alert |
Company Profile |
SEC
News |
Chart |
Request a new note
C
A
S
I |
Symbol/Exchange
Company Name
Industry Group |
PRICE |
CHANGE
(%Change) |
Day High |
Volume
(% DAV)
(% 50 day avg vol) |
52 Wk Hi
% From Hi |
Featured
Date |
Price
Featured |
Pivot Featured |
|
Max Buy |
PYPL
-
NASDAQ
Paypal Holdings Inc
Finance-CrdtCard/PmtPr
|
$111.41
|
+1.33
1.21% |
$111.57
|
3,820,849
62.46% of 50 DAV
50 DAV is 6,117,000
|
$114.66
-2.83%
|
1/24/2019
|
$92.56
|
PP = $93.80
|
|
MB = $98.49
|
Most Recent Note - 5/30/2019 5:51:36 PM
G - Hovering near its all-time high, stubbornly holding its ground, but very extended from any sound base. Its 50 DMA line ($108.20) and prior low ($106.52) define important near-term support to watch. Recently reported earnings +37% on +12% sales revenues for the Mar '19 quarter, continuing its strong earnings track record.
>>> FEATURED STOCK ARTICLE : Hovering Near All Time High Extended From Any Sound Base - 5/15/2019 |
View all notes |
Set NEW NOTE alert |
Company Profile |
SEC
News |
Chart |
Request a new note
C
A
S
I |
PLNT
-
NYSE
Planet Fitness Inc Cl A
Leisure-Services
|
$75.56
|
+1.00
1.34% |
$75.71
|
627,156
44.04% of 50 DAV
50 DAV is 1,424,000
|
$81.76
-7.58%
|
11/7/2018
|
$57.10
|
PP = $55.45
|
|
MB = $58.22
|
Most Recent Note - 5/30/2019 5:49:55 PM
G - Still extended from any sound base. Its 50 DMA line ($73.39) and prior low define near-term support levels to watch. Violations would raise concerns and trigger technical sell signals. Fundamentals remain strong.
>>> FEATURED STOCK ARTICLE : Pulling Back From High After Impressive Rally - 5/23/2019 |
View all notes |
Set NEW NOTE alert |
Company Profile |
SEC
News |
Chart |
Request a new note
C
A
S
I |
BLD
-
NYSE
Topbuild Corp
Bldg-Constr Prds/Misc
|
$78.26
|
+1.15
1.49% |
$78.47
|
186,613
59.43% of 50 DAV
50 DAV is 314,000
|
$87.21
-10.26%
|
5/17/2019
|
$82.19
|
PP = $87.31
|
|
MB = $91.68
|
Most Recent Note - 5/30/2019 5:44:16 PM
Y - Encountered distributional pressure in recent weeks after highlighted in the 5/17/19 mid-day report. Subsequent gains above the pivot point backed by at least +40% above average volume may trigger a technical buy signal. Reported earnings +45% on +26% sales revenues for the Mar '19 quarter. Quarterly earnings increases have been above the +25% minimum guideline (C criteria). Annual earnings (A criteria) history has been strong and steady since turning profitable in FY '14.
>>> FEATURED STOCK ARTICLE : Encountered Distributional Pressure Near Prior High - 5/20/2019 |
View all notes |
Set NEW NOTE alert |
Company Profile |
SEC
News |
Chart |
Request a new note
C
A
S
I |
TEAM
-
NASDAQ
Atlassian Corp Plc Cl A
Comp Sftwr-Spec Enterprs
|
$126.22
|
+2.42
1.95% |
$126.29
|
903,866
50.30% of 50 DAV
50 DAV is 1,797,000
|
$132.87
-5.00%
|
5/24/2019
|
$129.52
|
PP = $132.09
|
|
MB = $138.69
|
Most Recent Note - 5/29/2019 5:24:15 PM
Y - Gapped down today. Formed an advanced "3-weeks tight" base. Prior high ($117) defines important neat-term support to watch. Subsequent volume-driven gains for new highs may trigger a new (or add-on) technical buy signal. Reported earnings +133% on +38% sales revenues for the Mar '19 quarter, continuing its strong earnings track record.
>>> FEATURED STOCK ARTICLE : Perched Near All-Time High After "3-Weeks Tight" - 5/24/2019 |
View all notes |
Set NEW NOTE alert |
Company Profile |
SEC
News |
Chart |
Request a new note
C
A
S
I |
GLOB
-
NYSE
Globant SA
Computer-Tech Services
|
$90.77
|
+2.42
2.74% |
$90.87
|
392,446
114.08% of 50 DAV
50 DAV is 344,000
|
$93.50
-2.92%
|
2/15/2019
|
$69.35
|
PP = $70.00
|
|
MB = $73.50
|
Most Recent Note - 5/29/2019 1:06:01 PM
G - Gapped down today, retreating from its all-time high after getting very extended from any sound base. Its 50 DMA line ($79.74) defines important support above the prior high ($74). Violations would raise concerns and trigger technical sell signals. Reported earnings +32% on +22% sales revenues for the quarter ended March 31st, 2019 versus the year ago period, continuing its strong earning track record.
>>> FEATURED STOCK ARTICLE : Earnings News Due While Perched Near All-Time High - 5/7/2019 |
View all notes |
Set NEW NOTE alert |
Company Profile |
SEC
News |
Chart |
Request a new note
C
A
S
I |
Symbol/Exchange
Company Name
Industry Group |
PRICE |
CHANGE
(%Change) |
Day High |
Volume
(% DAV)
(% 50 day avg vol) |
52 Wk Hi
% From Hi |
Featured
Date |
Price
Featured |
Pivot Featured |
|
Max Buy |
|
|
|
THESE ARE NOT BUY RECOMMENDATIONS!
Comments contained in the body of this report are technical
opinions only. The material herein has been obtained
from sources believed to be reliable and accurate, however,
its accuracy and completeness cannot be guaranteed.
This site is not an investment advisor, hence it does
not endorse or recommend any securities or other investments.
Any recommendation contained in this report may not
be suitable for all investors and it is not to be deemed
an offer or solicitation on our part with respect to
the purchase or sale of any securities. All trademarks,
service marks and trade names appearing in this report
are the property of their respective owners, and are
likewise used for identification purposes only.
This report is a service available
only to active Paid Premium Members.
You may opt-out of receiving report notifications
at any time. Questions or comments may be submitted
by writing to Premium Membership Services 665 S.E. 10 Street, Suite 201 Deerfield Beach, FL 33441-5634 or by calling 1-800-965-8307
or 954-785-1121.
|
|
|