You are not logged in.
This means you
CAN ONLY VIEW reports that were published prior to Thursday, April 10, 2025.
You
MUST UPGRADE YOUR MEMBERSHIP if you want to see any current reports.
AFTER MARKET UPDATE - THURSDAY, MAY 9TH, 2024
Previous After Market Report Next After Market Report >>>
|
|
|
|
DOW |
+331.37 |
39,387.76 |
+0.85% |
|
Volume |
890,866,480 |
-7% |
|
Volume |
4,554,472,900 |
-0% |
|
NASDAQ |
+43.51 |
16,346.26 |
+0.27% |
|
Advancers |
1,982 |
72% |
|
Advancers |
2,600 |
62% |
|
S&P 500 |
+26.41 |
5,214.08 |
+0.51% |
|
Decliners |
784 |
28% |
|
Decliners |
1,595 |
38% |
|
Russell 2000 |
+18.50 |
2,073.63 |
+0.90% |
|
52 Wk Highs |
181 |
|
|
52 Wk Highs |
153 |
|
|
S&P 600 |
+15.03 |
1,329.76 |
+1.14% |
|
52 Wk Lows |
17 |
|
|
52 Wk Lows |
93 |
|
|
Conditions are technically still considered a market "correction" (M criteria). Investors are still cautioned about making new buying efforts until a solid follow-through day marked by higher volume is noted confirming a new uptrend.
|
 |
Major Indices Rose With Better Leadership But Lackluster Volume
Kenneth J. Gruneisen - Passed the CAN SLIM® Master's Exam
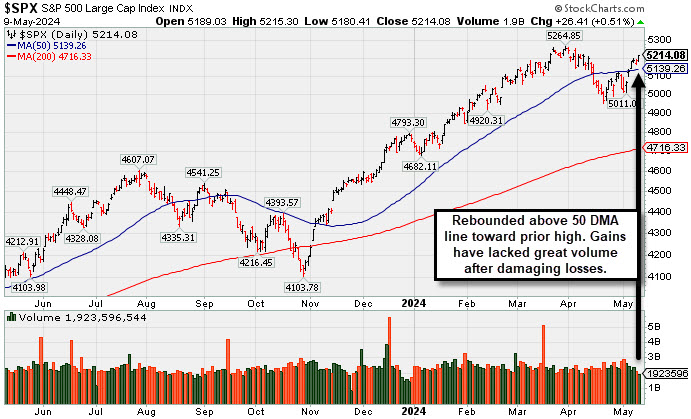
The major indices all registered gains ranging from 0.3% to 0.9%. Volume reported was lighter than the prior session totals on the NYSE and on the Nasdaq exchange. Breadth was positive as advancers led decliners by a 5-2 margin on the NYSE and by 5-3 on the Nasdaq exchange. Leadership improved as there were 91 high-ranked companies from the Leaders List that hit new 52-week highs and were listed on the BreakOuts Page versus 65 on the prior session. New 52-week highs totals expanded and solidly outnumbered new 52-week lows on the NYSE and on the Nasdaq exchange. The major indices remain in a market correction (M criteria). Patience is important for all investors until a follow-through day signals a new confirmed uptrend.
PICTURED: The S&P 500 Index is consolidating after rebounding above its 50-day moving average (DMA) line. Gains have lacked great volume after damaging losses.
Equinix (EQIX +11.5%), NRG Energy (NRG +7.8%), and Steris (STE +7.6%) were the top performing stocks in the S&P 500 following pleasing earnings and/or guidance. Meanwhile, EPAM Systems (EPAM -27.0%) was the worst performing stock in the S&P 500.
The S&P 500 information technology sector (-0.3%) was the lone sector to finish in negative territory. The other ten S&P 500 sectors aside from info tech logged gains ranging from 0.4% to 2.3%. The real estate sector was the top performer, followed by the utilities (+1.5%) and energy (+1.4%) sectors.
The 2-yr note yield settled three basis points lower at 4.81% and the 10-yr note yield declined four basis points to 4.45%. There was a weaker-than-expected weekly jobless claims report. A fresh $25 billion 30-yr bond auction attracted solid demand.
|
 Kenneth J. Gruneisen started out as a licensed stockbroker in August 1987, a couple of months prior to the historic stock market crash that took the Dow Jones Industrial Average down -22.6% in a single day. He has published daily fact-based fundamental and technical analysis on high-ranked stocks online for two decades. Through FACTBASEDINVESTING.COM, Kenneth provides educational articles, news, market commentary, and other information regarding proven investment systems that work in good times and bad.
Comments contained in the body of this report are technical opinions only and are not necessarily those of Gruneisen Growth Corp. The material herein has been obtained from sources believed to be reliable and accurate, however, its accuracy and completeness cannot be guaranteed. Our firm, employees, and customers may effect transactions, including transactions contrary to any recommendation herein, or have positions in the securities mentioned herein or options with respect thereto. Any recommendation contained in this report may not be suitable for all investors and it is not to be deemed an offer or solicitation on our part with respect to the purchase or sale of any securities. |
|
 |
Retail, Bank, and Commodity-Linked Indexes Rose
Kenneth J. Gruneisen - Passed the CAN SLIM® Master's Exam
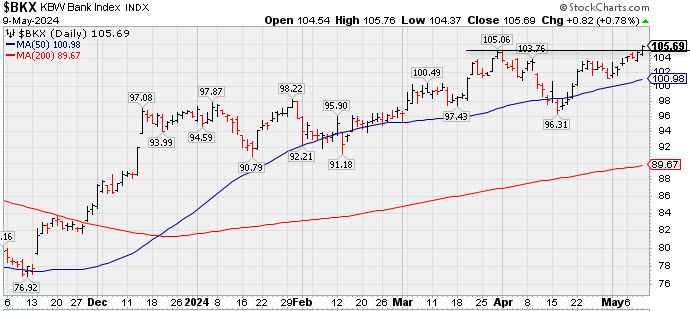
The Retail Index ($RLX +1.11%) and the Bank Index ($BKX +0.78%) both posted solid gains while the Broker/Dealer Index ($XBD -0.15%) ended slightly lower. The tech sector was mixed as the Semiconductor Index ($SOX -0.64%) fell while the Networking Index ($NWX +0.28%) inched higher and the Biotech Index ($BTK +0.63%) posted a modesat gain. Commodity-linked groups had a positive bias as the Gold & Silver Index ($XAU +3.25%) outpaced the Oil Services ($OSX +1.43%) and the Integrated Oil Index ($XOI +1.07%).
![]() PICTURED: The Bank Index ($BKX +0.78%) posted a solid gain for a new 2024 high.
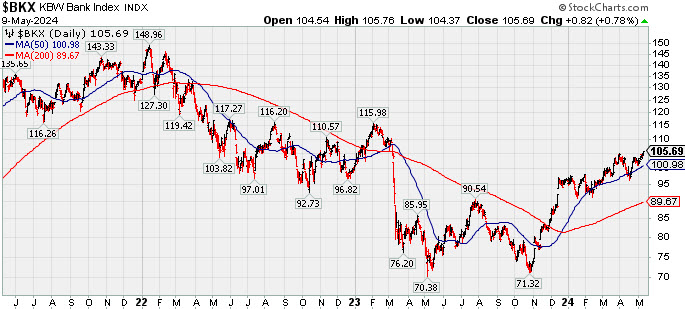
![]() PICTURED: The 3-year graph of the Bank Index ($BKX +0.78%) illustrates the deep and choppy consolidation since its January 2022 all-time high. During that period of time interest rates rose more quickly and sharply than any other time in 40 years. Recent improvement for bank stocks has come in anticipation of rate cuts that have not yet been seen.
| Oil Services |
$OSX |
87.72 |
+1.23 |
+1.43% |
+4.58% |
| Integrated Oil |
$XOI |
2,140.97 |
+22.69 |
+1.07% |
+14.95% |
| Semiconductor |
$SOX |
4,759.77 |
-30.61 |
-0.64% |
+13.99% |
| Networking |
$NWX |
757.86 |
+2.10 |
+0.28% |
-9.00% |
| Broker/Dealer |
$XBD |
619.50 |
-0.94 |
-0.15% |
+11.16% |
| Retail |
$RLX |
4,521.22 |
+49.49 |
+1.11% |
+16.26% |
| Gold & Silver |
$XAU |
142.17 |
+4.47 |
+3.25% |
+13.11% |
| Bank |
$BKX |
105.69 |
+0.82 |
+0.78% |
+10.07% |
| Biotech |
$BTK |
5,108.72 |
+31.76 |
+0.63% |
-5.72% |
|
|
|
 |
Featured Stocks
Kenneth J. Gruneisen - Passed the CAN SLIM® Master's Exam
|
|
|
Color Codes Explained :
Y - Better candidates highlighted by our
staff of experts.
G - Previously featured
in past reports as yellow but may no longer be buyable under the
guidelines.
***Last / Change / Volume data in this table is the closing quote data***
Symbol/Exchange
Company Name
Industry Group |
PRICE |
CHANGE
(%Change) |
Day High |
Volume
(% DAV)
(% 50 day avg vol) |
52 Wk Hi
% From Hi |
Featured
Date |
Price
Featured |
Pivot Featured |
|
Max Buy |
 AXON
-
NASDAQ
AXON
-
NASDAQ
Axon Enterprise
Security/Sfty
|
$311.86
|
+0.00
0.00% |
$316.32
|
138
0.02% of 50 DAV
50 DAV is 563,000
|
$329.87
-5.46%
|
4/5/2024
|
$309.90
|
PP = $325.73
|
|
MB = $342.02
|
 Most Recent Note - 5/8/2024 5:03:33 PM
Y - Finding support after a gap down testing its 50 DMA line ($310.75) on the prior session. More damaging losses woud raise concerns and trigger a technical sell signal. Reported Mar '24 quarterly earnings +31% on +34% sales revenues versus the year ago period. Fundamentals remain strong.
>>> FEATURED STOCK ARTICLE : Found Support Near 50-Day Moving Average After Recent Stall - 4/29/2024 |
View all notes |
Set NEW NOTE alert |
Company Profile |
SEC
News |
Chart |
Request a new note
C
A
S
I |
TDG
-
NYSE
TransDigm Group
Aerospace/Defense
|
$1,315.00
|
+0.00
0.00% |
$1,328.15
|
14
0.01% of 50 DAV
50 DAV is 201,000
|
$1,328.15
-0.99%
|
4/12/2024
|
$1,224.21
|
PP = $1,246.32
|
|
MB = $1,308.64
|
Most Recent Note - 5/8/2024 5:05:38 PM
G - Posted 6 consecutive gains marked by volume as it rose to new all-time highs above its "max buy" level and its color code is changed to green. Its 50 DMA line ($1,218) defines near-term support to watch on pullbacks. Reported Mar '24 quarterly earnings +34% on +21% sales revenues versus the year-ago period.
>>> FEATURED STOCK ARTICLE : Found Support at 50-Day Moving Average Line and Hit New High - 4/30/2024 |
View all notes |
Set NEW NOTE alert |
Company Profile |
SEC
News |
Chart |
Request a new note
C
A
S
I |
USLM
-
NASDAQ
U.S. Lime & Minerals
Bldg-Cement/Concrt/Ag
|
$372.00
|
+0.00
0.00% |
$378.45
|
3
0.01% of 50 DAV
50 DAV is 25,000
|
$378.45
-1.70%
|
2/9/2024
|
$254.68
|
PP = $265.09
|
|
MB = $278.34
|
Most Recent Note - 5/8/2024 5:06:30 PM
G - Inched higher today for a 9th consecutive gain and yet another new all-time high. Its 50 DMA line ($299) and recent lows define near-term support to watch. Bullish action came after it reported Mar '24 quarterly earnings +31% on +7% sales revenues versus the year-ago period.
>>> FEATURED STOCK ARTICLE : Trading in Tight Range Near High - 4/26/2024 |
View all notes |
Set NEW NOTE alert |
Company Profile |
SEC
News |
Chart |
Request a new note
C
A
S
I |
|
|
|
THESE ARE NOT BUY RECOMMENDATIONS!
Comments contained in the body of this report are technical
opinions only. The material herein has been obtained
from sources believed to be reliable and accurate, however,
its accuracy and completeness cannot be guaranteed.
This site is not an investment advisor, hence it does
not endorse or recommend any securities or other investments.
Any recommendation contained in this report may not
be suitable for all investors and it is not to be deemed
an offer or solicitation on our part with respect to
the purchase or sale of any securities. All trademarks,
service marks and trade names appearing in this report
are the property of their respective owners, and are
likewise used for identification purposes only.
This report is a service available
only to active Paid Premium Members.
You may opt-out of receiving report notifications
at any time. Questions or comments may be submitted
by writing to Premium Membership Services 665 S.E. 10 Street, Suite 201 Deerfield Beach, FL 33441-5634 or by calling 1-800-965-8307
or 954-785-1121.
|
|
|