You are not logged in.
This means you
CAN ONLY VIEW reports that were published prior to Tuesday, March 11, 2025.
You
MUST UPGRADE YOUR MEMBERSHIP if you want to see any current reports.
AFTER MARKET UPDATE - TUESDAY, APRIL 5TH, 2022
Previous After Market Report Next After Market Report >>>
|
|
|
|
DOW |
-280.70 |
34,641.18 |
-0.80% |
|
Volume |
980,291,835 |
+7% |
|
Volume |
4,605,595,500 |
+2% |
|
NASDAQ |
-328.39 |
14,204.17 |
-2.26% |
|
Advancers |
618 |
19% |
|
Advancers |
1,211 |
28% |
|
S&P 500 |
-57.52 |
4,525.12 |
-1.26% |
|
Decliners |
2,639 |
81% |
|
Decliners |
3,106 |
72% |
|
Russell 2000 |
-49.40 |
2,046.04 |
-2.36% |
|
52 Wk Highs |
122 |
|
|
52 Wk Highs |
74 |
|
|
S&P 600 |
-29.91 |
1,296.42 |
-2.26% |
|
52 Wk Lows |
116 |
|
|
52 Wk Lows |
156 |
|
|
 |
Major Averages Fell With Clearly Negative Breadth
Kenneth J. Gruneisen - Passed the CAN SLIM® Master's Exam
The Dow slid 280 points, while the S&P 500 lost 1.3%. The Nasdaq Composite retreated 2.3% amid weakness in growth-related stocks. The tech-heavy index slipped back in correction territory (defined as a 10% decline from a recent peak). Volume totals reported were higher than the prior session on the NYSE and on the Nasdaq exchange, revealing an increase in institutional selling. Breadth was negative as decliners led advancers by more than a 4-1 margin on the NYSE and nearly 3-1 on the Nasdaq exchange. There were 37 high-ranked companies from the Leaders List that hit new 52-week highs and were listed on the BreakOuts Page. New 52-week highs outnumbered new 52-week lows by a narrow margin on the NYSE, meanwhile new highs nearly doubled new lows on the Nasdaq exchange. The recently noted follow-through day confirmed a new uptrend (M criteria). Strict followers of the fact-based investment system only buy stocks fitting all key fundamental and technical investment criteria.
Chart courtesy of www.stockcharts.com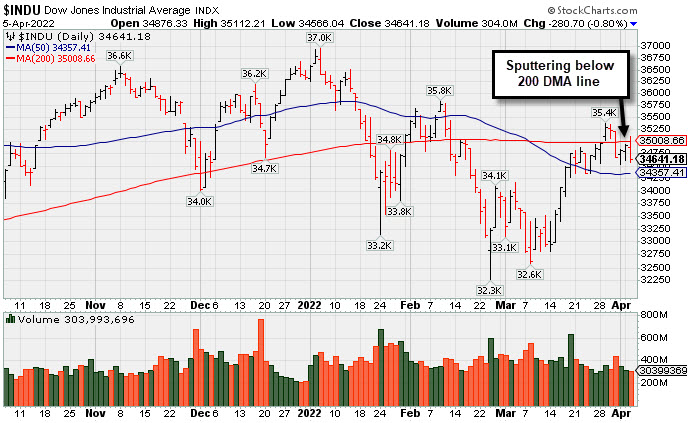 PICTURED: The Dow Jones Industrial Average has been sputtering back below its 200-day moving average (DMA) line.
U.S. stocks slumped on Tuesday as Wall Street assessed hawkish central bank commentary. Federal Reserve (Fed) Governor Lael Brainard expressed urgency around easing inflationary pressures, suggesting that officials could begin reducing the balance sheet rapidly as early as next month. The release of the Fed’s March meeting minutes tomorrow is expected to provide further details around the central bank’s plan to trim its bond holdings.
Treasuries tumbled, with the yield on the two-year note jumping 12 basis points (0.12%) to 2.53%, its highest level since March 2019. The 10-year note yield spiked 15 basis points (0.15%) to 2.55%. On the data front, the Institute for Supply Management revealed that U.S. services sector growth accelerated in March, with the purchasing managers’ index (PMI) rising for the first time in four months. The prices paid component climbed to the highest on record. Separately, the U.S. trade deficit held at a record $89.2 billion in February.
Risk sentiment was also dented by news that the European Union is proposing new sanctions on Moscow. These penalties would include a ban on Russian coal and chemicals, though they hold off on prohibiting oil and gas imports. West Texas Intermediate crude slid 3% to $100.15/barrel amid a stronger U.S. dollar. Seven of 11 S&P 500 sectors ended in negative territory, with the more traditionally defensive groups bucking the downtrend.
|
 Kenneth J. Gruneisen started out as a licensed stockbroker in August 1987, a couple of months prior to the historic stock market crash that took the Dow Jones Industrial Average down -22.6% in a single day. He has published daily fact-based fundamental and technical analysis on high-ranked stocks online for two decades. Through FACTBASEDINVESTING.COM, Kenneth provides educational articles, news, market commentary, and other information regarding proven investment systems that work in good times and bad.
Comments contained in the body of this report are technical opinions only and are not necessarily those of Gruneisen Growth Corp. The material herein has been obtained from sources believed to be reliable and accurate, however, its accuracy and completeness cannot be guaranteed. Our firm, employees, and customers may effect transactions, including transactions contrary to any recommendation herein, or have positions in the securities mentioned herein or options with respect thereto. Any recommendation contained in this report may not be suitable for all investors and it is not to be deemed an offer or solicitation on our part with respect to the purchase or sale of any securities. |
|
 |
Retail, Financial, Tech, and Commodity-Linked Groups Fell
Kenneth J. Gruneisen - Passed the CAN SLIM® Master's Exam
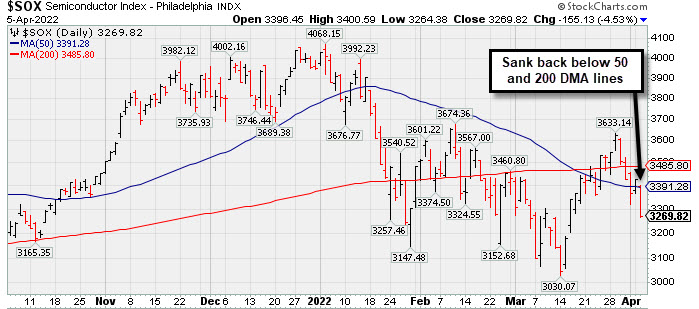
The Retail Index ($RLX -1.57%), Broker/Dealer Index ($XBD -1.70%), and Bank Index ($BKX -1.01%) each lost ground. Commodity-linked groups had a negative bias as the Gold & Silver Index ($XAU -2.57%), Oil Services Index ($OSX -3.08%), and Integrated Oil Index ($XOI -1.60%) each ended lower. The tech sector also saw unanmous losses led by the Semiconductor Index ($SOX -4.53%), followed by losses from the Networking Index ($NWX -2.17%) and the Biotech Index ($BTK -1.01%). PICTURED: The Semiconductor Index ($SOX -4.53%) sank back below its 50-day and 200-day moving average (DMA) lines after recently making limited headway above them.
| Oil Services |
$OSX |
79.50 |
-2.53 |
-3.08% |
+50.79% |
| Integrated Oil |
$XOI |
1,570.26 |
-25.48 |
-1.60% |
+33.28% |
| Semiconductor |
$SOX |
3,269.82 |
-155.13 |
-4.53% |
-17.14% |
| Networking |
$NWX |
883.04 |
-19.58 |
-2.17% |
-9.07% |
| Broker/Dealer |
$XBD |
462.69 |
-8.00 |
-1.70% |
-4.97% |
| Retail |
$RLX |
3,835.44 |
-61.05 |
-1.57% |
-9.25% |
| Gold & Silver |
$XAU |
158.09 |
-4.17 |
-2.57% |
+19.36% |
| Bank |
$BKX |
121.31 |
-1.24 |
-1.01% |
-8.25% |
| Biotech |
$BTK |
5,229.99 |
-53.18 |
-1.01% |
-5.23% |
|
|
|
 |
50-Day Moving Average Violation Triggered Technical Sell Signal
Kenneth J. Gruneisen - Passed the CAN SLIM® Master's Exam
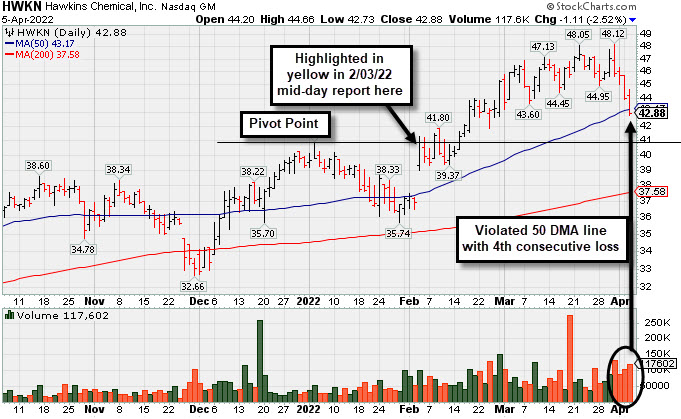
Hawkins Inc (HWKN -$1.11 or -2.52% to $42.88) violated its 50-day moving average (DMA) line today triggering a technical sell signal as it suffered a 4th consecutive loss with above average volume after a noted "negative reversal" at its all-time high. Only a prompt rebound above the 50 DMA line would help its outlook improve.
HWKN was highlighted in yellow with pivot point cited based on its 1/04/22 high plus 10 cents in the 2/03/22 mid-day report (read here). It was last covered in greater detail on 3/15/22 with an annotated graph under the headline, "Hovering Near High After Rising From Prior Base".
Bullish action came after it reported Dec '21 quarterly earnings +26% on +31% sales revenues versus the year ago period. Three of the 4 latest quarterly comparisons showed earnings increases above the +25% minimum guideline (C criteria) with a strong sales revenues growth rate. Annual earnings growth (A criteria) has been strong after a downturn in FY '18. It has an Earnings Per Share Rating of 91.
There are only 21.1 million shares outstanding (S criteria) which contribute to greater price volatility in the event of institutional buying or selling. The number of top-rated funds owning its shares rose from 326 in Mar '21 to 343 in Dec '21, a reassuring sign concerning the I criteria. The current Up/Down Volume Ratio of 0.9 is an unbiased indication its shares have been under distributional pressure over the past 50 days. The company hails from the CHEMICALS - Basic Chemicals industry group which is currently ranked 60th on the 187 Industry Groups list (L criteria). It has a Timeliness Rating of B and Sponsorship Rating of B. |
|
|
Color Codes Explained :
Y - Better candidates highlighted by our
staff of experts.
G - Previously featured
in past reports as yellow but may no longer be buyable under the
guidelines.
***Last / Change / Volume data in this table is the closing quote data***
|
|
|
THESE ARE NOT BUY RECOMMENDATIONS!
Comments contained in the body of this report are technical
opinions only. The material herein has been obtained
from sources believed to be reliable and accurate, however,
its accuracy and completeness cannot be guaranteed.
This site is not an investment advisor, hence it does
not endorse or recommend any securities or other investments.
Any recommendation contained in this report may not
be suitable for all investors and it is not to be deemed
an offer or solicitation on our part with respect to
the purchase or sale of any securities. All trademarks,
service marks and trade names appearing in this report
are the property of their respective owners, and are
likewise used for identification purposes only.
This report is a service available
only to active Paid Premium Members.
You may opt-out of receiving report notifications
at any time. Questions or comments may be submitted
by writing to Premium Membership Services 665 S.E. 10 Street, Suite 201 Deerfield Beach, FL 33441-5634 or by calling 1-800-965-8307
or 954-785-1121.
|
|
|