You are not logged in.
This means you
CAN ONLY VIEW reports that were published prior to Wednesday, April 9, 2025.
You
MUST UPGRADE YOUR MEMBERSHIP if you want to see any current reports.
AFTER MARKET UPDATE - TUESDAY, MARCH 15TH, 2022
Previous After Market Report Next After Market Report >>>
|
|
|
|
DOW |
+599.10 |
33,544.34 |
+1.82% |
|
Volume |
1,175,072,706 |
-1% |
|
Volume |
5,375,941,700 |
-8% |
|
NASDAQ |
+367.40 |
12,948.62 |
+2.92% |
|
Advancers |
2,214 |
69% |
|
Advancers |
2,633 |
61% |
|
S&P 500 |
+89.34 |
4,262.45 |
+2.14% |
|
Decliners |
981 |
31% |
|
Decliners |
1,663 |
39% |
|
Russell 2000 |
+27.25 |
1,968.97 |
+1.40% |
|
52 Wk Highs |
27 |
|
|
52 Wk Highs |
28 |
|
|
S&P 600 |
+13.36 |
1,282.98 |
+1.05% |
|
52 Wk Lows |
390 |
|
|
52 Wk Lows |
561 |
|
|
The major averages are in a continuing market correction (M criteria) and sputtering near lows for the year. Followers of the fact-based investment system know to patiently watch for a solid follow-through day to confirm a new uptrend before any new buying efforts may be justified.
|
 |
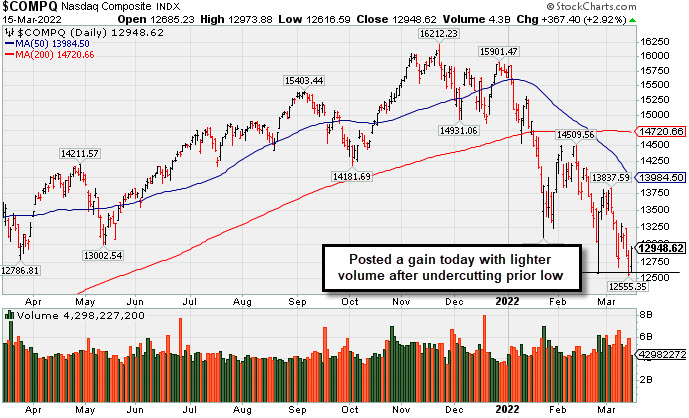
Major Averages Rose With Lighter Volume
Kenneth J. Gruneisen - Passed the CAN SLIM® Master's Exam
The Dow climbed 599 points, while the S&P 500 jumped 2.1%. The Nasdaq Composite rallied 2.9%, clawing out of bear market territory (defined as a 20% drawdown from a recent peak). Volume totals reported were lighter than the prior session on the NYSE and on the Nasdaq exchange, revealing lackluster institutional buying demand. Advancers led decliners by more than a 2-1 margin on the NYSE and 5-3 on the Nasdaq exchange. There were 17 high-ranked companies from the Leaders List that hit new 52-week highs and were listed on the BreakOuts Page, versus 16 on the prior session. New 52-week lows totals solidly outnumbered shrinking new 52-week highs totals on the NYSE and on the Nasdaq exchange. The market averages (M criteria) are in a "correction" and disciplined investors are reminded to reduce exposure and raise cash.
 PICTURED: The Nasdaq Composite Index posted a gain with lighter volume after slumping to a new 2022 low with higher volume on the prior session.
U.S. stocks finished firmly higher on Tuesday as concerns surrounding persistent price pressures were somewhat alleviated by an in-line inflation reading and another drop in oil prices. West Texas Intermediate crude retreated 7.4% to $95.40/barrel, closing below $100/barrel for the first time since February 28, as the latest wave of the pandemic in China dampened the outlook for energy demand from the world’s second-largest economy. Signs that Iran nuclear talks could resume also provided a headwind to oil prices.
On the data front, the Producer Price Index (PPI) increased 10% year-over-year in February, matching consensus estimates and January’s annual gain. Core PPI (excluding food and energy) jumped a smaller-than-anticipated 8.4% year-over-year during the month. Elsewhere, the empire manufacturing survey unexpectedly dropped to -11.8 in March, the lowest reading since May 2020. Meanwhile, the Federal Reserve is widely anticipated to raise its benchmark rate for the first time since 2018 at the conclusion of their two-day policy meeting tomorrow. Treasuries were mixed, with the yield on the 10-year note up one basis point (0.01%) to 2.15%, its highest level since May 2019.
Ten of 11 S&P 500 sectors are trading in positive territory, with Energy the lone laggard. Technology and Consumer Discretionary shares outperformed, as growth-related shares rebounded. Airline operators were also among the standouts, benefitting from a slide in oil prices and positive commentary from some of the largest U.S. carriers. |
 Kenneth J. Gruneisen started out as a licensed stockbroker in August 1987, a couple of months prior to the historic stock market crash that took the Dow Jones Industrial Average down -22.6% in a single day. He has published daily fact-based fundamental and technical analysis on high-ranked stocks online for two decades. Through FACTBASEDINVESTING.COM, Kenneth provides educational articles, news, market commentary, and other information regarding proven investment systems that work in good times and bad.
Comments contained in the body of this report are technical opinions only and are not necessarily those of Gruneisen Growth Corp. The material herein has been obtained from sources believed to be reliable and accurate, however, its accuracy and completeness cannot be guaranteed. Our firm, employees, and customers may effect transactions, including transactions contrary to any recommendation herein, or have positions in the securities mentioned herein or options with respect thereto. Any recommendation contained in this report may not be suitable for all investors and it is not to be deemed an offer or solicitation on our part with respect to the purchase or sale of any securities. |
|
 |
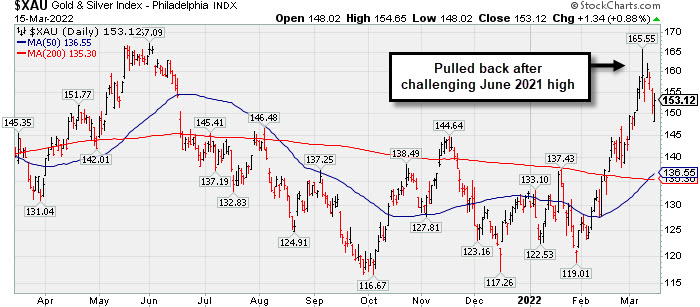
Retail, Tech, and Financial Groups Rose
Kenneth J. Gruneisen - Passed the CAN SLIM® Master's Exam
A big gain for the Retail Index ($RLX +3.30%) had a positive influence on the major averages while the Broker/Dealer Index ($XBD +1.53%) and Bank Index ($BKX +0.77%) also posted gains. The Semiconductor Index ($SOX +4.36%) was a standout gainer and the Networking Index ($NWX +2.97%) posted a solid gain while the Biotech Index ($BTK +1.16%) also rose. Commodity-linked groups were mixed as the Oil Services Index ($OSX -3.75%) and Integrated Oil Index ($XOI -2.67%) both fell while the Gold & Silver Index ($XAU +0.88%) posted a small gain. PICTURED: The Gold & Silver Index ($XAU +0.88%) pulled back after challenging its June 2021 high.
| Oil Services |
$OSX |
73.38 |
-2.86 |
-3.75% |
+39.19% |
| Integrated Oil |
$XOI |
1,440.71 |
-39.57 |
-2.67% |
+22.28% |
| Semiconductor |
$SOX |
3,180.24 |
+132.74 |
+4.36% |
-19.41% |
| Networking |
$NWX |
833.74 |
+24.07 |
+2.97% |
-14.14% |
| Broker/Dealer |
$XBD |
447.17 |
+6.73 |
+1.53% |
-8.15% |
| Retail |
$RLX |
3,661.35 |
+117.10 |
+3.30% |
-13.37% |
| Gold & Silver |
$XAU |
153.12 |
+1.34 |
+0.88% |
+15.61% |
| Bank |
$BKX |
125.74 |
+0.96 |
+0.77% |
-4.90% |
| Biotech |
$BTK |
4,732.12 |
+54.46 |
+1.16% |
-14.25% |
|
|
|
 |
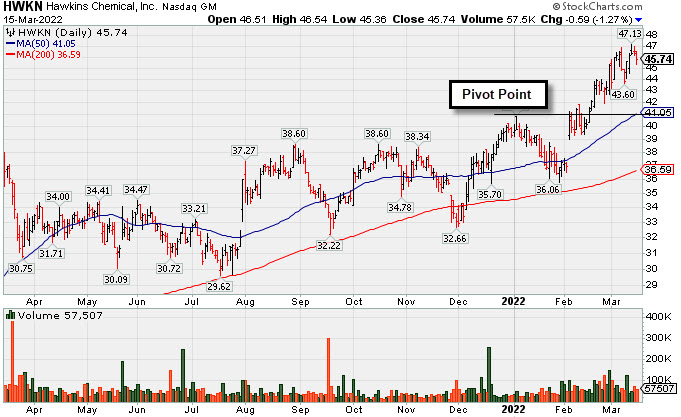
Hovering Near High After Rising From Prior Base
Kenneth J. Gruneisen - Passed the CAN SLIM® Master's Exam
Hawkins Inc (HWKN -$0.59 or -1.27% to $45.74) is hovering near its all-time high, extended from any sound base. Prior highs in the $40 area coincide with its 50-day moving average (DMA) line defining important near-term support to watch on pullbacks.
HWKN was highlighted in yellow with pivot point cited based on its 1/04/22 high plus 10 cents in the 2/03/22 mid-day report (read here). It was last covered in greater detail on 2/18/22 with an annotated graph under the headline, "Extended From Prior Base After 6th Consecutive Gain".
Bullish action came after it reported Dec '21 quarterly earnings +26% on +31% sales revenues versus the year ago period. Three of the 4 latest quarterly comparisons showed earnings increases above the +25% minimum guideline (C criteria) with a strong sales revenues growth rate. Annual earnings growth (A criteria) has been strong after a downturn in FY '18. It has an Earnings Per Share Rating of 91.
There are only 21.1 million shares outstanding (S criteria) which contribute to greater price volatility in the event of institutional buying or selling. The number of top-rated funds owning its shares rose from 326 in Mar '21 to 340 in Dec '21, a reassuring sign concerning the I criteria. The current Up/Down Volume Ratio of 1.3 is an unbiased indication its shares have been under accumulation over the past 50 days. The company hails from the CHEMICALS - Basic Chemicals industry group which is currently ranked 28th on the 187 Industry Groups list (L criteria). It has a Timeliness Rating of A and Sponsorship Rating of B. |
|
|
Color Codes Explained :
Y - Better candidates highlighted by our
staff of experts.
G - Previously featured
in past reports as yellow but may no longer be buyable under the
guidelines.
***Last / Change / Volume data in this table is the closing quote data***
Symbol/Exchange
Company Name
Industry Group |
PRICE |
CHANGE
(%Change) |
Day High |
Volume
(% DAV)
(% 50 day avg vol) |
52 Wk Hi
% From Hi |
Featured
Date |
Price
Featured |
Pivot Featured |
|
Max Buy |
 REGN
-
NASDAQ
REGN
-
NASDAQ
Regeneron Pharmaceutical
DRUGS - Biotechnology
|
$665.93
|
+9.52
1.45% |
$668.94
|
760,696
101.97% of 50 DAV
50 DAV is 746,000
|
$686.62
-3.01%
|
3/14/2022
|
$647.95
|
PP = $673.96
|
|
MB = $707.66
|
 Most Recent Note - 3/15/2022 4:49:12 PM
Y - Posted a 5th consecutive gain today with near average volume, approaching its December highs. Color code was changed to yellow with new pivot point cited based on its 12/14/21 high plus 10 cents. Subsequent gains above the pivot point backed by at least +40% above average volume may trigger a technical buy signal Recently found support above its 200 DMA line ($608). Prior lows in the $592-596 area define important near-term support. Disciplined investors know to avoid new buying efforts until a confirmed rally with follow through day from the major averages (M criteria) under the fact-based investment system's strict rules.
>>> FEATURED STOCK ARTICLE : Still Quietly Consolidating Above 200 DMA Line - 3/2/2022 |
View all notes |
Set NEW NOTE alert |
Company Profile |
SEC
News |
Chart |
Request a new note
C
A
S
I |
TGH
-
NYSE
Textainer Group Holdings
TRANSPORTATION - Logistics
|
$36.92
|
+0.93
2.58% |
$37.07
|
249,753
53.83% of 50 DAV
50 DAV is 464,000
|
$41.89
-11.86%
|
1/31/2022
|
$36.68
|
PP = $41.34
|
|
MB = $43.41
|
Most Recent Note - 3/15/2022 4:50:25 PM
G - Sputtering below its 50 DMA line ($37.54) and it faces resistance due to overhead supply up to the $41 level. Important near-term support to watch is its 200 DMA line ($35) and prior lows. Any violations would raise serious concerns and trigger technical sell signals. Fundamentals remain strong. See the latest FSU analysis for more details and an annotated graph.
>>> FEATURED STOCK ARTICLE : Slumped Below 50-Day Moving Average Line Toward Prior Lows - 3/14/2022 |
View all notes |
Set NEW NOTE alert |
Company Profile |
SEC
News |
Chart |
Request a new note
C
A
S
I |
HWKN
-
NASDAQ
Hawkins Inc
CHEMICALS - Basic Chemicals
|
$45.74
|
-0.59
-1.27% |
$46.54
|
57,507
94.27% of 50 DAV
50 DAV is 61,000
|
$47.13
-2.95%
|
2/3/2022
|
$39.81
|
PP = $41.07
|
|
MB = $43.12
|
Most Recent Note - 3/15/2022 4:46:11 PM
G - Hovering near its all-time high, extended from the previously noted base. Prior highs in the $40 area and its 50 DMA line define important near-term support to watch on pullbacks. See the latest FSU analysis for more details and a new annotated graph.
>>> FEATURED STOCK ARTICLE : Hovering Near High After Rising From Prior Base - 3/15/2022 |
View all notes |
Set NEW NOTE alert |
Company Profile |
SEC
News |
Chart |
Request a new note
C
A
S
I |
IMXI
-
NASDAQ
International Money Exp
Financial Svcs-Specialty
|
$18.34
|
+0.34
1.89% |
$18.36
|
349,760
138.79% of 50 DAV
50 DAV is 252,000
|
$18.96
-3.27%
|
3/8/2022
|
$18.64
|
PP = $19.06
|
|
MB = $20.01
|
Most Recent Note - 3/15/2022 4:48:04 PM
Y - Posted a 5th volume-driven gain in the span of 7 sessions, closing within striking distance of its all-time high. Highlighted in yellow in the 3/08/22 mid-day report with pivot point cited based on its 8/30/21 high plus 10 cents. Through Dec '21 its quarterly and annual earnings (C and A criteria) history has been strong. Small supply of only 32.2 million shares in the public float (S criteria) can contribute to greater price volatility in the event of institutional buying or selling. Disciplined investors know to avoid new buying efforts until a confirmed rally with follow through day from the major averages (M criteria) under the fact-based investment system's strict rules.
>>> FEATURED STOCK ARTICLE : Volume-Driven Gains Challenged All-Time High - 3/8/2022 |
View all notes |
Set NEW NOTE alert |
Company Profile |
SEC
News |
Chart |
Request a new note
C
A
S
I |
|
|
|
THESE ARE NOT BUY RECOMMENDATIONS!
Comments contained in the body of this report are technical
opinions only. The material herein has been obtained
from sources believed to be reliable and accurate, however,
its accuracy and completeness cannot be guaranteed.
This site is not an investment advisor, hence it does
not endorse or recommend any securities or other investments.
Any recommendation contained in this report may not
be suitable for all investors and it is not to be deemed
an offer or solicitation on our part with respect to
the purchase or sale of any securities. All trademarks,
service marks and trade names appearing in this report
are the property of their respective owners, and are
likewise used for identification purposes only.
This report is a service available
only to active Paid Premium Members.
You may opt-out of receiving report notifications
at any time. Questions or comments may be submitted
by writing to Premium Membership Services 665 S.E. 10 Street, Suite 201 Deerfield Beach, FL 33441-5634 or by calling 1-800-965-8307
or 954-785-1121.
|
|
|