You are not logged in.
This means you
CAN ONLY VIEW reports that were published prior to Tuesday, April 1, 2025.
You
MUST UPGRADE YOUR MEMBERSHIP if you want to see any current reports.
AFTER MARKET UPDATE - THURSDAY, JANUARY 31ST, 2019
Previous After Market Report Next After Market Report >>>
|
|
|
|
DOW |
-15.19 |
24,999.67 |
-0.06% |
|
Volume |
1,395,451,080 |
+66% |
|
Volume |
2,909,056,200 |
+15% |
|
NASDAQ |
+98.66 |
7,281.74 |
+1.37% |
|
Advancers |
2,056 |
68% |
|
Advancers |
1,976 |
64% |
|
S&P 500 |
+23.05 |
2,704.10 |
+0.86% |
|
Decliners |
948 |
32% |
|
Decliners |
1,101 |
36% |
|
Russell 2000 |
+12.48 |
1,499.42 |
+0.84% |
|
52 Wk Highs |
133 |
|
|
52 Wk Highs |
76 |
|
|
S&P 600 |
+7.83 |
934.12 |
+0.85% |
|
52 Wk Lows |
7 |
|
|
52 Wk Lows |
27 |
|
|
 |
Major Indices Posted Solid January Gains
Kenneth J. Gruneisen - Passed the CAN SLIM® Master's Exam
The Dow finished with a 7.2% monthly increase. The S&P 500 climbed 7.9% for its best January since 1987. The Nasdaq finished with a monthly gain of 9.7%. Stocks finished mostly higher on Thursday. The Dow slipped 15 points to 24,999, while the S&P 500 added 23 points to 2,704. The Nasdaq advanced 98 points to 7,281. The volume totals were higher than the prior session on both the NYSE and the Nasdaq exchange. Breadth was positive as advancers led decliners by a 2-1 margin on the NYSE and nearly a 2-1 margin on the Nasdaq exchange. There were 25 high-ranked companies from the Leaders List that made a new 52-week high and were listed on the BreakOuts Page, versus the total of 21 on the prior session. New 52-week highs totals expanded and solidly outnumbered new 52-week lows on the NYSE and on the Nasdaq exchange versus the prior session. The major indices are in a confirmed uptrend after recently noted improvements helped to signal a change in market direction (M criteria) back to a bullish stance. The Featured Stocks Page provides the most timely analysis on high-ranked leaders. Charts used courtesy of www.stockcharts.com
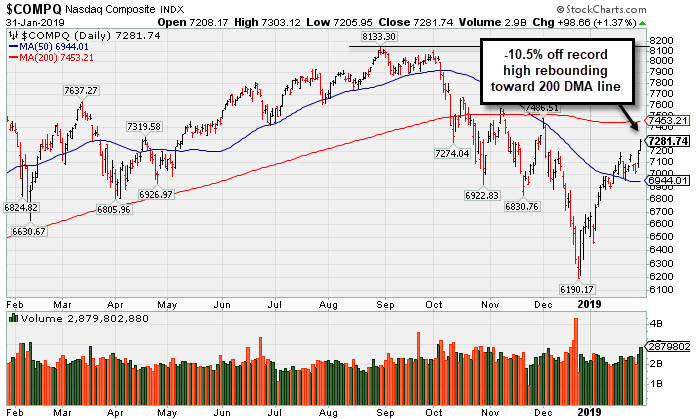
PICTURED: The Nasdaq Composite Index is -10.5% off its record high, rebounding toward its 200-day moving average (DMA) line.
The S&P 500 capped its best monthly performance in more than three years as investors digested a flurry of corporate earnings updates. The Communications Services group paced the gains with Facebook (FB +10.8%) rising after the social media giant’s quarterly release topped analyst expectations. General Electric (GE +11.65%) rebounded as the recently downtrodden Industrial company bested consensus revenue projections. Microsoft (MSFT -1.83%) fell after narrowly missing Wall Street sales predictions, leaving the company as the second largest public corporation by market capitalization. Amazon (AMZN +2.89%) took over the top spot, ahead of its earnings report after the closing bell.
Geopolitical concerns were also in focus, as the U.S. and China wrapped up their second day of high-level trade negotiations in Washington. Multiple sources reported that officials are planning a late-February meeting between Presidents Donald Trump and Premier Xi Jinping. On the data front, a report showed initial jobless claims increased to a 16-month high of 253,000 in the final week of the partial government shutdown. A separate update showed new home sales surged 16.9% in November, snapping a streak of disappointing real estate releases.
Treasuries strengthened for a second day following the news, with the yield on the 10-year note down six basis points to 2.63%. In commodities, WTI crude price eased 0.6% on the session, but rallied more than 18% for the best January performance on record. |
 Kenneth J. Gruneisen started out as a licensed stockbroker in August 1987, a couple of months prior to the historic stock market crash that took the Dow Jones Industrial Average down -22.6% in a single day. He has published daily fact-based fundamental and technical analysis on high-ranked stocks online for two decades. Through FACTBASEDINVESTING.COM, Kenneth provides educational articles, news, market commentary, and other information regarding proven investment systems that work in good times and bad.
Comments contained in the body of this report are technical opinions only and are not necessarily those of Gruneisen Growth Corp. The material herein has been obtained from sources believed to be reliable and accurate, however, its accuracy and completeness cannot be guaranteed. Our firm, employees, and customers may effect transactions, including transactions contrary to any recommendation herein, or have positions in the securities mentioned herein or options with respect thereto. Any recommendation contained in this report may not be suitable for all investors and it is not to be deemed an offer or solicitation on our part with respect to the purchase or sale of any securities. |
|
 |
Retail, Biotech, Networking, and Commodity-Linked Groups Rose
Kenneth J. Gruneisen - Passed the CAN SLIM® Master's Exam
The Retail Index ($RLX +1.60%) posted a solid gain while the Broker/Dealer Index ($XBD +0.36%) edged higher but the Bank Index ($BKX -1.02%) ended lower. The tech sector was led higher by the Biotech Index ($BTK +1.18%) and the Networking Index ($NWX +0.80%) while the Semiconductor Index ($SOX +0.03%) finished flat. The Gold & Silver Index ($XAU +2.38%) and Integrated Oil Index ($XOI +1.21%) rose but the Oil Services Index ($OSX -1.41%) fell.
Charts courtesy of www.stockcharts.com
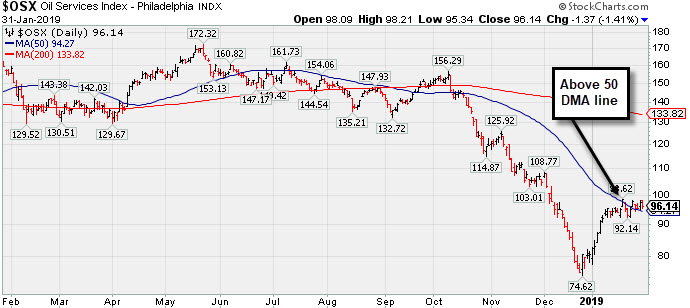 PICTURED: The Oil Services Index ($OSX -1.41%) is consolidating above its 50-day moving average (DMA) line.
| Oil Services |
$OSX |
96.14 |
-1.37 |
-1.40% |
+19.28% |
| Integrated Oil |
$XOI |
1,284.01 |
+15.33 |
+1.21% |
+10.78% |
| Semiconductor |
$SOX |
1,272.09 |
+0.33 |
+0.03% |
+10.12% |
| Networking |
$NWX |
535.07 |
+4.27 |
+0.80% |
+9.49% |
| Broker/Dealer |
$XBD |
257.21 |
+0.92 |
+0.36% |
+8.37% |
| Retail |
$RLX |
2,151.79 |
+33.82 |
+1.60% |
+10.27% |
| Gold & Silver |
$XAU |
76.30 |
+1.77 |
+2.37% |
+7.98% |
| Bank |
$BKX |
96.46 |
-0.99 |
-1.02% |
+12.44% |
| Biotech |
$BTK |
4,888.02 |
+57.19 |
+1.18% |
+15.81% |
|
|
|
 |
Consolidating Above 50-Day Moving Average
Kenneth J. Gruneisen - Passed the CAN SLIM® Master's Exam
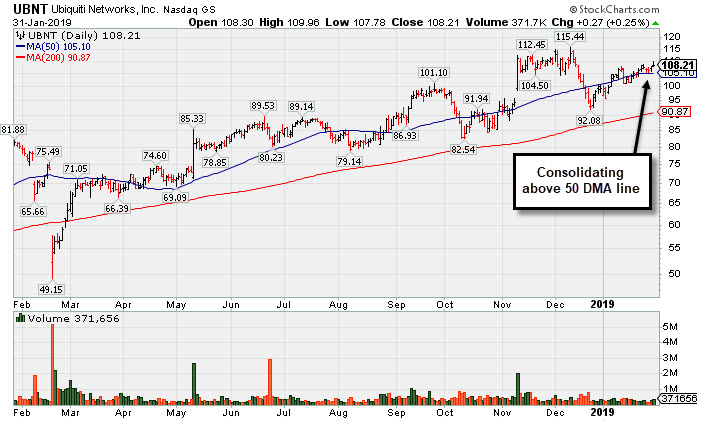
Ubiquiti Networks Inc (UBNT+$0.27 or +0.25% to $108.21) is consolidating above its 50-day moving average (DMA) line. It has shown resilience since last shown in this FSU section on 1/15/19 with an annotated graph under the headline, "Sputtering Below 50-Day Moving Average Again". It quickly got extended more than +5% above the prior high and finished strong after highlighted in yellow in the 11/09/18 mid-day report with new pivot point cited based on its 9/25/18 high plus 10 cents (read here). The big gain for a new high with nearly 4 times average volume triggered a technical buy signal. Keep in mind that it is due to report earnings on 2/08/19. Volume and volatility often increase near earnings news. Bullish action came after it reported earnings +27% on +15% sales revenues for the Sep '18 quarter, marking its 3rd consecutive quarterly comparison above the +25% minimum earnings guideline (C criteria), helping it better match the fact-based investment system's fundamental guidelines. The number of top-rated funds owning its shares rose from 262 in Dec '17 to 305 in Dec '18, a reassuring sign concerning the I criteria. Its current Up/Down Volume ratio of 0.9 is an unbiased indication its shares have been under slight distributional pressure over the past 50 days. Its small supply of only 14.9 million shares (S criteria) in the public float can contribute to greater price volatility in the event of institutional buying or selling. It has earned a B Timeliness Rating and B Sponsorship Rating. It hails from the Telecom - Infrastructure Industry Group which has an B+ Group Relative Strength Rating, a reassuring sign concerning the L criteria. After a small downturn in FY '15 its annual earnings (A criteria) growth has been strong. That fundamental shortcoming had a role in limiting its appearances since UBNT was shown in this FSU section on 4/20/12 with an annotated graph under the headline, "Formed a New Ascending Base But Did Not Confirm New Buy Signal".
Chart courtesy of www.stockcharts.com
 |
|
|
Color Codes Explained :
Y - Better candidates highlighted by our
staff of experts.
G - Previously featured
in past reports as yellow but may no longer be buyable under the
guidelines.
***Last / Change / Volume data in this table is the closing quote data***
Symbol/Exchange
Company Name
Industry Group |
PRICE |
CHANGE
(%Change) |
Day High |
Volume
(% DAV)
(% 50 day avg vol) |
52 Wk Hi
% From Hi |
Featured
Date |
Price
Featured |
Pivot Featured |
|
Max Buy |
MLR
-
NYSE
Miller Industries Inc
AUTOMOTIVE - Auto Parts
|
$30.05
|
+0.60
2.04% |
$30.24
|
20,119
54.38% of 50 DAV
50 DAV is 37,000
|
$30.00
0.17%
|
11/30/2018
|
$28.35
|
PP = $29.50
|
|
MB = $30.98
|
Most Recent Note - 1/29/2019 5:43:31 PM
Y - Held its ground today with light volume. Subsequent gains above the pivot point backed by at least +40% above average volume may help clinch a proper technical buy signal. Its 50 DMA line and recent low define near-term support to watch on pullbacks. See the latest FSU analysis for more details and a new annotated graph.
>>> FEATURED STOCK ARTICLE : Traded Above Pivot Point Recently Without Great Volume - 1/29/2019 |
View all notes |
Set NEW NOTE alert |
Company Profile |
SEC
News |
Chart |
Request a new note
C
A
S
I |
LHCG
-
NASDAQ
L H C Group Inc
HEALTH SERVICES - Home Health Care
|
$105.73
|
+0.59
0.56% |
$107.33
|
188,698
72.02% of 50 DAV
50 DAV is 262,000
|
$109.33
-3.29%
|
1/23/2019
|
$107.29
|
PP = $107.61
|
|
MB = $112.99
|
Most Recent Note - 1/28/2019 5:33:57 PM
Y - Pulled back for a 2nd small loss with light volume, remaining perched very near its high. Highlighted in yellow with pivot point cited based on its 11/29/18 high plus 10 cents in the 1/23/18 mid-day report after an 8-week cup shaped base. Subsequent gains above the pivot point backed by at least +40% above average volume may trigger a technical buy signal.
>>> FEATURED STOCK ARTICLE : Healthcare Services Firm Reached a New High - 1/23/2019 |
View all notes |
Set NEW NOTE alert |
Company Profile |
SEC
News |
Chart |
Request a new note
C
A
S
I |
BSTC
-
NASDAQ
Biospecifics Technologie
Medical-Biomed/Biotech
|
$64.98
|
+0.68
1.06% |
$65.97
|
32,915
84.40% of 50 DAV
50 DAV is 39,000
|
$68.00
-4.44%
|
1/18/2019
|
$67.40
|
PP = $66.31
|
|
MB = $69.63
|
Most Recent Note - 1/28/2019 5:56:47 PM
Y - Thinly traded Biomed/Biotech firm has recently been sputtering below its pivot point. Confirming volume-driven gains for a new high close would be a reassuring sign of institutional accumulation.
>>> FEATURED STOCK ARTICLE : Thinly Traded Biotech Shows Signs of Accumulation - 1/18/2019 |
View all notes |
Set NEW NOTE alert |
Company Profile |
SEC
News |
Chart |
Request a new note
C
A
S
I |
UBNT
-
NASDAQ
Ubiquiti Networks
TELECOMMUNICATIONS - Diversified Communication Serv
|
$108.21
|
+0.27
0.25% |
$109.96
|
371,654
106.80% of 50 DAV
50 DAV is 348,000
|
$115.44
-6.26%
|
11/9/2018
|
$108.20
|
PP = $101.43
|
|
MB = $106.50
|
 Most Recent Note - 1/31/2019 5:59:57 PM
G - Still quietly consolidating above its 50 DMA line ($105.10). Faces some resistance due to overhead supply up to the $115 level. Prior low ($92.08 on 12/24/18) defines the next important support. See the latest FSU analysis for more details and a new annotated graph.
>>> FEATURED STOCK ARTICLE : Consolidating Above 50-Day Moving Average - 1/31/2019 |
View all notes |
Set NEW NOTE alert |
Company Profile |
SEC
News |
Chart |
Request a new note
C
A
S
I |
NOW
-
NYSE
Servicenow Inc
Computer Sftwr-Enterprse
|
$220.02
|
+26.02
13.41% |
$228.41
|
11,169,943
532.66% of 50 DAV
50 DAV is 2,097,000
|
$206.30
6.65%
|
1/31/2019
|
$218.14
|
PP = $206.40
|
|
MB = $216.72
|
Most Recent Note - 1/31/2019 1:04:16 PM
Y - Color code is changed to yellow with pivot point cited based on its 9/113/18 high plus 10 cents. Today's big "breakaway gap" cleared the prior high after it reported earnings +79% on +30% sales revenues for the Dec '18 quarter, continuing its strong earnings track record. Prior mid-day report noted - "Volume and volatility often increase near earnings news."
>>> FEATURED STOCK ARTICLE : Found Support at 50-Day Average After Slump Into Prior Base - 10/3/2018 |
View all notes |
Set NEW NOTE alert |
Company Profile |
SEC
News |
Chart |
Request a new note
C
A
S
I |
Symbol/Exchange
Company Name
Industry Group |
PRICE |
CHANGE
(%Change) |
Day High |
Volume
(% DAV)
(% 50 day avg vol) |
52 Wk Hi
% From Hi |
Featured
Date |
Price
Featured |
Pivot Featured |
|
Max Buy |
PYPL
-
NASDAQ
Paypal Holdings Inc
Finance-CrdtCard/PmtPr
|
$88.76
|
-3.66
-3.96% |
$90.09
|
23,676,279
258.98% of 50 DAV
50 DAV is 9,142,000
|
$94.58
-6.15%
|
1/24/2019
|
$92.56
|
PP = $93.80
|
|
MB = $98.49
|
Most Recent Note - 1/31/2019 1:07:09 PM
Y - Gapped down today after reporting +25% earnings on +13% sales revenues for the Dec '18 quarter. Volume and volatility often increase near earnings news. Disciplined investors note that the recent gains above the pivot point lacked the +40% above average volume needed to trigger a proper technical buy signal.
>>> FEATURED STOCK ARTICLE : Perched Within Striking Distance of High Ahead of Earnings News - 1/24/2019 |
View all notes |
Set NEW NOTE alert |
Company Profile |
SEC
News |
Chart |
Request a new note
C
A
S
I |
ALRM
-
NASDAQ
Alarm.com Holdings Inc
Security/Sfty
|
$62.93
|
+0.89
1.43% |
$63.07
|
492,266
101.50% of 50 DAV
50 DAV is 485,000
|
$63.72
-1.24%
|
1/22/2019
|
$60.52
|
PP = $60.30
|
|
MB = $63.32
|
Most Recent Note - 1/29/2019 5:50:03 PM
Y - Volume was light today while staying perched at its all-time high. Recent gains for new highs lacked great volume conviction. Prior highs define initial support to watch on pullbacks.
>>> FEATURED STOCK ARTICLE : Pullback Broke Steak of Gains and Reversed From New High - 1/22/2019 |
View all notes |
Set NEW NOTE alert |
Company Profile |
SEC
News |
Chart |
Request a new note
C
A
S
I |
PLNT
-
NYSE
Planet Fitness Inc Cl A
Leisure-Services
|
$57.92
|
-0.13
-0.22% |
$58.21
|
1,174,801
96.85% of 50 DAV
50 DAV is 1,213,000
|
$59.52
-2.69%
|
11/7/2018
|
$57.10
|
PP = $55.45
|
|
MB = $58.22
|
Most Recent Note - 1/30/2019 8:21:44 PM
Y - Still consolidating below its "max buy" level and holding its ground in a tight range near its all-time high. Its 50 DMA line ($55.04) defines important near-term support to watch above the recent low ($48).
>>> FEATURED STOCK ARTICLE : Hovering in a Tight Range Near All-Time High - 1/25/2019 |
View all notes |
Set NEW NOTE alert |
Company Profile |
SEC
News |
Chart |
Request a new note
C
A
S
I |
TEAM
-
NASDAQ
Atlassian Corp Plc Cl A
Comp Sftwr-Spec Enterprs
|
$98.40
|
+3.39
3.57% |
$100.00
|
2,260,404
133.51% of 50 DAV
50 DAV is 1,693,000
|
$100.00
-1.60%
|
1/7/2019
|
$94.68
|
PP = $98.31
|
|
MB = $103.23
|
Most Recent Note - 1/31/2019 1:09:49 PM
Y - Volume is running at an above average pace today while matching its all-time high. Subsequent gains and a strong close above the pivot point backed by at least +40% above average volume may help to clinch a convincing technical buy signal. Its 50 DMA line ($86.21) and prior low define near-term support to watch on pullbacks. Fundamentals remain strong.
>>> FEATURED STOCK ARTICLE : Volume Light While Hovering Near High - 1/28/2019 |
View all notes |
Set NEW NOTE alert |
Company Profile |
SEC
News |
Chart |
Request a new note
C
A
S
I |
MEDP
-
NASDAQ
Medpace Holdings Inc
Medical-Research Eqp/Svc
|
$64.40
|
+0.50
0.78% |
$64.99
|
802,432
108.14% of 50 DAV
50 DAV is 742,000
|
$65.09
-1.06%
|
1/30/2019
|
$64.10
|
PP = $65.19
|
|
MB = $68.45
|
Most Recent Note - 1/30/2019 8:13:08 PM
Y - Rallied near its 52-week high with +57% above average volume behind today's big gain. Color code was changed to yellow with pivot point cited based on its 9/17/18 high plus 10 cents. Subsequent gains above the pivot point backed by at least +40% above average volume may trigger a technical buy signal. Fundamentals remain strong. The 200 DMA line acted as support above the prior low and it has rebounded since dropped from the Featured Stocks list on 12/19/18. See the latest FSU analysis for more details and a new annotated graph.
>>> FEATURED STOCK ARTICLE : Rallied Near 52-Week High With a Volume-Driven Gain - 1/30/2019 |
View all notes |
Set NEW NOTE alert |
Company Profile |
SEC
News |
Chart |
Request a new note
C
A
S
I |
Symbol/Exchange
Company Name
Industry Group |
PRICE |
CHANGE
(%Change) |
Day High |
Volume
(% DAV)
(% 50 day avg vol) |
52 Wk Hi
% From Hi |
Featured
Date |
Price
Featured |
Pivot Featured |
|
Max Buy |
INVA
-
NASDAQ
Innoviva Inc
Medical-Biomed/Biotech
|
$17.10
|
-1.12
-6.15% |
$18.40
|
4,715,117
426.71% of 50 DAV
50 DAV is 1,105,000
|
$20.54
-16.75%
|
11/23/2018
|
$17.74
|
PP = $18.09
|
|
MB = $18.99
|
Most Recent Note - 1/31/2019 6:01:38 PM
G - Violated the prior high ($18.60 on 12/03/18) and its 50 DMA line ($17.90) with 2 consecutive volume-driven losses triggering a technical sell signal.
>>> FEATURED STOCK ARTICLE : Perched at High Following Volume-Driven Gains - 1/17/2019 |
View all notes |
Set NEW NOTE alert |
Company Profile |
SEC
News |
Chart |
Request a new note
C
A
S
I |
|
|
|
THESE ARE NOT BUY RECOMMENDATIONS!
Comments contained in the body of this report are technical
opinions only. The material herein has been obtained
from sources believed to be reliable and accurate, however,
its accuracy and completeness cannot be guaranteed.
This site is not an investment advisor, hence it does
not endorse or recommend any securities or other investments.
Any recommendation contained in this report may not
be suitable for all investors and it is not to be deemed
an offer or solicitation on our part with respect to
the purchase or sale of any securities. All trademarks,
service marks and trade names appearing in this report
are the property of their respective owners, and are
likewise used for identification purposes only.
This report is a service available
only to active Paid Premium Members.
You may opt-out of receiving report notifications
at any time. Questions or comments may be submitted
by writing to Premium Membership Services 665 S.E. 10 Street, Suite 201 Deerfield Beach, FL 33441-5634 or by calling 1-800-965-8307
or 954-785-1121.
|
|
|

