You are not logged in.
This means you
CAN ONLY VIEW reports that were published prior to Tuesday, April 1, 2025.
You
MUST UPGRADE YOUR MEMBERSHIP if you want to see any current reports.
AFTER MARKET UPDATE - WEDNESDAY, JANUARY 26TH, 2022
Previous After Market Report Next After Market Report >>>
|
|
|
|
DOW |
-129.64 |
34,168.09 |
-0.38% |
|
Volume |
1,152,630,498 |
-0% |
|
Volume |
5,713,661,400 |
+16% |
|
NASDAQ |
+2.82 |
13,542.12 |
+0.02% |
|
Advancers |
1,011 |
31% |
|
Advancers |
1,417 |
32% |
|
S&P 500 |
-6.52 |
4,349.93 |
-0.15% |
|
Decliners |
2,212 |
69% |
|
Decliners |
2,972 |
68% |
|
Russell 2000 |
-27.57 |
1,976.46 |
-1.38% |
|
52 Wk Highs |
44 |
|
|
52 Wk Highs |
34 |
|
|
S&P 600 |
-19.06 |
1,277.61 |
-1.47% |
|
52 Wk Lows |
193 |
|
|
52 Wk Lows |
376 |
|
|
Damaging losses for the major averages recently signaled a market correction (M criteria). Greater caution is advised until strength returns. Disciplined investors know to avoid new buying efforts and to raise cash by selling faltering stocks on a case-by-case basis.
|
 |
Major Averages Slump Again and Fail to Hold Session's Gains
Kenneth J. Gruneisen - Passed the CAN SLIM® Master's Exam
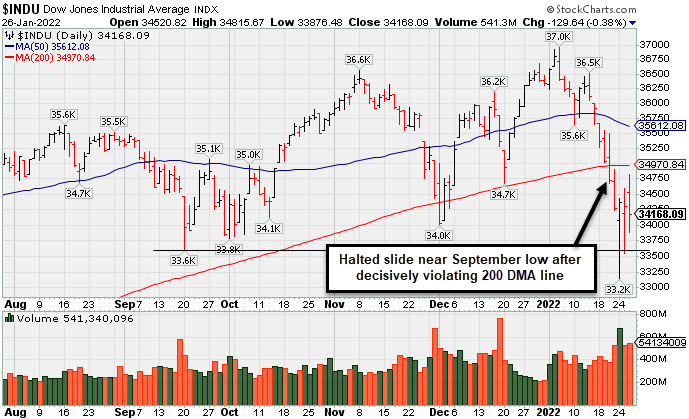
The Dow lost 129 points, erasing a more than 500-point early session gain. The S&P 500 slipped 0.2%, wiping out a morning advance of over 2%. The Nasdaq Composite closed little changed. Volume totals reported were near the prior session on the NYSE and clearly higher on the Nasdaq exchange. Decliners led advancers by more than a 2-1 margin on the NYSE and on the Nasdaq exchange. There were 12 high-ranked companies from the Leaders List that hit new 52-week highs and were listed on the BreakOuts Page, versus 4 on the prior session. New 52-week lows totals rose again and easily outnumbered new 52-week highs on the NYSE and on the Nasdaq exchange. The market averages (M criteria) have seen damaging losses noted that signaled a more serious market correction. Greater caution is suggested until noted strength returns. PICTURED: The Dow Jones Industrial Average halted its slide near its September low after decisively violating its 200-day moving average (DMA) line. At Monday's low it was -10.3% off its January 5 record high. Thursday marks Day 4 of the rally attempt - an important time for all disciplined investors now watching for a follow-through day to confirm a new uptrend.
U.S. stocks finished mostly lower in volatile trading Wednesday as investors digested the Federal Reserve’s (Fed) policy decision. As expected, committee members set the stage for an interest rate hike in March as the central bank shifts its priority to combating elevated inflation. Fed officials also generally laid the groundwork for “significantly reducing” its nearly $9 trillion balance sheet sometime after liftoff, pivoting away from ultra-loose monetary policy implemented during the pandemic. Following the decision, Fed Chair Jerome Powell’s remarks were construed as hawkish, as he characterized inflation as “slightly worse” than in December and declined to rule out a rate increase at every meeting.
Nine of 11 S&P 500 sectors ended in negative territory, with bond proxy Real Estate leading decliners. Technology shares bucked the downtrend on solid earnings. Microsoft Corp. (MSFT +2.85%) rose after the Tech titan topped analyst profit and revenue estimates and offered a positive current-quarter outlook amid strength in its cloud services segment. Corning Inc. (GLW +11.16%) rose as the materials science company delivered upbeat growth forecasts.
Treasuries slumped, with the yield on the 10-year note up nine basis points (0.09%) to 1.87%, while the more Fed-sensitive two-year note yield spiked 13 basis points (0.13%) to 1.16%-a 23-month peak. In FOREX trading, a gauge of the U.S. dollar rallied 0.6%. On the data front, new home sales jumped 11.9% to a nine-month high in December. |
 Kenneth J. Gruneisen started out as a licensed stockbroker in August 1987, a couple of months prior to the historic stock market crash that took the Dow Jones Industrial Average down -22.6% in a single day. He has published daily fact-based fundamental and technical analysis on high-ranked stocks online for two decades. Through FACTBASEDINVESTING.COM, Kenneth provides educational articles, news, market commentary, and other information regarding proven investment systems that work in good times and bad.
Comments contained in the body of this report are technical opinions only and are not necessarily those of Gruneisen Growth Corp. The material herein has been obtained from sources believed to be reliable and accurate, however, its accuracy and completeness cannot be guaranteed. Our firm, employees, and customers may effect transactions, including transactions contrary to any recommendation herein, or have positions in the securities mentioned herein or options with respect thereto. Any recommendation contained in this report may not be suitable for all investors and it is not to be deemed an offer or solicitation on our part with respect to the purchase or sale of any securities. |
|
 |
Gold & Silver and Retail Indexes Lost Ground
Kenneth J. Gruneisen - Passed the CAN SLIM® Master's Exam
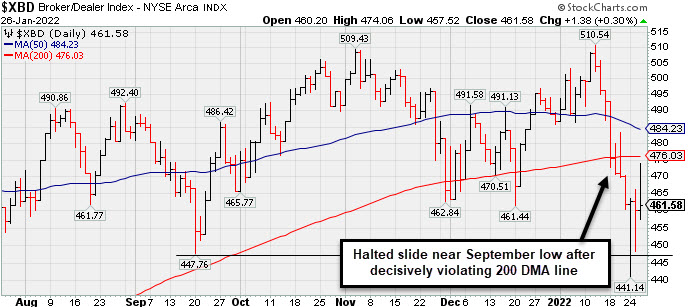
The Broker/Dealer Index ($XBD +0.30%) and Bank Index ($BKX +0.28%) both eked out small gains, but another solid loss for the Retail Index ($RLX -0.94%) created a drag on the major averages. The Gold & Silver Index ($XAU -3.12%) suffered a bigger loss. Energy-linked groups were mixed and little changed as the Oil Services Index ($OSX +0.27%) and Integrated Oil Index ($XOI -0.16%) held their recent gains. The tech sector was mixed as the Semiconductor Index ($SOX +1.68%) posted a solid gain while the Networking Index ($NWX -0.58%) and Biotech Index ($BTK -0.72%) both edged lower.
PICTURED: The Broker/Dealer Index ($XBD +0.30%) halted its slide near the September low after abruptly slumping well below its 50 and 200 DMA lines.
| Oil Services |
$OSX |
65.49 |
+0.18 |
+0.27% |
+24.23% |
| Integrated Oil |
$XOI |
1,375.06 |
-2.24 |
-0.16% |
+16.71% |
| Semiconductor |
$SOX |
3,407.00 |
+56.15 |
+1.68% |
-13.66% |
| Networking |
$NWX |
847.21 |
-4.93 |
-0.58% |
-12.76% |
| Broker/Dealer |
$XBD |
461.58 |
+1.38 |
+0.30% |
-5.19% |
| Retail |
$RLX |
3,598.73 |
-34.11 |
-0.94% |
-14.85% |
| Gold & Silver |
$XAU |
125.81 |
-4.06 |
-3.12% |
-5.02% |
| Bank |
$BKX |
134.66 |
+0.37 |
+0.28% |
+1.85% |
| Biotech |
$BTK |
4,886.77 |
-35.20 |
-0.72% |
-11.45% |
|
|
|
 |
Featured Stocks
Kenneth J. Gruneisen - Passed the CAN SLIM® Master's Exam
|
|
|
Color Codes Explained :
Y - Better candidates highlighted by our
staff of experts.
G - Previously featured
in past reports as yellow but may no longer be buyable under the
guidelines.
***Last / Change / Volume data in this table is the closing quote data***
|
|
|
THESE ARE NOT BUY RECOMMENDATIONS!
Comments contained in the body of this report are technical
opinions only. The material herein has been obtained
from sources believed to be reliable and accurate, however,
its accuracy and completeness cannot be guaranteed.
This site is not an investment advisor, hence it does
not endorse or recommend any securities or other investments.
Any recommendation contained in this report may not
be suitable for all investors and it is not to be deemed
an offer or solicitation on our part with respect to
the purchase or sale of any securities. All trademarks,
service marks and trade names appearing in this report
are the property of their respective owners, and are
likewise used for identification purposes only.
This report is a service available
only to active Paid Premium Members.
You may opt-out of receiving report notifications
at any time. Questions or comments may be submitted
by writing to Premium Membership Services 665 S.E. 10 Street, Suite 201 Deerfield Beach, FL 33441-5634 or by calling 1-800-965-8307
or 954-785-1121.
|
|
|