Symbol/Exchange
Company Name
Industry Group |
PRICE |
CHANGE
(%Change) |
Day High |
Volume
(% DAV)
(% 50 day avg vol) |
52 Wk Hi
% From Hi |
Featured
Date |
Price
Featured |
Pivot Featured |
|
Max Buy |
ARMH
-
NASDAQ
A R M Holdings Plc Ads
ELECTRONICS - Semiconductor - Specialized
|
$49.37
|
+1.79
3.76% |
$49.74
|
2,180,592
134.09% of 50 DAV
50 DAV is 1,626,200
|
$55.26
-10.66%
|
12/23/2013
|
$54.59
|
PP = $52.48
|
|
MB = $55.10
|
 Most Recent Note - 1/14/2014 5:19:20 PM
G - Rebounded with a gain on higher volume finishing near its 50 DMA line ($49.43) which may now act as resistance following damaging losses which triggered technical sell signals. Disciplined investors always limit losses by selling any stock that falls more than -7% from their purchase price.
>>> FEATURED STOCK ARTICLE : No Overhead Supply Remains Following Volume-Driven Breakout - 12/23/2013
View all notes |
Set NEW NOTE alert |
CANSLIM.net Company Profile |
SEC
News |
Chart |
Request a new note
C
A N
S L
I M


|
BITA
-
NYSE
Bitauto Hldgs Ltd Ads
INTERNET - Internet Information Providers
|
$35.33
|
+0.89
2.58% |
$35.75
|
1,070,666
79.43% of 50 DAV
50 DAV is 1,347,900
|
$39.25
-9.99%
|
1/8/2014
|
$33.00
|
PP = $35.14
|
|
MB = $36.90
|
Most Recent Note - 1/13/2014 3:29:55 PM
G - Encountering distributional pressure this afternoon, it reversed into the red after early gains beyond its "max buy" level. Pyramiding is a tactic taught in the Certification designed to let the market action dictate your entries while proper discipline suggests that gains above a stock's pivot point should have at least +40% above average volume to trigger a valid technical buy signal.
>>> FEATURED STOCK ARTICLE : Finished Strong and Challenged Pivot Point After Highlighted in Mid-Day Report - 1/8/2014
View all notes |
Set NEW NOTE alert |
CANSLIM.net Company Profile |
SEC
News |
Chart |
Request a new note
C
A N
S L
I M
|
CELG
-
NASDAQ
Celgene Corp
DRUGS - Drug Manufacturers - Major
|
$167.04
|
+2.14
1.30% |
$167.63
|
3,893,899
140.89% of 50 DAV
50 DAV is 2,763,700
|
$174.66
-4.36%
|
9/12/2013
|
$149.50
|
PP = $150.02
|
|
MB = $157.52
|
Most Recent Note - 1/13/2014 12:48:57 PM
G - Touched a new 52-week high today followed by a "negative reversal" for a loss on high volume. Its 50 DMA line which acted as support recently. Subsequent violations would raise greater concerns and trigger technical sell signals.
>>> FEATURED STOCK ARTICLE : Found Support Above 50-Day Average After Gapping Down on Prior Session - 1/7/2014
View all notes |
Set NEW NOTE alert |
CANSLIM.net Company Profile |
SEC
News |
Chart |
Request a new note
C
A N
S L
I M
|
EGOV
-
NASDAQ
N I C Inc
INTERNET - Internet Software and Services
|
$23.86
|
+0.63
2.71% |
$23.99
|
134,692
48.89% of 50 DAV
50 DAV is 275,500
|
$25.99
-8.20%
|
12/20/2013
|
$24.00
|
PP = $26.09
|
|
MB = $27.39
|
Most Recent Note - 1/13/2014 3:32:15 PM
G - Color code is changed to green while sputtering below its 50 DMA line. A rally above recent resistance in the $25-26 area is needed for its technical stance to turn bullish. Meanwhile, a violation of the recent low ($22.17 on 12/16/13) would raise concern as that level defines near-term support above its 200 DMA line.
>>> FEATURED STOCK ARTICLE : Rebounded Above 50-Day Average; Relative Strength Rating Waned - 12/27/2013
View all notes |
Set NEW NOTE alert |
CANSLIM.net Company Profile |
SEC
News |
Chart |
Request a new note
C
A N
S L
I M
|
EQM
-
NYSE
E Q T Midstream Partners
ENERGY - Oil and Gas Pipelines
|
$61.25
|
+0.86
1.42% |
$61.58
|
30,439
25.51% of 50 DAV
50 DAV is 119,300
|
$60.62
1.04%
|
12/12/2013
|
$53.17
|
PP = $56.51
|
|
MB = $59.34
|
Most Recent Note - 1/13/2014 5:03:54 PM
G - Inched higher with today's 4th consecutive gain on light volume, getting more extended from any sound base pattern.
>>> FEATURED STOCK ARTICLE : Finding Support Near 50-Day Moving Average While Perched Near Highs - 12/13/2013
View all notes |
Set NEW NOTE alert |
CANSLIM.net Company Profile |
SEC
News |
Chart |
Request a new note
C
A N
S L
I M
|
Symbol/Exchange
Company Name
Industry Group |
PRICE |
CHANGE
(%Change) |
Day High |
Volume
(% DAV)
(% 50 day avg vol) |
52 Wk Hi
% From Hi |
Featured
Date |
Price
Featured |
Pivot Featured |
|
Max Buy |
FB
-
NASDAQ
Facebook Inc Cl A
INTERNET
|
$57.74
|
+1.83
3.27% |
$57.78
|
37,479,439
51.96% of 50 DAV
50 DAV is 72,128,700
|
$58.96
-2.07%
|
12/12/2013
|
$51.40
|
PP = $54.93
|
|
MB = $57.68
|
Most Recent Note - 1/14/2014 5:25:22 PM
G - Color code is changed to green after wedging above its "max buy" level with a gain today on light volume. Prior highs in the $54 area acted as support during its recent consolidation. Rallied from a 9-week cup shaped base without a handle after completing a Public Offering on 12/20/13. Disciplined investors always limit losses by selling any stock that falls more than -7% from their purchase price.
>>> FEATURED STOCK ARTICLE : Well Known Social Media Firm on Watch List While Still Base Building - 12/12/2013
View all notes |
Set NEW NOTE alert |
CANSLIM.net Company Profile |
SEC
News |
Chart |
Request a new note
C
A N
S L
I M
|
FLT
-
NYSE
Fleetcor Technologies
DIVERSIFIED SERVICES - Business/Management Services
|
$113.38
|
-0.12
-0.11% |
$113.90
|
1,519,436
199.24% of 50 DAV
50 DAV is 762,600
|
$123.96
-8.54%
|
8/19/2013
|
$99.01
|
PP = $100.97
|
|
MB = $106.02
|
Most Recent Note - 1/14/2014 12:16:27 PM
G - Slumping below its 50 DMA line with losses on higher volume this week raising concerns. Only a prompt rebound above its 50 DMA line would help its outlook improve.
>>> FEATURED STOCK ARTICLE : Enduring Distributional Pressure While Extended From Sound Base - 12/17/2013
View all notes |
Set NEW NOTE alert |
CANSLIM.net Company Profile |
SEC
News |
Chart |
Request a new note
C
A N
S L
I M
|
GNRC
-
NYSE
Generac Hldgs Inc
CONSUMER DURABLES - Electronic Equipment
|
$55.15
|
+0.97
1.79% |
$55.23
|
416,129
67.67% of 50 DAV
50 DAV is 614,900
|
$57.29
-3.74%
|
11/26/2013
|
$53.02
|
PP = $52.42
|
|
MB = $55.04
|
Most Recent Note - 1/8/2014 12:34:25 PM
G - Enduring mild distributional pressure while consolidating -4.0% off its all-time high. Prior highs in the $52 area define initial support to watch on pullbacks.
>>> FEATURED STOCK ARTICLE : Volume Totals Cooling While Holding Ground Near Highs - 1/2/2014
View all notes |
Set NEW NOTE alert |
CANSLIM.net Company Profile |
SEC
News |
Chart |
Request a new note
C
A N
S L
I M
|
HLF
-
NYSE
Herbalife Ltd
DRUGS - Nutrition and Weight Management
|
$80.79
|
+0.95
1.19% |
$80.88
|
1,238,805
44.06% of 50 DAV
50 DAV is 2,811,900
|
$83.51
-3.26%
|
11/22/2013
|
$72.21
|
PP = $75.04
|
|
MB = $78.79
|
Most Recent Note - 1/13/2014 5:12:51 PM
G - Pulled back toward its "max buy" level with today's loss following 5 consecutive gains. Found support above prior highs in the $74 area during its recent consolidation. Disciplined investors always limit losses if any stock falls more than -7% from their purchase price.
>>> FEATURED STOCK ARTICLE : Volume Totals Cooling While Perched Near Highs - 12/30/2013
View all notes |
Set NEW NOTE alert |
CANSLIM.net Company Profile |
SEC
News |
Chart |
Request a new note
C
A N
S L
I M
|
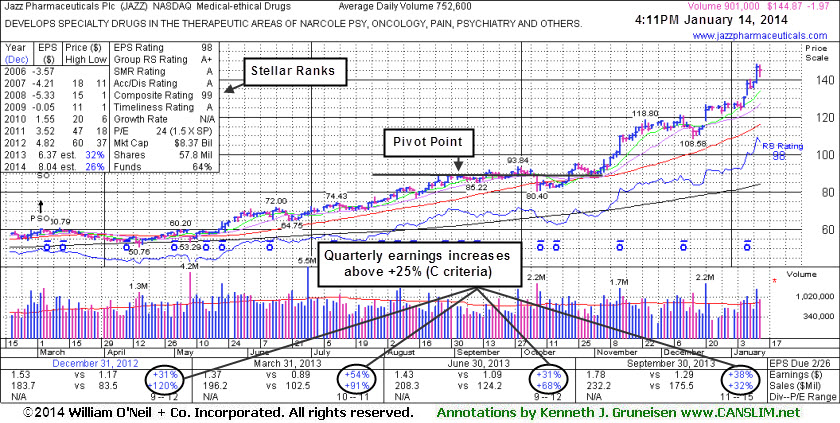
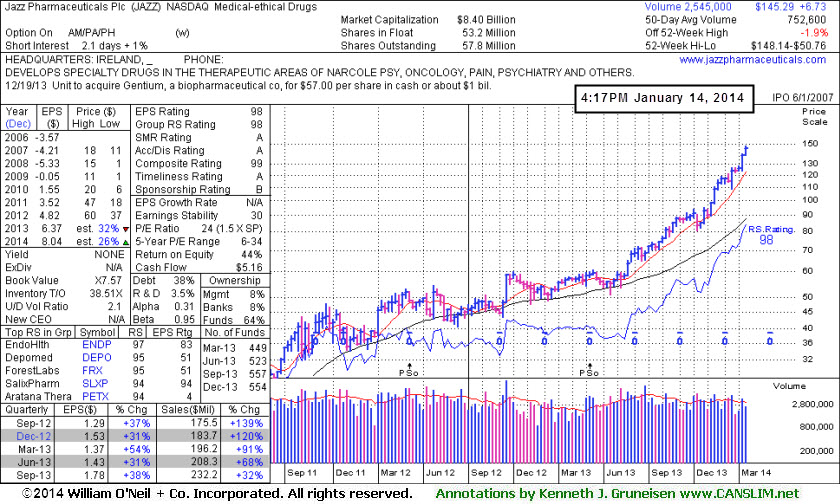
JAZZ
-
NASDAQ
Jazz Pharmaceuticals Plc
DRUGS - Biotechnology
|
$145.48
|
-1.36
-0.93% |
$148.01
|
1,005,487
133.60% of 50 DAV
50 DAV is 752,600
|
$148.14
-1.80%
|
9/30/2013
|
$93.20
|
PP = $89.10
|
|
MB = $93.56
|
Most Recent Note - 1/14/2014 5:15:53 PM
G - Perched at its 52-week high, holding its ground stubbornly after considerable volume-driven gains, extended from any sound base. Its 50 DMA line defines important support to watch on pullbacks. See the latest FSU analysis for more details and a new annotated graph.
>>> FEATURED STOCK ARTICLE : Very Extended From Sound Base Following Big Volume-Driven Gains - 1/14/2014
View all notes |
Set NEW NOTE alert |
CANSLIM.net Company Profile |
SEC
News |
Chart |
Request a new note
C
A N
S L
I M
|
Symbol/Exchange
Company Name
Industry Group |
PRICE |
CHANGE
(%Change) |
Day High |
Volume
(% DAV)
(% 50 day avg vol) |
52 Wk Hi
% From Hi |
Featured
Date |
Price
Featured |
Pivot Featured |
|
Max Buy |
KORS
-
NYSE
Michael Kors Hldgs Ltd
RETAIL - Apparel Stores
|
$77.05
|
+0.38
0.50% |
$77.78
|
2,315,716
50.37% of 50 DAV
50 DAV is 4,597,500
|
$84.58
-8.90%
|
8/6/2013
|
$69.66
|
PP = $66.28
|
|
MB = $69.59
|
Most Recent Note - 1/13/2014 3:38:45 PM
G - Quietly slumping further below its 50 DMA line today. Damaging losses on above average volume last week indicated distributional pressure.
>>> FEATURED STOCK ARTICLE : Technical Deterioration and RS Rating Slump Raises Concerns - 1/9/2014
View all notes |
Set NEW NOTE alert |
CANSLIM.net Company Profile |
SEC
News |
Chart |
Request a new note
C
A N
S L
I M
|
MRLN
-
NASDAQ
Marlin Business Services
DIVERSIFIED SERVICES - Rental and Leasing Services
|
$27.76
|
+0.24
0.85% |
$27.98
|
15,445
52.36% of 50 DAV
50 DAV is 29,500
|
$28.64
-3.07%
|
12/19/2013
|
$26.69
|
PP = $28.74
|
|
MB = $30.18
|
Most Recent Note - 1/9/2014 6:01:51 PM
Y - Posted a 6th consecutive gain today. Perched within close striking distance of its 52-week high with little resistance remaining due to overhead supply. Subsequent volume-driven gains above the pivot point are needed to trigger a proper new technical buy signal. Its Relative Strength (RS) Rating at 77 remains below the 80+ minimum guideline for buy candidates.
>>> FEATURED STOCK ARTICLE : Finished Weak While Enduring Distributional Pressure - 12/19/2013
View all notes |
Set NEW NOTE alert |
CANSLIM.net Company Profile |
SEC
News |
Chart |
Request a new note
C
A N
S L
I M
|
PCLN
-
NASDAQ
Priceline.Com Inc
INTERNET - Internet Software and Services
|
$1,159.21
|
+19.49
1.71% |
$1,160.90
|
624,019
104.53% of 50 DAV
50 DAV is 597,000
|
$1,198.75
-3.30%
|
12/18/2013
|
$1,156.20
|
PP = $1,198.85
|
|
MB = $1,258.79
|
Most Recent Note - 1/13/2014 5:09:06 PM
Y - Enduring mild distributional pressure while still consolidating near its 50 DMA line which has recently acted as support. Subsequent damaging losses below its prior low ($1,113.01 on 1/06/13) would raise greater concerns.
>>> FEATURED STOCK ARTICLE : Managed Positive Reversal at 50-Day Moving Average Line - 1/6/2014
View all notes |
Set NEW NOTE alert |
CANSLIM.net Company Profile |
SEC
News |
Chart |
Request a new note
C
A N
S L
I M
|
RGR
-
NYSE
Sturm Ruger & Co Inc
CONSUMER DURABLES - Sporting Goods
|
$83.81
|
+1.33
1.61% |
$84.19
|
718,876
227.13% of 50 DAV
50 DAV is 316,500
|
$84.16
-0.42%
|
1/8/2014
|
$78.87
|
PP = $80.38
|
|
MB = $84.40
|
Most Recent Note - 1/14/2014 12:29:38 PM
Y - Up again today while on track for a 7th consecutive gain with volume running at an above average pace. Gains with above average volume while rallying above its pivot point confirmed a technical buy signal. Rallied since highlighted in yellow at $78.87 in the 1/08/14 mid-day report (read here). Pyramiding is a smart tactic taught in the Certification designed to let the market action dictate your entries. See the latest FSU analysis for more details and an annotated weekly graph.
>>> FEATURED STOCK ARTICLE : Hit New Highs With 6th Consecutive Gain - 1/13/2014
View all notes |
Set NEW NOTE alert |
CANSLIM.net Company Profile |
SEC
News |
Chart |
Request a new note
C
A N
S L
I M
|
SFUN
-
NYSE
Soufun Hldgs Ltd Ads A
INTERNET - Internet Information Providers
|
$88.46
|
+1.68
1.94% |
$88.97
|
917,433
76.52% of 50 DAV
50 DAV is 1,198,900
|
$93.49
-5.38%
|
10/17/2013
|
$58.02
|
PP = $53.87
|
|
MB = $56.56
|
Most Recent Note - 1/10/2014 5:54:24 PM
G - Perched near its all-time high, extended from any sound base. See the latest FSU analysis for more details and new annotated graphs.
>>> FEATURED STOCK ARTICLE : Extended From Base Following More Volume-Driven Gains - 1/10/2014
View all notes |
Set NEW NOTE alert |
CANSLIM.net Company Profile |
SEC
News |
Chart |
Request a new note
C
A N
S L
I M
|
Symbol/Exchange
Company Name
Industry Group |
PRICE |
CHANGE
(%Change) |
Day High |
Volume
(% DAV)
(% 50 day avg vol) |
52 Wk Hi
% From Hi |
Featured
Date |
Price
Featured |
Pivot Featured |
|
Max Buy |
SILC
-
NASDAQ
Silicom Ltd
COMPUTER HARDWARE - Networking andamp; Communication Dev
|
$46.99
|
+0.24
0.51% |
$47.08
|
44,322
134.72% of 50 DAV
50 DAV is 32,900
|
$47.15
-0.34%
|
12/23/2013
|
$44.62
|
PP = $46.25
|
|
MB = $48.56
|
Most Recent Note - 1/13/2014 1:21:24 PM
Y - Hitting another new 52-week high with today's 7th consecutive small gain, inching higher without especially great volume conviction. Volume should be a minimum of +40% above average behind gains above a stock's pivot point to trigger a proper technical buy signal.
>>> FEATURED STOCK ARTICLE : Stock With Small Supply Has Formed a Sound Base Pattern - 12/24/2013
View all notes |
Set NEW NOTE alert |
CANSLIM.net Company Profile |
SEC
News |
Chart |
Request a new note
C
A N
S L
I M
|
SSNC
-
NASDAQ
S S & C Technologies
COMPUTER SOFTWARE and SERVICES - Application Software
|
$45.74
|
+0.77
1.71% |
$45.84
|
108,135
35.71% of 50 DAV
50 DAV is 302,800
|
$46.61
-1.86%
|
10/22/2013
|
$39.17
|
PP = $40.04
|
|
MB = $42.04
|
Most Recent Note - 1/8/2014 1:05:43 PM
G - Adding to its recent spurt of gains and hitting a new 52-week high today, getting more extended from any sound base. Found recent support near its 50 DMA line.
>>> FEATURED STOCK ARTICLE : Found Prompt Support After Damaging Losses Raised Concerns - 12/16/2013
View all notes |
Set NEW NOTE alert |
CANSLIM.net Company Profile |
SEC
News |
Chart |
Request a new note
C
A N
S L
I M
|
SSYS
-
NASDAQ
Stratasys Ltd
COMPUTER HARDWARE - Computer Peripherals
|
$119.37
|
-10.63
-8.18% |
$126.41
|
5,804,745
505.11% of 50 DAV
50 DAV is 1,149,200
|
$138.10
-13.56%
|
10/11/2013
|
$102.94
|
PP = $105.38
|
|
MB = $110.65
|
Most Recent Note - 1/14/2014 1:59:14 PM
Gapped down today for a damaging loss and violated its 50 DMA line triggering a technical sell signal. Due to technical weakness and previously noted fundamental concerns it will be dropped from the Featured Stocks list tonight.
>>> FEATURED STOCK ARTICLE : Rallying From Support at 50-Day Moving Average Line - 12/20/2013
View all notes |
Set NEW NOTE alert |
CANSLIM.net Company Profile |
SEC
News |
Chart |
Request a new note
C
A N
S L
I M
|
ULTI
-
NASDAQ
Ultimate Software Group
INTERNET - Internet Software and Services
|
$154.37
|
+3.48
2.31% |
$154.97
|
189,727
143.41% of 50 DAV
50 DAV is 132,300
|
$162.88
-5.22%
|
10/16/2013
|
$142.95
|
PP = $151.18
|
|
MB = $158.74
|
Most Recent Note - 1/9/2014 3:21:22 PM
G - Consolidating near its 50 DMA line, it reversed into the red after early gains today. Recent low ($144.04 on 12/12/13) defines the next near-term support to watch.
>>> FEATURED STOCK ARTICLE : Gain on Light Volume While Inching Above 50-Day Average - 12/26/2013
View all notes |
Set NEW NOTE alert |
CANSLIM.net Company Profile |
SEC
News |
Chart |
Request a new note
C
A N
S L
I M
|
VRX
-
NYSE
Valeant Pharmaceuticals
DRUGS - Drug Manufacturers - Other
|
$135.01
|
+4.39
3.36% |
$135.33
|
1,756,232
143.99% of 50 DAV
50 DAV is 1,219,700
|
$135.73
-0.53%
|
9/11/2013
|
$100.26
|
PP = $105.50
|
|
MB = $110.78
|
Most Recent Note - 1/14/2014 5:21:55 PM
G - Best-ever close and finished near the session high today with a volume-driven gain. Its 50 DMA line and prior highs near $115 define near term support to watch.
>>> FEATURED STOCK ARTICLE : Rebounding With Volume Backed Gains But Fundamental Concerns Remain - 12/18/2013
View all notes |
Set NEW NOTE alert |
CANSLIM.net Company Profile |
SEC
News |
Chart |
Request a new note
C
A N
S L
I M
|
Symbol/Exchange
Company Name
Industry Group |
PRICE |
CHANGE
(%Change) |
Day High |
Volume
(% DAV)
(% 50 day avg vol) |
52 Wk Hi
% From Hi |
Featured
Date |
Price
Featured |
Pivot Featured |
|
Max Buy |
YNDX
-
NASDAQ
Yandex N V Class A
INTERNET - Internet Information Providers
|
$43.78
|
+1.13
2.65% |
$43.96
|
1,923,671
80.16% of 50 DAV
50 DAV is 2,399,700
|
$45.42
-3.61%
|
11/27/2013
|
$39.61
|
PP = $42.10
|
|
MB = $44.21
|
Most Recent Note - 1/14/2014 5:23:26 PM
Y - Hovering near its 52-week high following a volume-driven gain on 1/09/14 after a Morgan Stanley analysts raised their target price. Prior reports noted - "At least +40% above average volume should be behind gains above the pivot point to trigger a proper new technical buy signal."
>>> FEATURED STOCK ARTICLE : Best Ever Close With Gain on Light Volume - 12/31/2013
View all notes |
Set NEW NOTE alert |
CANSLIM.net Company Profile |
SEC
News |
Chart |
Request a new note
C
A N
S L
I M
|
YY
-
NASDAQ
YY Inc Ads
INTERNET - Internet Service Providers
|
$67.00
|
+4.23
6.74% |
$67.21
|
2,228,353
148.66% of 50 DAV
50 DAV is 1,499,000
|
$67.27
-0.40%
|
1/3/2014
|
$55.08
|
PP = $56.85
|
|
MB = $59.69
|
Most Recent Note - 1/14/2014 4:13:00 PM
G - Rallied with above average volume for a solid gain and new high close and finished near the session high, getting more extended from any sound base. Prior highs in the $56 area define initial support to watch on pullbacks.
>>> FEATURED STOCK ARTICLE : Finished Strong With High Volume After Featured in Mid-Day Report - 1/3/2014
View all notes |
Set NEW NOTE alert |
CANSLIM.net Company Profile |
SEC
News |
Chart |
Request a new note
C
A N
S L
I M
|