***Last / Change / Volume data in this table is the closing quote data***
Symbol/Exchange
Company Name
Industry Group |
PRICE |
CHANGE
(%Change) |
Day High |
Volume
(% DAV)
(% 50 day avg vol) |
52 Wk Hi
% From Hi |
Featured
Date |
Price
Featured |
Pivot Featured |
|
Max Buy |
ABV
-
NYSE
Comp De Bebidas Adr
FOOD and BEVERAGE - Beverages - Brewers
|
$29.34
|
-0.85
-2.82% |
$29.76
|
5,164,580
207.65% of 50 DAV
50 DAV is 2,487,200
|
$32.00
-8.31%
|
12/10/2010
|
$27.97
|
PP = $29.09
|
|
MB = $30.54
|
 Most Recent Note - 1/12/2011 4:30:06 PM
G - Gapped down today for a loss on heavy volume. Testing near prior highs in the $29 area that define important chart support to watch above its 50 DMA line. (Do not be confused by the 5:1 split impacting its share price as of 12/28/10. Previous data concerning 12/10/10 Featured Price, Pivot Point has been adjusted).
>>> The latest Featured Stock Update with an annotated graph appeared on 12/3/2010. Click here.
View all notes |
Alert me of new notes |
CANSLIM.net Company Profile |
SEC |
Zacks Reports |
StockTalk |
News |
Chart |
Request a new note
C
A N
S L
I M


|
ARUN
-
NASDAQ
Aruba Networks Inc
COMPUTER HARDWARE - Networking andamp; Communication Dev
|
$24.79
|
-0.16
-0.64% |
$25.45
|
2,216,621
89.80% of 50 DAV
50 DAV is 2,468,400
|
$25.96
-4.49%
|
1/3/2011
|
$22.55
|
PP = $24.38
|
|
MB = $25.60
|
Most Recent Note - 1/11/2011 1:36:38 PM
Y - Gapped up and hit another new 52-week and all-time high with today's second consecutive gain backed by above average volume triggering a convincing new (or add-on) technical buy signal.
>>> The latest Featured Stock Update with an annotated graph appeared on 12/14/2010. Click here.
View all notes |
Alert me of new notes |
CANSLIM.net Company Profile |
SEC |
Zacks Reports |
StockTalk |
News |
Chart |
Request a new note
C
A N
S L
I M
|
CACC
-
NASDAQ
Credit Acceptance Corp
FINANCIAL SERVICES - Credit Services
|
$59.00
|
-0.84
-1.40% |
$60.15
|
29,216
124.85% of 50 DAV
50 DAV is 23,400
|
$64.09
-7.94%
|
11/22/2010
|
$59.97
|
PP = $62.00
|
|
MB = $65.10
|
Most Recent Note - 1/12/2011 4:53:29 PM
G - Down today with slightly above average volume, a sign of mild distributional pressure while finishing at its lowest close since 11/19/10. Color code is changed to green after recent violation of prior lows and its 50 DMA line near $61 raised concerns.
>>> The latest Featured Stock Update with an annotated graph appeared on 12/20/2010. Click here.
View all notes |
Alert me of new notes |
CANSLIM.net Company Profile |
SEC |
Zacks Reports |
StockTalk |
News |
Chart |
Request a new note
C
A N
S L
I M
|
CIS
-
NYSE
Camelot Info Systems Ads
COMPUTER SOFTWARE andamp; SERVICES - Information Technology Service
|
$26.67
|
-0.06
-0.22% |
$27.65
|
439,366
97.99% of 50 DAV
50 DAV is 448,400
|
$28.18
-5.36%
|
11/26/2010
|
$18.93
|
PP = $19.72
|
|
MB = $20.71
|
Most Recent Note - 1/12/2011 4:54:46 PM
G - Held its ground today near its all-time high. It is extended from a sound base and yet no resistance remains due to overhead supply. On 12/09/10 it completed a Secondary Offering, after it was up considerably from its July 2010 IPO at $11.
>>> The latest Featured Stock Update with an annotated graph appeared on 1/11/2011. Click here.
View all notes |
Alert me of new notes |
CANSLIM.net Company Profile |
SEC |
Zacks Reports |
StockTalk |
News |
Chart |
Request a new note
C
A N
S L
I M
|
CMG
-
NYSE
Chipotle Mexican Grill
LEISURE - Restaurants
|
$217.67
|
-3.12
-1.41% |
$223.30
|
772,567
76.86% of 50 DAV
50 DAV is 1,005,200
|
$262.78
-17.16%
|
9/1/2010
|
$158.31
|
PP = $155.52
|
|
MB = $163.30
|
Most Recent Note - 1/12/2011 4:45:54 PM
G - Lingering below its 50 DMA line since its violation when gapping down on 12/27/10 triggered a technical sell signal hinting it may be due for a longer and deeper consolidation. Subsequent gains above its short-term average would help its outlook improve.
>>> The latest Featured Stock Update with an annotated graph appeared on 12/17/2010. Click here.
View all notes |
Alert me of new notes |
CANSLIM.net Company Profile |
SEC |
Zacks Reports |
StockTalk |
News |
Chart |
Request a new note
C
A N
S L
I M
|
Symbol/Exchange
Company Name
Industry Group |
PRICE |
CHANGE
(%Change) |
Day High |
Volume
(% DAV)
(% 50 day avg vol) |
52 Wk Hi
% From Hi |
Featured
Date |
Price
Featured |
Pivot Featured |
|
Max Buy |
DECK
-
NASDAQ
Deckers Outdoor Corp
CONSUMER NON-DURABLES - Textile - Apparel Footwear
|
$79.40
|
+0.34
0.43% |
$81.89
|
2,708,199
140.88% of 50 DAV
50 DAV is 1,922,300
|
$87.88
-9.65%
|
10/27/2010
|
$54.16
|
PP = $54.86
|
|
MB = $57.60
|
Most Recent Note - 1/10/2011 4:04:32 PM
G - Gain today with below average volume. Consolidating in recent weeks, extended from a sound base, and still well above its 50 DMA line that defines support to watch.
>>> The latest Featured Stock Update with an annotated graph appeared on 12/16/2010. Click here.
View all notes |
Alert me of new notes |
CANSLIM.net Company Profile |
SEC |
Zacks Reports |
StockTalk |
News |
Chart |
Request a new note
C
A N
S L
I M
|
EZCH
-
NASDAQ
Ezchip Semiconductor Ltd
ELECTRONICS - Semiconductor - Specialized
|
$31.96
|
+0.11
0.35% |
$32.25
|
242,016
89.90% of 50 DAV
50 DAV is 269,200
|
$32.15
-0.59%
|
12/2/2010
|
$27.53
|
PP = $26.00
|
|
MB = $27.30
|
Most Recent Note - 1/12/2011 4:47:20 PM
G - Inched higher for yet another new 52-week high with today's 3rd consecutive gain backed by near average volume. Prior chart highs in the $29 area define initial support to watch well above its 50 DMA line.
>>> The latest Featured Stock Update with an annotated graph appeared on 12/2/2010. Click here.
View all notes |
Alert me of new notes |
CANSLIM.net Company Profile |
SEC |
Zacks Reports |
StockTalk |
News |
Chart |
Request a new note
C
A N
S L
I M
|
EZPW
-
NASDAQ
Ezcorp Inc Cl A
SPECIALTY RETAIL - Specialty Retail, Other
|
$27.85
|
-0.22
-0.78% |
$28.22
|
215,849
57.35% of 50 DAV
50 DAV is 376,400
|
$28.75
-3.13%
|
11/5/2010
|
$24.02
|
PP = $23.85
|
|
MB = $25.04
|
Most Recent Note - 1/11/2011 2:55:53 PM
G - Consolidating in a tight trading range for the past 4 weeks, staying well above its 50 DMA line which defines important support.
>>> The latest Featured Stock Update with an annotated graph appeared on 12/29/2010. Click here.
View all notes |
Alert me of new notes |
CANSLIM.net Company Profile |
SEC |
Zacks Reports |
StockTalk |
News |
Chart |
Request a new note
C
A N
S L
I M
|
FFIV
-
NASDAQ
F 5 Networks Inc
INTERNET - Internet Software and Services
|
$142.61
|
-0.04
-0.03% |
$143.85
|
1,226,883
50.33% of 50 DAV
50 DAV is 2,437,900
|
$144.10
-1.03%
|
6/16/2010
|
$74.50
|
PP = $74.10
|
|
MB = $77.81
|
Most Recent Note - 1/10/2011 3:53:53 PM
G - It did not form a sound new base, yet its gain today has it poised for a new high close and testing its 52-week and all-time high. Recent lows define chart support just above its 50 DMA line.
>>> The latest Featured Stock Update with an annotated graph appeared on 12/28/2010. Click here.
View all notes |
Alert me of new notes |
CANSLIM.net Company Profile |
SEC |
Zacks Reports |
StockTalk |
News |
Chart |
Request a new note
C
A N
S L
I M
|
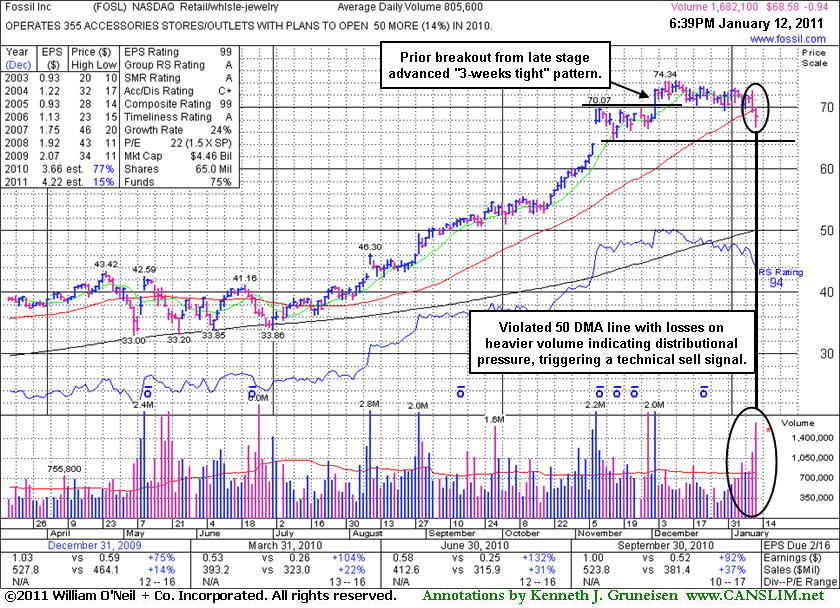
FOSL
-
NASDAQ
Fossil Inc
CONSUMER DURABLES - Recreational Goods, Other
|
$68.59
|
-0.94
-1.34% |
$70.02
|
1,690,109
209.80% of 50 DAV
50 DAV is 805,600
|
$74.34
-7.74%
|
11/26/2010
|
$69.10
|
PP = $70.17
|
|
MB = $73.68
|
Most Recent Note - 1/12/2011 4:43:10 PM
G - Closed below its 50 DMA line in the middle of its intra-day range as a small loss on 2 times average volume raised more concerns. Color code was changed to green due to its recent deterioration and general lack of progress since its 12/02/10 breakout from a "3-weeks tight" pattern. Finished near an upward trendline connecting its July - October lows, and any further deterioration may trigger a more worrisome technical sell signal.
>>> The latest Featured Stock Update with an annotated graph appeared on 1/12/2011. Click here.
View all notes |
Alert me of new notes |
CANSLIM.net Company Profile |
SEC |
Zacks Reports |
StockTalk |
News |
Chart |
Request a new note
C
A N
S L
I M
|
Symbol/Exchange
Company Name
Industry Group |
PRICE |
CHANGE
(%Change) |
Day High |
Volume
(% DAV)
(% 50 day avg vol) |
52 Wk Hi
% From Hi |
Featured
Date |
Price
Featured |
Pivot Featured |
|
Max Buy |
HMSY
-
NASDAQ
H M S Holdings Corp
COMPUTER SOFTWARE and SERVICES - Healthcare Information Service
|
$64.52
|
+0.45
0.70% |
$64.61
|
128,874
79.40% of 50 DAV
50 DAV is 162,300
|
$67.10
-3.85%
|
11/19/2010
|
$61.89
|
PP = $63.01
|
|
MB = $66.16
|
Most Recent Note - 1/11/2011 3:16:30 PM
G - Recently enduring distributional pressure while consolidating just above its 50 DMA line, while more damaging losses may trigger sell signals. Its waning Relative Strength rank has been noted as a concern.
>>> The latest Featured Stock Update with an annotated graph appeared on 1/3/2011. Click here.
View all notes |
Alert me of new notes |
CANSLIM.net Company Profile |
SEC |
Zacks Reports |
StockTalk |
News |
Chart |
Request a new note
C
A N
S L
I M
|
JOBS
-
NASDAQ
Fifty One Job Inc Ads
DIVERSIFIED SERVICES - Staffing and; Outsourcing Service
|
$58.25
|
-0.75
-1.27% |
$58.93
|
151,212
88.22% of 50 DAV
50 DAV is 171,400
|
$60.00
-2.92%
|
10/13/2010
|
$42.07
|
PP = $40.60
|
|
MB = $42.63
|
Most Recent Note - 1/12/2011 4:32:45 PM
G - Paused today after 5 consecutive gains lifted it to new all-time highs. It had not formed a sound new base, only having recently consolidated for just 4 weeks after a considerable rally from below $20 in July.
>>> The latest Featured Stock Update with an annotated graph appeared on 12/30/2010. Click here.
View all notes |
Alert me of new notes |
CANSLIM.net Company Profile |
SEC |
Zacks Reports |
StockTalk |
News |
Chart |
Request a new note
C
A N
S L
I M
|
LULU
-
NASDAQ
Lululemon Athletica
MANUFACTURING - Textile Manufacturing
|
$72.85
|
+5.61
8.34% |
$73.73
|
6,362,944
346.70% of 50 DAV
50 DAV is 1,835,300
|
$74.60
-2.35%
|
10/8/2010
|
$47.66
|
PP = $46.67
|
|
MB = $49.00
|
Most Recent Note - 1/12/2011 4:33:34 PM
G - Considerable gap up gain today with more than 3 times average volume following encouraging guidance, approaching its 52-week high. It did not form a sound new base and it is extended from its 50 DMA line.
>>> The latest Featured Stock Update with an annotated graph appeared on 12/1/2010. Click here.
View all notes |
Alert me of new notes |
CANSLIM.net Company Profile |
SEC |
Zacks Reports |
StockTalk |
News |
Chart |
Request a new note
C
A N
S L
I M
|
MWIV
-
NASDAQ
M W I Veterinary Supply
HEALTH SERVICES - Medical Instruments and; Supplies
|
$65.28
|
-0.87
-1.32% |
$66.94
|
73,523
142.49% of 50 DAV
50 DAV is 51,600
|
$67.13
-2.76%
|
11/4/2010
|
$61.79
|
PP = $59.60
|
|
MB = $62.58
|
Most Recent Note - 1/11/2011 2:58:05 PM
G - Recently inching to new highs without great volume conviction, it has not formed a sound base pattern. Its 50 DMA line defines support to watch.
>>> The latest Featured Stock Update with an annotated graph appeared on 12/21/2010. Click here.
View all notes |
Alert me of new notes |
CANSLIM.net Company Profile |
SEC |
Zacks Reports |
StockTalk |
News |
Chart |
Request a new note
C
A N
S L
I M
|
NEOG
-
NASDAQ
Neogen Corp
DRUGS - Diagnostic Substances
|
$39.48
|
+0.12
0.31% |
$41.02
|
127,446
126.43% of 50 DAV
50 DAV is 100,800
|
$43.14
-8.48%
|
9/1/2010
|
$30.79
|
PP = $30.49
|
|
MB = $32.01
|
Most Recent Note - 1/12/2011 4:49:36 PM
G - Ended near the session low after better intra-day gains, closing with a 3rd consecutive small gain today with slightly above average volume. Its 50 DMA line has been a reliable support level during past consolidations.
>>> The latest Featured Stock Update with an annotated graph appeared on 12/6/2010. Click here.
View all notes |
Alert me of new notes |
CANSLIM.net Company Profile |
SEC |
Zacks Reports |
StockTalk |
News |
Chart |
Request a new note
C
A N
S L
I M
|
Symbol/Exchange
Company Name
Industry Group |
PRICE |
CHANGE
(%Change) |
Day High |
Volume
(% DAV)
(% 50 day avg vol) |
52 Wk Hi
% From Hi |
Featured
Date |
Price
Featured |
Pivot Featured |
|
Max Buy |
NFLX
-
NASDAQ
Netflix Inc
SPECIALTY RETAIL - Music and Video Stores
|
$188.90
|
+2.25
1.21% |
$189.00
|
3,014,396
53.07% of 50 DAV
50 DAV is 5,680,500
|
$206.80
-8.66%
|
1/10/2011
|
$187.88
|
PP = $209.34
|
|
MB = $219.81
|
Most Recent Note - 1/12/2011 4:55:54 PM
Y - Small gain today on light volume, rising from its 50 DMA line and recent lows defining near-term support. Color code was changed to yellow with new pivot point cited based on its 52-week high plus ten cents. See the latest FSU analysis for details and an annotated graph.
>>> The latest Featured Stock Update with an annotated graph appeared on 1/10/2011. Click here.
View all notes |
Alert me of new notes |
CANSLIM.net Company Profile |
SEC |
Zacks Reports |
StockTalk |
News |
Chart |
Request a new note
C
A N
S L
I M
|
NTAP
-
NASDAQ
Netapp Inc
COMPUTER HARDWARE - Data Storage Devices
|
$58.93
|
+0.65
1.12% |
$59.71
|
4,550,921
80.20% of 50 DAV
50 DAV is 5,674,300
|
$58.80
0.22%
|
1/6/2011
|
$57.49
|
PP = $58.06
|
|
MB = $60.96
|
Most Recent Note - 1/12/2011 4:57:47 PM
Y - Posted a 3rd consecutive small gain today with below average volume, inching above its pivot point for another new high close. Color code was changed to yellow with new pivot point cited based on its 11/10/10 high plus 10 cents. Gains with +50% above average volume, ideally even greater volume, are needed behind a gain above its pivot point to trigger a convincing technical buy signal.
>>> The latest Featured Stock Update with an annotated graph appeared on 12/27/2010. Click here.
View all notes |
Alert me of new notes |
CANSLIM.net Company Profile |
SEC |
Zacks Reports |
StockTalk |
News |
Chart |
Request a new note
C
A N
S L
I M
|
OPEN
-
NASDAQ
Opentable Inc
INTERNET - Internet Software and Services
|
$80.26
|
+0.69
0.87% |
$81.61
|
653,699
71.99% of 50 DAV
50 DAV is 908,100
|
$82.70
-2.94%
|
1/5/2011
|
$74.05
|
PP = $76.79
|
|
MB = $80.63
|
Most Recent Note - 1/11/2011 3:20:31 PM
G - Hit a new 52-week high and reversed into the red after 4 consecutive volume-driven gains. Color code was changed to green after getting extended from its latest base. Prior highs in the $76 area define initial support to watch above its 50 DMA line.
>>> The latest Featured Stock Update with an annotated graph appeared on 1/5/2011. Click here.
View all notes |
Alert me of new notes |
CANSLIM.net Company Profile |
SEC |
Zacks Reports |
StockTalk |
News |
Chart |
Request a new note
C
A N
S L
I M
|
ORCL
-
NASDAQ
Oracle Corp
COMPUTER SOFTWARE and SERVICES - Application Software
|
$30.95
|
-0.05
-0.15% |
$31.23
|
33,962,435
122.28% of 50 DAV
50 DAV is 27,773,500
|
$32.27
-4.11%
|
12/7/2010
|
$29.05
|
PP = $29.92
|
|
MB = $31.42
|
Most Recent Note - 1/11/2011 3:01:15 PM
G - Consolidating in a tight trading range near its 52-week high for the past 3 weeks since its 12/17/10 gap up gain. Support to watch is at prior chart highs and its 50 DMA line just under the $30 level.
>>> The latest Featured Stock Update with an annotated graph appeared on 1/7/2011. Click here.
View all notes |
Alert me of new notes |
CANSLIM.net Company Profile |
SEC |
Zacks Reports |
StockTalk |
News |
Chart |
Request a new note
C
A N
S L
I M
|
PAY
-
NYSE
Verifone Systems Inc
COMPUTER HARDWARE - Transaction Automation Systems
|
$42.99
|
+0.14
0.33% |
$43.47
|
1,519,746
101.27% of 50 DAV
50 DAV is 1,500,700
|
$44.47
-3.33%
|
11/29/2010
|
$33.96
|
PP = $36.04
|
|
MB = $37.84
|
Most Recent Note - 1/11/2011 5:16:22 PM
G - Closed in the lower third of its intra-day range today after starting the session gapping up and hitting another new 52-week high. It had not formed a sound new base. Recent lows in the $38 area along with its 50 DMA line define important near-term chart support to watch.
>>> The latest Featured Stock Update with an annotated graph appeared on 12/15/2010. Click here.
View all notes |
Alert me of new notes |
CANSLIM.net Company Profile |
SEC |
Zacks Reports |
StockTalk |
News |
Chart |
Request a new note
C
A N
S L
I M
|
Symbol/Exchange
Company Name
Industry Group |
PRICE |
CHANGE
(%Change) |
Day High |
Volume
(% DAV)
(% 50 day avg vol) |
52 Wk Hi
% From Hi |
Featured
Date |
Price
Featured |
Pivot Featured |
|
Max Buy |
PCLN
-
NASDAQ
Priceline.Com Inc
INTERNET - Internet Software and Services
|
$434.24
|
+3.03
0.70% |
$435.47
|
585,924
55.34% of 50 DAV
50 DAV is 1,058,800
|
$443.19
-2.02%
|
11/1/2002
|
$399.55
|
PP = $428.20
|
|
MB = $449.61
|
Most Recent Note - 1/11/2011 3:34:20 PM
Y - Pulling back toward prior highs in the $426-428 area that may now serve as initial support to watch following last week's technical breakout.
>>> The latest Featured Stock Update with an annotated graph appeared on 1/2/2011. Click here.
View all notes |
Alert me of new notes |
CANSLIM.net Company Profile |
SEC |
Zacks Reports |
StockTalk |
News |
Chart |
Request a new note
C
A N
S L
I M
|
RAX
-
NYSE
Rackspace Hosting Inc
INTERNET - Internet Software and; Services
|
$33.82
|
-0.10
-0.29% |
$35.00
|
2,144,832
117.42% of 50 DAV
50 DAV is 1,826,700
|
$34.12
-0.88%
|
1/10/2011
|
$22.84
|
PP = $32.76
|
|
MB = $34.40
|
Most Recent Note - 1/11/2011 1:54:04 PM
Y - Gap up gain today with above average volume for a new high, rising from an orderly flat base. Color code was changed to yellow with a new pivot point cited based on its 52-week high plus ten cents. No resistance remains due to overhead supply.
>>> The latest Featured Stock Update with an annotated graph appeared on 12/31/2010. Click here.
View all notes |
Alert me of new notes |
CANSLIM.net Company Profile |
SEC |
Zacks Reports |
StockTalk |
News |
Chart |
Request a new note
C
A N
S L
I M
|
ROVI
-
NASDAQ
Rovi Corp
COMPUTER SOFTWARE andamp; SERVICES - Security Software andamp; Services
|
$64.02
|
+0.52
0.82% |
$64.46
|
1,212,774
87.48% of 50 DAV
50 DAV is 1,386,300
|
$67.00
-4.45%
|
10/29/2010
|
$49.99
|
PP = $53.10
|
|
MB = $55.76
|
Most Recent Note - 1/10/2011 3:56:31 PM
G - Positive reversal today was an impressive sign of support following a big gap down. It is extended from a sound base. Its recent high near $58.50 and its 50 DMA line define chart support levels to watch.
>>> The latest Featured Stock Update with an annotated graph appeared on 12/13/2010. Click here.
View all notes |
Alert me of new notes |
CANSLIM.net Company Profile |
SEC |
Zacks Reports |
StockTalk |
News |
Chart |
Request a new note
C
A N
S L
I M
|
SHOO
-
NASDAQ
Steven Madden Limited
CONSUMER NON-DURABLES - Textile - Apparel Footwear
|
$42.44
|
+2.10
5.21% |
$42.73
|
807,035
209.35% of 50 DAV
50 DAV is 385,500
|
$47.69
-11.01%
|
11/23/2010
|
$44.61
|
PP = $44.95
|
|
MB = $47.20
|
Most Recent Note - 1/12/2011 4:36:20 PM
G - Rallied up from support at prior highs near $40, posting a considerable gain today backed by 2 times average volume. Its downward sloping 50 DMA line may now act as resistance.
>>> The latest Featured Stock Update with an annotated graph appeared on 1/4/2011. Click here.
View all notes |
Alert me of new notes |
CANSLIM.net Company Profile |
SEC |
Zacks Reports |
StockTalk |
News |
Chart |
Request a new note
C
A N
S L
I M
|
SLW
-
NYSE
Silver Wheaton Corp
METALS and; MINING - Silver
|
$34.53
|
-0.58
-1.65% |
$35.50
|
8,473,341
75.15% of 50 DAV
50 DAV is 11,275,100
|
$42.34
-18.45%
|
8/25/2010
|
$21.40
|
PP = $21.99
|
|
MB = $23.09
|
Most Recent Note - 1/11/2011 2:50:05 PM
G - Gapped up today, rallying toward its 50 DMA line without great volume conviction. That important short term average was violated last week with damaging losses with above average volume, triggering technical sell signals.
>>> The latest Featured Stock Update with an annotated graph appeared on 12/8/2010. Click here.
View all notes |
Alert me of new notes |
CANSLIM.net Company Profile |
SEC |
Zacks Reports |
StockTalk |
News |
Chart |
Request a new note
C
A N
S L
I M
|
Symbol/Exchange
Company Name
Industry Group |
PRICE |
CHANGE
(%Change) |
Day High |
Volume
(% DAV)
(% 50 day avg vol) |
52 Wk Hi
% From Hi |
Featured
Date |
Price
Featured |
Pivot Featured |
|
Max Buy |
UA
-
NYSE
Under Armour Inc Cl A
CONSUMER NON-DURABLES - Textile - Apparel Clothing
|
$55.02
|
+0.63
1.16% |
$55.56
|
269,021
40.39% of 50 DAV
50 DAV is 666,000
|
$60.14
-8.51%
|
9/9/2010
|
$39.99
|
PP = $40.10
|
|
MB = $42.11
|
Most Recent Note - 1/10/2011 4:08:01 PM
G - Rallied with below average volume for a close back above its 50 DMA line, finding prompt support near that short-term average.
>>> The latest Featured Stock Update with an annotated graph appeared on 12/23/2010. Click here.
View all notes |
Alert me of new notes |
CANSLIM.net Company Profile |
SEC |
Zacks Reports |
StockTalk |
News |
Chart |
Request a new note
C
A N
S L
I M
|
ULTA
-
NASDAQ
Ulta Salon Cosm & Frag
SPECIALTY RETAIL - Specialty Retail, Other
|
$37.09
|
-0.08
-0.22% |
$37.77
|
260,520
46.00% of 50 DAV
50 DAV is 566,300
|
$38.25
-3.03%
|
1/6/2011
|
$36.12
|
PP = $37.34
|
|
MB = $39.21
|
Most Recent Note - 1/11/2011 3:42:44 PM
Y - Loss today has it slumping back below its pivot point. Technically, its 1/07/11 gain above the pivot point with 50% above average volume was just barely enough to trigger a new (or add-on) technical buy signal.
>>> The latest Featured Stock Update with an annotated graph appeared on 1/6/2011. Click here.
View all notes |
Alert me of new notes |
CANSLIM.net Company Profile |
SEC |
Zacks Reports |
StockTalk |
News |
Chart |
Request a new note
C
A N
S L
I M
|