You are not logged in.
This means you
CAN ONLY VIEW reports that were published prior to Saturday, February 15, 2025.
You
MUST UPGRADE YOUR MEMBERSHIP if you want to see any current reports.
AFTER MARKET UPDATE - FRIDAY, DECEMBER 16TH, 2016
Previous After Market Report Next After Market Report >>>
|
|
|
|
DOW |
-8.83 |
19,843.41 |
-0.04% |
|
Volume |
3,289,122,100 |
+175% |
|
Volume |
2,553,618,200 |
+35% |
|
NASDAQ |
-19.69 |
5,437.16 |
-0.36% |
|
Advancers |
1,647 |
56% |
|
Advancers |
1,422 |
45% |
|
S&P 500 |
-3.96 |
2,258.07 |
-0.18% |
|
Decliners |
1,297 |
44% |
|
Decliners |
1,706 |
55% |
|
Russell 2000 |
-2.01 |
1,364.40 |
-0.15% |
|
52 Wk Highs |
114 |
|
|
52 Wk Highs |
161 |
|
|
S&P 600 |
-4.06 |
842.04 |
-0.48% |
|
52 Wk Lows |
32 |
|
|
52 Wk Lows |
33 |
|
|
 |
Major Averages Fell With Heavier Volume Indicative of Distribution
Kenneth J. Gruneisen - Passed the CAN SLIM® Master's Exam
For the week, the Dow was up 0.4%, the S&P lost 0.1%, and the Nasdaq fell 0.1%. For the week, the Dow was up 0.4%, the S&P lost 0.1%, and the Nasdaq fell 0.1%. Stocks declined on Friday. The Dow was down 9 points to 19842. The S&P 500 lost 3 points to 2258 and the Nasdaq Composite fell 19 points to 5437. Volume totals were higher than the prior session totals on the NYSE and on the Nasdaq exchange, inflated by options expirations. Advancers led decliners by a 4-3 margin on the NYSE but decliners led advancers by 6-5 on the Nasdaq exchange. There were 48 high-ranked companies from the Leaders List that made new 52-week highs and were listed on the BreakOuts Page, versus 49 on the prior session. New 52-week highs outnumbered new 52-week lows on both the NYSE and the Nasdaq exchange.
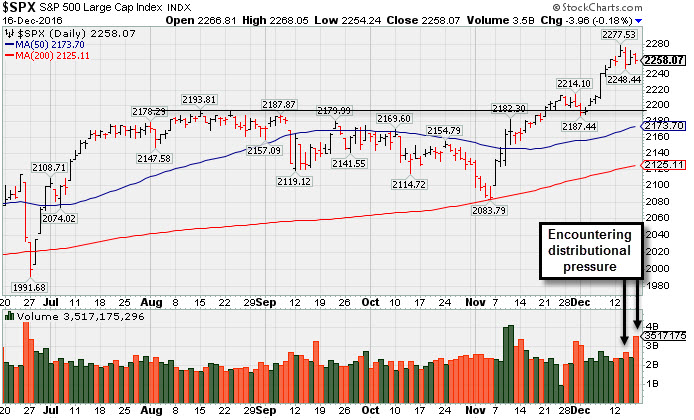
PICTURED: The S&P 500 Index has been encountering distributional pressure as indicated by recent losses on higher volume while retreating from record high territory.
The major averages (M criteria) are in a confirmed uptrend. New buying efforts should only be made in candidates with superior fundamental and technical characteristics. The Featured Stocks Page lists noteworthy high-ranked leaders.
The major averages finished lower as investors digested economic releases and geopolitical concerns. Early Friday morning, reports surfaced that China seized an unmanned U.S. vessel in international waters. Treasury yields fell and gold futures spiked as investors sought perceived safe haven assets. Equity volatility was also heightened in Friday’s session, with the quadruple-witching expiration of index futures and options. On the data front, housing starts tumbled 18.7% in November, firmly below analyst expectations. In a separate release, building permits fell 4.7% last month.
Six of 11 sectors in the S&P 500 finished in positive territory. Technology stocks declined with Adobe Systems (ADBE -1.47%) falling. Shares of Oracle (ORCL -4.431) sank amid a weaker-than-expected rate of growth in the cloud unit. In Financials, MetLife (MET -5.08%) fell as the life insurer lowered its forward revenue guidance. Gilead Sciences (GILD -1.92%) was lower with news the company was ordered to pay Merck (MRK +0.11%) $2.5 billion in damages for patent infringement. In Industrials, General Electric (GE +1.57%) rose after being the subject of positive analyst commentary.
Treasuries advanced with the benchmark 10-year note up 1/32 to yield 2.59%. In commodities, NYMEX WTI crude gained 2% to $51.90/barrel. COMEX gold added 0.7% to $1135.30/ounce. |
 Kenneth J. Gruneisen started out as a licensed stockbroker in August 1987, a couple of months prior to the historic stock market crash that took the Dow Jones Industrial Average down -22.6% in a single day. He has published daily fact-based fundamental and technical analysis on high-ranked stocks online for two decades. Through FACTBASEDINVESTING.COM, Kenneth provides educational articles, news, market commentary, and other information regarding proven investment systems that work in good times and bad.
Comments contained in the body of this report are technical opinions only and are not necessarily those of Gruneisen Growth Corp. The material herein has been obtained from sources believed to be reliable and accurate, however, its accuracy and completeness cannot be guaranteed. Our firm, employees, and customers may effect transactions, including transactions contrary to any recommendation herein, or have positions in the securities mentioned herein or options with respect thereto. Any recommendation contained in this report may not be suitable for all investors and it is not to be deemed an offer or solicitation on our part with respect to the purchase or sale of any securities. |
|
 |
Retail, Financial, and Tech Indexes Fell
Kenneth J. Gruneisen - Passed the CAN SLIM® Master's Exam
The Retail Index ($RLX -0.71%), Bank Index ($BKX -1.15%) and the Broker/Dealer Index ($XBD -1.30%) ended unanimously lower on Friday. The tech sector had a negative bias as the Semiconductor Index ($SOX -1.00%), Networking Index ($NWX -0.95%) and the Biotechnology Index ($BTK -0.65%) posted unanimous losses. The Gold & Silver Index ($XAU -0.40%) and the Oil Services Index ($OSX -0.38%) edged lower while the Integrated Oil Index ($XOI +0.77) ended modestly higher. Charts courtesy www.stockcharts.com

PICTURED: The Semiconductor Index ($SOX -1.00%) is perched near record highs.
| Oil Services |
$OSX |
187.01 |
-0.71 |
-0.38% |
+18.56% |
| Integrated Oil |
$XOI |
1,284.81 |
+9.81 |
+0.77% |
+19.77% |
| Semiconductor |
$SOX |
900.85 |
-9.12 |
-1.00% |
+35.78% |
| Networking |
$NWX |
449.07 |
-4.31 |
-0.95% |
+19.46% |
| Broker/Dealer |
$XBD |
209.38 |
-2.75 |
-1.30% |
+17.57% |
| Retail |
$RLX |
1,372.22 |
-9.75 |
-0.71% |
+6.91% |
| Gold & Silver |
$XAU |
73.41 |
-0.30 |
-0.41% |
+62.05% |
| Bank |
$BKX |
91.72 |
-1.07 |
-1.15% |
+25.51% |
| Biotech |
$BTK |
3,197.32 |
-21.00 |
-0.65% |
-16.17% |
|
|
|
 |
Seriously Applying the Fact-Based System Now
Kenneth J. Gruneisen - Passed the CAN SLIM® Master's Exam
Asset Management Services Using the Fact-Based Investment System You can have professional help in limiting your losses and maximizing your gains in all market environments. For help with how your portfolio is managed click here and indicate "Find a Broker". Account minimum $250,000. |
|
|
Color Codes Explained :
Y - Better candidates highlighted by our
staff of experts.
G - Previously featured
in past reports as yellow but may no longer be buyable under the
guidelines.
***Last / Change / Volume data in this table is the closing quote data***
Symbol/Exchange
Company Name
Industry Group |
PRICE |
CHANGE
(%Change) |
Day High |
Volume
(% DAV)
(% 50 day avg vol) |
52 Wk Hi
% From Hi |
Featured
Date |
Price
Featured |
Pivot Featured |
|
Max Buy |
CSFL
-
NASDAQ
Centerstate Banks Inc
Banks-Southeast
|
$24.80
|
-0.05
-0.20% |
$25.17
|
471,498
179.28% of 50 DAV
50 DAV is 263,000
|
$25.74
-3.66%
|
10/10/2016
|
$18.20
|
PP = $18.37
|
|
MB = $19.29
|
Most Recent Note - 12/13/2016 5:48:09 PM
G - Perched near all-time highs following a streak of volume-driven gains, very extended from any sound base. Its 50 DMA line ($20.39) defines near-term support above prior highs in the $19 area.
>>> FEATURED STOCK ARTICLE : Very Extended From Base Following Additional Gains on Volume - 12/2/2016 |
View all notes |
Set NEW NOTE alert |
Company Profile |
SEC
News |
Chart |
Request a new note
C
A
S
I |
IESC
-
NASDAQ
I E S Holdings Inc
Bldg-Maintenance and Svc
|
$19.30
|
-0.90
-4.46% |
$20.60
|
174,877
190.08% of 50 DAV
50 DAV is 92,000
|
$23.00
-16.09%
|
11/23/2016
|
$19.35
|
PP = $18.26
|
|
MB = $19.17
|
 Most Recent Note - 12/16/2016 5:15:19 PM
G - Pulled back today with above average volume for a 4th consecutive loss, retreating near its "max buy" level from its 52-week high. Reported very strong Sep '16 quarterly sales revenues and earnings increases. Prior highs in the $18 area define initial support to watch.
>>> FEATURED STOCK ARTICLE : Strength Returned for Previously Featured Leader - 11/23/2016 |
View all notes |
Set NEW NOTE alert |
Company Profile |
SEC
News |
Chart |
Request a new note
C
A
S
I |
BERY
-
NYSE
Berry Plastics Group Inc
CONSUMER NON-DURABLES - Packaging and Containers
|
$51.38
|
+0.50
0.98% |
$51.66
|
2,278,476
149.31% of 50 DAV
50 DAV is 1,526,000
|
$51.51
-0.25%
|
11/30/2016
|
$50.26
|
PP = $46.47
|
|
MB = $48.79
|
Most Recent Note - 12/12/2016 5:10:26 PM
G - Posted a gain today with below above average volume for another new high. There was a "breakaway gap" on 11/29/16, powering to new 52-week highs with considerable volume-driven gains. Prior highs in the $46 area define initial support to watch on pullbacks.
>>> FEATURED STOCK ARTICLE : Pulling Back After "Breakaway Gap" With Heavy Volume - 12/1/2016 |
View all notes |
Set NEW NOTE alert |
Company Profile |
SEC
News |
Chart |
Request a new note
C
A
S
I |
EVR
-
NYSE
Evercore Partners Inc
FINANCIAL SERVICES - Investment Banking
|
$67.70
|
-0.90
-1.31% |
$68.90
|
651,668
144.17% of 50 DAV
50 DAV is 452,000
|
$71.97
-5.93%
|
11/14/2016
|
$63.30
|
PP = $60.73
|
|
MB = $63.77
|
Most Recent Note - 12/9/2016 3:32:35 PM
G - Perched near all-time highs, very extended from its prior base. Disciplined investors avoid chasing extended stocks. Prior highs and its 50 DMA line define important support in the $59-60 area.
>>> FEATURED STOCK ARTICLE : Hit Another New High Today With Volume-Driven Gain - 12/5/2016 |
View all notes |
Set NEW NOTE alert |
Company Profile |
SEC
News |
Chart |
Request a new note
C
A
S
I |
HTHT
-
NASDAQ
China Lodging Group Ads
LEISURE - Lodging
|
$48.63
|
-2.20
-4.33% |
$51.32
|
275,288
160.05% of 50 DAV
50 DAV is 172,000
|
$54.23
-10.33%
|
9/29/2016
|
$46.12
|
PP = $47.82
|
|
MB = $50.21
|
Most Recent Note - 12/16/2016 5:16:48 PM
G - Pulled back today for a big loss with above average volume and finished neat the session low. Prior highs near $47 define initial support to watch. After getting extended from its prior base it was repeatedly noted with caution in prior reports - "Reported earnings +10% on +6% sales revenues for the Sep '16 quarter, below the +25% minimum earnings guideline (C criteria), raising concerns."
>>> FEATURED STOCK ARTICLE : Mostly Bullish Action Continues to Bode Well for China Lodging - 12/9/2016 |
View all notes |
Set NEW NOTE alert |
Company Profile |
SEC
News |
Chart |
Request a new note
C
A
S
I |
Symbol/Exchange
Company Name
Industry Group |
PRICE |
CHANGE
(%Change) |
Day High |
Volume
(% DAV)
(% 50 day avg vol) |
52 Wk Hi
% From Hi |
Featured
Date |
Price
Featured |
Pivot Featured |
|
Max Buy |
DW
-
NYSE
Drew Industries Inc
MATERIALS and CONSTRUCTION - General Building Materials
|
$108.15
|
-1.25
-1.14% |
$110.50
|
301,318
123.49% of 50 DAV
50 DAV is 244,000
|
$110.75
-2.35%
|
11/29/2016
|
$106.29
|
PP = $101.00
|
|
MB = $106.05
|
Most Recent Note - 12/13/2016 5:49:28 PM
G - Touched a new high today but reversed into the red. Stubbornly holding its ground just above its "max buy" level. Prior highs in the $101-103 area define initial support to watch on pullbacks.
>>> FEATURED STOCK ARTICLE : Pullback Following Volume-Driven Gain For New Highs - 11/30/2016 |
View all notes |
Set NEW NOTE alert |
Company Profile |
SEC
News |
Chart |
Request a new note
C
A
S
I |
LMAT
-
NASDAQ
Lemaitre Vascular Inc
Medical-Products
|
$22.99
|
-0.52
-2.21% |
$23.60
|
147,982
99.32% of 50 DAV
50 DAV is 149,000
|
$24.99
-8.00%
|
10/27/2016
|
$21.03
|
PP = $22.60
|
|
MB = $23.73
|
Most Recent Note - 12/16/2016 5:19:28 PM
Y - Color code is changed to yellow after sinking below its "max buy" level with today's loss on average volume. Recent lows in the $22 area and its 50 DMA line coincide defining important support to watch on pullbacks.
>>> FEATURED STOCK ARTICLE : Perched Near Highs Following Recent Technical Breakout - 11/25/2016 |
View all notes |
Set NEW NOTE alert |
Company Profile |
SEC
News |
Chart |
Request a new note
C
A
S
I |
PATK
-
NASDAQ
Patrick Industries Inc
WHOLESALE - Building Materials Wholesale
|
$74.00
|
+0.65
0.89% |
$75.00
|
250,546
227.77% of 50 DAV
50 DAV is 110,000
|
$75.53
-2.03%
|
11/29/2016
|
$72.45
|
PP = $69.63
|
|
MB = $73.11
|
Most Recent Note - 12/13/2016 5:51:12 PM
G - Encountered distributional pressure as it pulled back with above average volume today finishing near its "max buy" level. Prior highs in the $69 area define initial support to watch on pullbacks.
>>> FEATURED STOCK ARTICLE : Volume-Backed Breakout Triggered New Technical Buy Signal - 11/29/2016 |
View all notes |
Set NEW NOTE alert |
Company Profile |
SEC
News |
Chart |
Request a new note
C
A
S
I |
ANET
-
NYSE
Arista Networks Inc
TELECOMMUNICATIONS - Communication Equipment
|
$96.68
|
-0.11
-0.11% |
$98.81
|
875,629
119.95% of 50 DAV
50 DAV is 730,000
|
$98.90
-2.24%
|
11/21/2016
|
$93.80
|
PP = $88.66
|
|
MB = $93.09
|
Most Recent Note - 12/14/2016 4:01:38 PM
G - Rallied further above its "max buy" level and hit a new high with today's volume-driven gain. Prior highs in the $88 area define initial support to watch on pullbacks.
>>> FEATURED STOCK ARTICLE : Heavy Volume Behind Breakout Gain - 11/21/2016 |
View all notes |
Set NEW NOTE alert |
Company Profile |
SEC
News |
Chart |
Request a new note
C
A
S
I |
SFBS
-
NASDAQ
Servisfirst Bancshares
BANKING - Regional - Southeast Banks
|
$72.05
|
-0.56
-0.77% |
$73.03
|
744,758
591.08% of 50 DAV
50 DAV is 126,000
|
$75.84
-5.00%
|
7/19/2016
|
$53.28
|
PP = $52.82
|
|
MB = $55.46
|
Most Recent Note - 12/16/2016 5:21:10 PM
G - Churned heavy volume today while pulling back from all-time highs. Very extended from its prior base. Its 50 DMA line ($62) defines important support to watch on pullbacks.
>>> FEATURED STOCK ARTICLE : Financial Firm Remains Extended Well Above Prior Highs - 12/14/2016 |
View all notes |
Set NEW NOTE alert |
Company Profile |
SEC
News |
Chart |
Request a new note
C
A
S
I |
Symbol/Exchange
Company Name
Industry Group |
PRICE |
CHANGE
(%Change) |
Day High |
Volume
(% DAV)
(% 50 day avg vol) |
52 Wk Hi
% From Hi |
Featured
Date |
Price
Featured |
Pivot Featured |
|
Max Buy |
OLLI
-
NASDAQ
Ollie's Bargain Outlet
Retail-DiscountandVariety
|
$29.90
|
-0.35
-1.16% |
$30.35
|
1,196,784
176.26% of 50 DAV
50 DAV is 679,000
|
$32.75
-8.70%
|
10/4/2016
|
$27.36
|
PP = $28.70
|
|
MB = $30.14
|
Most Recent Note - 12/12/2016 5:12:21 PM
Y - Color code is changed to yellow after slumping below its "max buy" level with above average volume behind 3 consecutive losses. Prior highs in the $28 area define important support to watch coinciding with its 50 DMA line.
>>> FEATURED STOCK ARTICLE : Pulling Back After Getting Extended More Than +5% Above Prior Highs - 11/28/2016 |
View all notes |
Set NEW NOTE alert |
Company Profile |
SEC
News |
Chart |
Request a new note
C
A
S
I |
LITE
-
NASDAQ
Lumentum Holdings Inc
TELECOMMUNICATIONS - Cables / Satalite Equipment
|
$39.10
|
-1.10
-2.74% |
$41.20
|
1,425,652
137.35% of 50 DAV
50 DAV is 1,038,000
|
$45.25
-13.59%
|
12/8/2016
|
$42.80
|
PP = $45.35
|
|
MB = $47.62
|
Most Recent Note - 12/16/2016 5:18:04 PM
G - Color code is changed to green after slumping below its 50 DMA line again with a loss today on above average volume. A rebound above its 50 DMA line is needed for its outlook to improve. Little resistance remains due to overhead supply. Volume-driven gains for new highs may trigger a technical buy signal.
>>> FEATURED STOCK ARTICLE : Challenging its High With Big Volume-Driven Gain - 12/8/2016 |
View all notes |
Set NEW NOTE alert |
Company Profile |
SEC
News |
Chart |
Request a new note
C
A
S
I |
|
|
|
THESE ARE NOT BUY RECOMMENDATIONS!
Comments contained in the body of this report are technical
opinions only. The material herein has been obtained
from sources believed to be reliable and accurate, however,
its accuracy and completeness cannot be guaranteed.
This site is not an investment advisor, hence it does
not endorse or recommend any securities or other investments.
Any recommendation contained in this report may not
be suitable for all investors and it is not to be deemed
an offer or solicitation on our part with respect to
the purchase or sale of any securities. All trademarks,
service marks and trade names appearing in this report
are the property of their respective owners, and are
likewise used for identification purposes only.
This report is a service available
only to active Paid Premium Members.
You may opt-out of receiving report notifications
at any time. Questions or comments may be submitted
by writing to Premium Membership Services 665 S.E. 10 Street, Suite 201 Deerfield Beach, FL 33441-5634 or by calling 1-800-965-8307
or 954-785-1121.
|
|
|