You are not logged in.
This means you
CAN ONLY VIEW reports that were published prior to Tuesday, February 11, 2025.
You
MUST UPGRADE YOUR MEMBERSHIP if you want to see any current reports.
AFTER MARKET UPDATE - TUESDAY, NOVEMBER 20TH, 2018
Previous After Market Report Next After Market Report >>>
|
|
|
|
DOW |
-551.80 |
24,465.64 |
-2.21% |
|
Volume |
999,612,620 |
+10% |
|
Volume |
2,643,004,350 |
+13% |
|
NASDAQ |
-119.66 |
6,908.82 |
-1.70% |
|
Advancers |
471 |
16% |
|
Advancers |
748 |
24% |
|
S&P 500 |
-48.84 |
2,641.89 |
-1.82% |
|
Decliners |
2,556 |
84% |
|
Decliners |
2,367 |
76% |
|
Russell 2000 |
-27.53 |
1,469.01 |
-1.84% |
|
52 Wk Highs |
32 |
|
|
52 Wk Highs |
13 |
|
|
S&P 600 |
-17.41 |
928.33 |
-1.84% |
|
52 Wk Lows |
572 |
|
|
52 Wk Lows |
396 |
|
|
 |
Rally Fails as Major Indices Undercut Their Day 1 Lows
Kenneth J. Gruneisen - Passed the CAN SLIM® Master's Exam
Stocks finished firmly lower Tuesday. The Dow fell 551 points to 24,465, while the S&P 500 declined 48 points to 2,641. The Nasdaq Composite lost 119 points to a seven month low of 6,908. The volume totals reported were higher on the NYSE and on the Nasdaq exchange versus the prior session. Breadth was negative as decliners led advancers by 5-1 on the NYSE and 3-1 on the Nasdaq exchange. There were 6 high-ranked companies from the Leaders List that made new 52-week highs and were listed on the BreakOuts Page, down from the 21 on the prior session. New 52-week lows totals expanded and solidly outnumbered new 52-week highs totals on the NYSE and on the Nasdaq exchange. Technically, the last rally failed and the major indices (M criteria) are again in a correction. The Featured Stocks Page provides the most timely analysis on high-ranked leaders. Strict buying and selling rules should always be followed on a case by case basis. Charts used courtesy of www.stockcharts.com
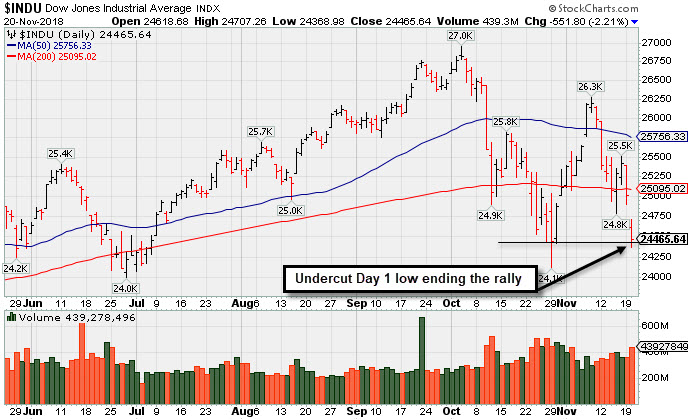
PICTURED: The Dow Jones Industrial Average is sputtering below its 200-day moving average (DMA) line again, and losses undercut the Day 1 lows, technically ending the latest confirmed rally.
U.S. equities sold-off amid further weakness in Technology stocks and disappointing retail earnings. The decline has put the Dow and S&P 500 trading in negative territory for the year, while all five members of the oft cited “FAANG” group dipped into “bear-market” range following Monday’s retreat.
All 11 S&P 500 sectors ended lower. Energy shares fell the most as WTI crude retreated -6.6% to $53.43/barrel, the lowest level in more than a year. Apple (AAPL -4.78%) paced the selling in Tech, with shares down after the iPhone maker was the subject of another notable Wall Street downgrade Tuesday. In earnings, Target (TGT -11.26%) and Lowe’s (LOW -5.66%) fell after each retailer missed analyst same-store sales projections. L Brands (LB -17.71%) after unexpectedly cutting its dividend. Meanwhile, Campbell Soup (CPB +5.46%) bucked the downward trend, rising 5.5% to $40.55 after beating consensus sales and profit projections.
Treasuries were little changed with the yield on the 10-year note essentially unchanged at 3.05%. On the data front, housing starts rebounded 1.5% in October after falling 5.3% in the previous month. |
 Kenneth J. Gruneisen started out as a licensed stockbroker in August 1987, a couple of months prior to the historic stock market crash that took the Dow Jones Industrial Average down -22.6% in a single day. He has published daily fact-based fundamental and technical analysis on high-ranked stocks online for two decades. Through FACTBASEDINVESTING.COM, Kenneth provides educational articles, news, market commentary, and other information regarding proven investment systems that work in good times and bad.
Comments contained in the body of this report are technical opinions only and are not necessarily those of Gruneisen Growth Corp. The material herein has been obtained from sources believed to be reliable and accurate, however, its accuracy and completeness cannot be guaranteed. Our firm, employees, and customers may effect transactions, including transactions contrary to any recommendation herein, or have positions in the securities mentioned herein or options with respect thereto. Any recommendation contained in this report may not be suitable for all investors and it is not to be deemed an offer or solicitation on our part with respect to the purchase or sale of any securities. |
|
 |
Energy, Networking, Retail, and Financial Groups Led Decliners
Kenneth J. Gruneisen - Passed the CAN SLIM® Master's Exam
The Retail Index ($RLX -2.73%), Broker/Dealer Index ($XBD -2.26%) and the Bank Index ($BKX -1.84%) suffered unanimous losses. The Semiconductor Index ($SOX +0.15%) eked out a small gain while the Biotech Index ($BTK -0.44%) edged lower and the Networking Index ($NWX -2.07%) suffered a big loss. The Oil Services Index ($OSX -5.66%) and the Integrated Oil Index ($XOI -3.33%) both were standout decliners, meanwhile the Gold & Silver Index ($XAU -0.81%) suffered a smaller loss.
Charts courtesy of www.stockcharts.com
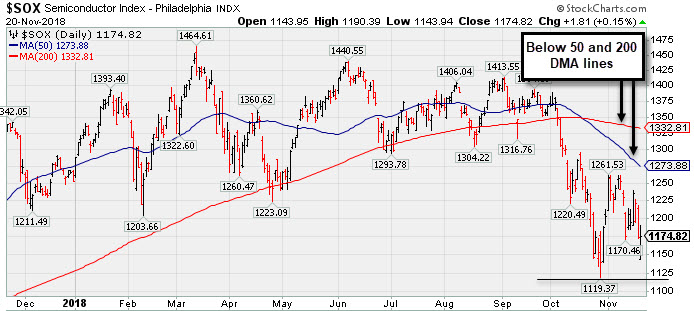 PICTURED: The Semiconductor Index ($SOX +0.15%) is sputtering below its 50-day and 200-day moving average (DMA) lines after recently slumping to new 2018 lows.
| Oil Services |
$OSX |
105.41 |
-6.32 |
-5.66% |
-29.52% |
| Integrated Oil |
$XOI |
1,282.94 |
-44.16 |
-3.33% |
-3.94% |
| Semiconductor |
$SOX |
1,174.82 |
+1.81 |
+0.15% |
-6.24% |
| Networking |
$NWX |
497.10 |
-10.49 |
-2.07% |
+1.34% |
| Broker/Dealer |
$XBD |
255.02 |
-5.91 |
-2.26% |
-3.85% |
| Retail |
$RLX |
1,952.39 |
-54.71 |
-2.73% |
+12.61% |
| Gold & Silver |
$XAU |
65.17 |
-0.53 |
-0.81% |
-23.57% |
| Bank |
$BKX |
98.63 |
-1.85 |
-1.84% |
-7.57% |
| Biotech |
$BTK |
4,476.73 |
-19.62 |
-0.44% |
+6.03% |
|
|
|
 |
Abruptly Slumped Near 200 Day Moving Average Line
Kenneth J. Gruneisen - Passed the CAN SLIM® Master's Exam
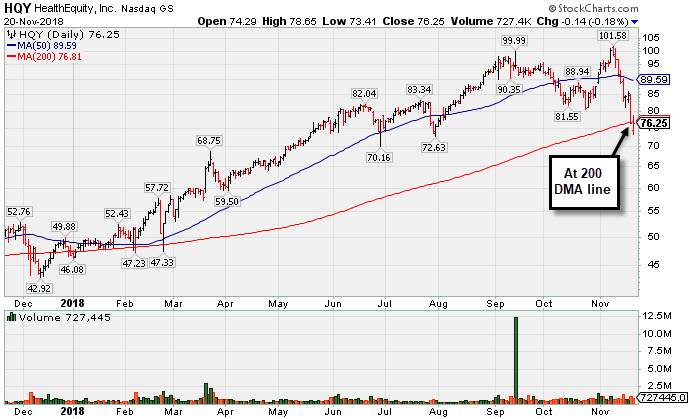
Healthequity Inc (HQY -$0.14 or -0.18% to $76.25) finished near its 200-day moving average (DMA) line ($76.81) after violating the prior low ($80.56 on 10/24/18) on the prior session triggering a technical sell signal. A rebound above the 50-day moving average (DMA) line ($89.59) is needed for its outlook to improve.
HQY wedged to a new high but stalled after last shown in this FSU section on 11/01/18 with an annotated graph under the headline, "Rebound Above 50-Day Average Helped Outlook Improve". It reported earnings +62% on +25% sales revenues for the Jul '18 quarter versus the year ago period, continuing its strong earnings track record. Fundamentals remain strong, as the past 7 quarterly comparisons were above the +25% minimum earnings guideline (C criteria) and underpinned by strong sales revenues increases.
It has managed a bumpy climb that may have shaken out many investors since triggering a technical buy signal with a gain above the new pivot point with +90% above average volume when highlighted in the 2/20/18 mid-day report (read here).
The number of top-rated funds owning its shares rose from 369 in Dec '16 to 546 in Sep '18, a reassuring sign concerning the I criteria. Its current Up/Down Volume Ratio of 1.3 is also an unbiased indication its shares have been under accumulation over the past 50 days. It has a fairly small supply of only 62.3 million shares (S criteria) outstanding, which can contribute to greater price volatility in the event of institutional buying or selling. It currently has a Timeliness Rating of A and a Sponsorship Rating of B.
The Commercial Services - Outsourcing industry group currently has a Group Relative Strength Rating of 52, however there are other strong leaders in the group hitting new highs, a reassuring sign concerning the L criteria. It completed its $14 IPO on 7/31/14 followed by an additional Public Offering on 5/05/15 and Secondary Offerings on both 10/20/16 and 9/23/15. |
|
|
Color Codes Explained :
Y - Better candidates highlighted by our
staff of experts.
G - Previously featured
in past reports as yellow but may no longer be buyable under the
guidelines.
***Last / Change / Volume data in this table is the closing quote data***
Symbol/Exchange
Company Name
Industry Group |
PRICE |
CHANGE
(%Change) |
Day High |
Volume
(% DAV)
(% 50 day avg vol) |
52 Wk Hi
% From Hi |
Featured
Date |
Price
Featured |
Pivot Featured |
|
Max Buy |
MPX
-
NYSE
Marine Products Corp
AUTOMOTIVE - Recreational Vehicles
|
$20.87
|
-0.56
-2.61% |
$21.14
|
68,750
149.46% of 50 DAV
50 DAV is 46,000
|
$24.82
-15.91%
|
10/24/2018
|
$23.00
|
PP = $24.92
|
|
MB = $26.17
|
Most Recent Note - 11/19/2018 5:14:54 PM
G - Slumped below its 50 DMA line ($22.22) again and its color code is changed to green. Recent low ($20.25 on 10/26/18) defines the next important support. A rebound above the 50 DMA line is needed for its outlook to improve. Subsequent gains above the pivot point backed by at least +40% above average volume may trigger a technical buy signal.
>>> FEATURED STOCK ARTICLE : Perched Within Striking Distance of Pivot Point - 11/13/2018 |
View all notes |
Set NEW NOTE alert |
Company Profile |
SEC
News |
Chart |
Request a new note
C
A
S
I |
GMED
-
NYSE
Globus Medical Inc Cl A
CHEMICALS - Specialty Chemicals
|
$50.26
|
-0.07
-0.14% |
$51.15
|
377,850
49.65% of 50 DAV
50 DAV is 761,000
|
$57.83
-13.09%
|
9/26/2018
|
$56.11
|
PP = $57.65
|
|
MB = $60.53
|
 Most Recent Note - 11/20/2018 1:08:55 PM
G - The longer it lingers below its 200 DMA line ($51.78) and its 50 DMA line ($53.03) the worse its outlook gets. Remains only -12.4% off its all-time high, but more damaging losses would raise serious concerns.
>>> FEATURED STOCK ARTICLE : Consolidating -5.2% Off 52-Week High Ahead of Earnings News - 11/5/2018 |
View all notes |
Set NEW NOTE alert |
Company Profile |
SEC
News |
Chart |
Request a new note
C
A
S
I |
ZBRA
-
NASDAQ
Zebra Tech Corp Cl A
COMPUTER HARDWARE - Computer Peripherals
|
$162.29
|
-7.12
-4.20% |
$168.00
|
549,653
118.46% of 50 DAV
50 DAV is 464,000
|
$184.75
-12.16%
|
11/6/2018
|
$170.41
|
PP = $179.57
|
|
MB = $188.55
|
Most Recent Note - 11/20/2018 5:30:50 PM
G - Loss on higher volume today violated its 50 DMA line ($169.60) and its color code is changed to green. The prior lows and 200 DMA line ($152) define the next important support to watch. Disciplined investors are reminded to always follow strict buy and sell rules.
>>> FEATURED STOCK ARTICLE : Hit New High Following Another Strong Earnings Increase - 11/6/2018 |
View all notes |
Set NEW NOTE alert |
Company Profile |
SEC
News |
Chart |
Request a new note
C
A
S
I |
CME
-
NASDAQ
C M E Group Inc
DIVERSIFIED SERVICES - Business/Management Services
|
$192.16
|
-3.45
-1.76% |
$194.82
|
2,519,809
133.18% of 50 DAV
50 DAV is 1,892,000
|
$197.08
-2.50%
|
10/4/2018
|
$179.29
|
PP = $177.45
|
|
MB = $186.32
|
Most Recent Note - 11/20/2018 1:05:31 PM
G - Pulling back from its all-time high with a loss today, it tallied 16 gains in the prior 17 sessions. Its 50 DMA line ($180) defines near-term support. Strength continued after reporting earnings +22% on +2% sales revenues for the Sep '18 quarter, below the +25% minimum earnings guideline (C criteria), raising fundamental concerns.
>>> FEATURED STOCK ARTICLE : Extended From Base After More Gain With Above Average Volume - 11/15/2018 |
View all notes |
Set NEW NOTE alert |
Company Profile |
SEC
News |
Chart |
Request a new note
C
A
S
I |
GDOT
-
NYSE
Green Dot Corp Cl A
FINANCIAL SERVICES - Credit Services
|
$73.64
|
-3.63
-4.70% |
$76.39
|
561,113
121.45% of 50 DAV
50 DAV is 462,000
|
$93.00
-20.82%
|
11/8/2018
|
$90.35
|
PP = $91.61
|
|
MB = $96.19
|
Most Recent Note - 11/20/2018 5:32:49 PM
G - Slumped below its 200 DMA line ($74.50) today. The prior low ($71.50 on 10/29/18) defines important near-term support.
>>> FEATURED STOCK ARTICLE : Volume Heavy Behind Rally to New High - 11/8/2018 |
View all notes |
Set NEW NOTE alert |
Company Profile |
SEC
News |
Chart |
Request a new note
C
A
S
I |
Symbol/Exchange
Company Name
Industry Group |
PRICE |
CHANGE
(%Change) |
Day High |
Volume
(% DAV)
(% 50 day avg vol) |
52 Wk Hi
% From Hi |
Featured
Date |
Price
Featured |
Pivot Featured |
|
Max Buy |
HZO
-
NYSE
Marinemax Inc
SPECIALTY RETAIL - Specialty Retail, Other
|
$20.94
|
-1.78
-7.83% |
$22.46
|
360,460
106.64% of 50 DAV
50 DAV is 338,000
|
$26.11
-19.80%
|
11/2/2018
|
$25.10
|
PP = $25.15
|
|
MB = $26.41
|
Most Recent Note - 11/20/2018 1:02:09 PM
G - Color code is changed to green while slumping below its 50 DMA line ($21.87). Disciplined investors always limit losses by selling any stock that falls more than -7% from their purchase price.
>>> FEATURED STOCK ARTICLE : Boat Retailer Has Strong Earnings History - 11/2/2018 |
View all notes |
Set NEW NOTE alert |
Company Profile |
SEC
News |
Chart |
Request a new note
C
A
S
I |
ULTA
-
NASDAQ
Ulta Beauty Inc
SPECIALTY RETAIL - Specialty Retail, Other
|
$302.14
|
-11.14
-3.56% |
$310.25
|
1,130,345
120.63% of 50 DAV
50 DAV is 937,000
|
$322.49
-6.31%
|
11/8/2018
|
$296.36
|
PP = $290.40
|
|
MB = $304.92
|
Most Recent Note - 11/19/2018 12:44:13 PM
G - Hit another new all-time high today. Prior high ($290) defines initial support to watch above its 50 DMA line ($283).
>>> FEATURED STOCK ARTICLE : Volume Driven Gains Indicate Institutional Buying Demand - 11/9/2018 |
View all notes |
Set NEW NOTE alert |
Company Profile |
SEC
News |
Chart |
Request a new note
C
A
S
I |
UBNT
-
NASDAQ
Ubiquiti Networks Inc
TELECOMMUNICATIONS - Diversified Communication Serv
|
$106.46
|
-2.72
-2.49% |
$109.45
|
494,269
91.87% of 50 DAV
50 DAV is 538,000
|
$112.45
-5.33%
|
11/9/2018
|
$108.20
|
PP = $101.43
|
|
MB = $106.50
|
Most Recent Note - 11/20/2018 1:12:16 PM
G - After intra-day lows today briefly undercut its "max buy" level it is still stubbornly holding its ground near its all-time high. Disciplined investors avoid chasing stocks more than +5% above the pivot point. Prior high ($101.33 on 9/25/18) defines initial support to watch on pullbacks.
>>> FEATURED STOCK ARTICLE : Pullback Following Breakout Gain on After Latest Earnings Report - 11/12/2018 |
View all notes |
Set NEW NOTE alert |
Company Profile |
SEC
News |
Chart |
Request a new note
C
A
S
I |
FIVE
-
NASDAQ
Five Below Inc
Retail-DiscountandVariety
|
$103.88
|
-10.24
-8.97% |
$109.80
|
2,478,621
286.55% of 50 DAV
50 DAV is 865,000
|
$136.13
-23.69%
|
7/6/2018
|
$98.90
|
PP = $104.09
|
|
MB = $109.29
|
Most Recent Note - 11/20/2018 1:00:06 PM
G - Gapped down today and undercut the prior low ($108.76 on 10/26/18) triggering a technical sell signal amid broader market weakness (M criteria). A rebound above the 50 DMA line ($120.47) is needed for its outlook to improve.
>>> FEATURED STOCK ARTICLE : Consolidating Near 50-Day Moving Average After Finding Support - 11/14/2018 |
View all notes |
Set NEW NOTE alert |
Company Profile |
SEC
News |
Chart |
Request a new note
C
A
S
I |
HQY
-
NASDAQ
Healthequity Inc
COMPUTER SOFTWARE and SERVICES - Healthcare Information Service
|
$76.25
|
-0.14
-0.18% |
$78.65
|
688,162
73.76% of 50 DAV
50 DAV is 933,000
|
$101.58
-24.94%
|
11/2/2018
|
$95.56
|
PP = $100.09
|
|
MB = $105.09
|
Most Recent Note - 11/20/2018 5:28:16 PM
G - Sputtering near its 200 DMA line ($76.81) after a loss on the prior session violated the prior low ($80.56 on 10/24/18) triggering a technical sell signal. A rebound above the 50 DMA line ($89.59) is needed for its outlook to improve. See the latest FSU analysis for more details and a new annotated graph.
>>> FEATURED STOCK ARTICLE : Rebound Above 50-Day Average Helped Outlook Improve - 11/1/2018 |
View all notes |
Set NEW NOTE alert |
Company Profile |
SEC
News |
Chart |
Request a new note
C
A
S
I |
Symbol/Exchange
Company Name
Industry Group |
PRICE |
CHANGE
(%Change) |
Day High |
Volume
(% DAV)
(% 50 day avg vol) |
52 Wk Hi
% From Hi |
Featured
Date |
Price
Featured |
Pivot Featured |
|
Max Buy |
OLLI
-
NASDAQ
Ollie's Bargain Outlet
Retail-DiscountandVariety
|
$82.46
|
-6.24
-7.03% |
$86.40
|
1,527,031
238.23% of 50 DAV
50 DAV is 641,000
|
$97.61
-15.52%
|
11/16/2018
|
$90.70
|
PP = $97.71
|
|
MB = $102.60
|
Most Recent Note - 11/20/2018 12:40:32 PM
G - Color code is changed to green after a gap down today and losses undercutting the prior low ($84.66 on 10/11/18) triggering a technical sell signal. A rebound above the 50 DMA line ($90.79) is needed for its outlook to improve.
>>> FEATURED STOCK ARTICLE : Consolidating Near 50-Day Average Forming New Base - 11/16/2018 |
View all notes |
Set NEW NOTE alert |
Company Profile |
SEC
News |
Chart |
Request a new note
C
A
S
I |
PLNT
-
NYSE
Planet Fitness Inc Cl A
Leisure-Services
|
$50.91
|
+0.24
0.47% |
$51.70
|
1,326,889
100.98% of 50 DAV
50 DAV is 1,314,000
|
$57.66
-11.71%
|
11/7/2018
|
$57.10
|
PP = $55.45
|
|
MB = $58.22
|
Most Recent Note - 11/19/2018 5:20:41 PM
Y - Suffered a big loss on higher (near average) volume today. Its 50 DMA line ($50.01) defines important support. Following a recent breakout it slumped back into the prior base with a damaging loss on 11/12/18 raising concerns.
>>> FEATURED STOCK ARTICLE : Big Gain for New High With Nearly 4 Times Average Volume - 11/7/2018 |
View all notes |
Set NEW NOTE alert |
Company Profile |
SEC
News |
Chart |
Request a new note
C
A
S
I |
|
|
|
THESE ARE NOT BUY RECOMMENDATIONS!
Comments contained in the body of this report are technical
opinions only. The material herein has been obtained
from sources believed to be reliable and accurate, however,
its accuracy and completeness cannot be guaranteed.
This site is not an investment advisor, hence it does
not endorse or recommend any securities or other investments.
Any recommendation contained in this report may not
be suitable for all investors and it is not to be deemed
an offer or solicitation on our part with respect to
the purchase or sale of any securities. All trademarks,
service marks and trade names appearing in this report
are the property of their respective owners, and are
likewise used for identification purposes only.
This report is a service available
only to active Paid Premium Members.
You may opt-out of receiving report notifications
at any time. Questions or comments may be submitted
by writing to Premium Membership Services 665 S.E. 10 Street, Suite 201 Deerfield Beach, FL 33441-5634 or by calling 1-800-965-8307
or 954-785-1121.
|
|
|