You are not logged in.
This means you
CAN ONLY VIEW reports that were published prior to Friday, April 18, 2025.
You
MUST UPGRADE YOUR MEMBERSHIP if you want to see any current reports.
AFTER MARKET UPDATE - TUESDAY, SEPTEMBER 26TH, 2023
Previous After Market Report Next After Market Report >>>
|
|
|
|
DOW |
-388.00 |
33,618.88 |
-1.14% |
|
Volume |
847,654,007 |
-3% |
|
Volume |
4,724,935,000 |
+9% |
|
NASDAQ |
-207.71 |
13,063.61 |
-1.57% |
|
Advancers |
430 |
15% |
|
Advancers |
1,354 |
31% |
|
S&P 500 |
-63.91 |
4,273.53 |
-1.47% |
|
Decliners |
2,413 |
85% |
|
Decliners |
2,974 |
69% |
|
Russell 2000 |
-22.63 |
1,761.61 |
-1.27% |
|
52 Wk Highs |
19 |
|
|
52 Wk Highs |
37 |
|
|
S&P 600 |
-17.20 |
1,134.45 |
-1.49% |
|
52 Wk Lows |
272 |
|
|
52 Wk Lows |
386 |
|
|
 |
Leadership Thin and Breadth Negative as Indices' Losses Grow
Kenneth J. Gruneisen - Passed the CAN SLIM® Master's Exam
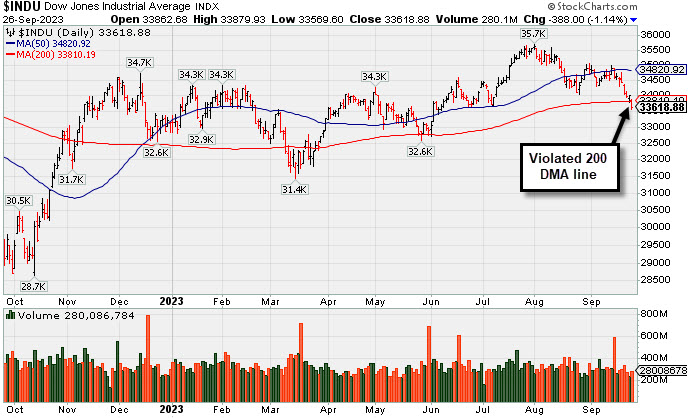
The major indices finished between -1.1% and -1.6% lower on Tuesday after erasing Monday's modest rebound right at the open. The volume totals were mixed, lighter than the prior session on the NYSE and higher on the Nasdaq exchange. Decliners led advancers by almost a 6-1 margin on the NYSE and by more tha a 2-1 margin on the Nasdaq exchange. There were 3 high-ranked companies from the Leaders List that hit a new 52-week high and were listed on the BreakOuts Page versus the total of 5 on the prior session. New 52-week lows totals solidly outnumbered new 52-week highs totals on the NYSE and on the Nasdaq exchange. The major indices are in a correction (M criteria). New buying efforts should be avoided until a new rally is confirmed by a solid follow-through day.
PICTURED: The Dow Jones Industrial Average violated its 200-day moving average (DMA) line.
Tuesday's negative bias was due in part to ongoing worries about higher interest rates. The 10-yr note yield climbed another two basis points to 4.56%, and the 2-yr note yield rose two basis points to 5.12%. Concerns were stoked by JPMorgan Chase CEO, Jamie Dimon, who told the Times of India that he is not sure the world is prepared for 7%. Minneapolis Fed President Kashkari said, according to Bloomberg, that he thinks another rate hike before year end would likely be needed if the economy is stronger than expected.
The S&P 500, Nasdaq Composite, and Russell 2000 are now down -5.2%, -6.9%, and -7.2%, respectively, this month. September, historically, has been the worst month of the year for the S&P 500.
All 11 S&P 500 sectors closed in the red. The energy sector (-0.5%) saw the smallest decline as oil prices climbed ($90.49/bbl, +0.87, +1.0%). The consumer discretionary sector (-2.0%) was another laggard of note along with the information technology (-1.8%) and real estate (-1.8%) sectors. The rate-sensitive utilities sector (-3.1%) actually saw the biggest decline.
Amazon.com (AMZN -4.03%) slumped badly following news that the FTC and 17 state attorneys general are suing the company for illegally maintaining monopoly power.
|
 Kenneth J. Gruneisen started out as a licensed stockbroker in August 1987, a couple of months prior to the historic stock market crash that took the Dow Jones Industrial Average down -22.6% in a single day. He has published daily fact-based fundamental and technical analysis on high-ranked stocks online for two decades. Through FACTBASEDINVESTING.COM, Kenneth provides educational articles, news, market commentary, and other information regarding proven investment systems that work in good times and bad.
Comments contained in the body of this report are technical opinions only and are not necessarily those of Gruneisen Growth Corp. The material herein has been obtained from sources believed to be reliable and accurate, however, its accuracy and completeness cannot be guaranteed. Our firm, employees, and customers may effect transactions, including transactions contrary to any recommendation herein, or have positions in the securities mentioned herein or options with respect thereto. Any recommendation contained in this report may not be suitable for all investors and it is not to be deemed an offer or solicitation on our part with respect to the purchase or sale of any securities. |
|
 |
Retail, Financial, and Commodity-Linked Groups Led Decliners
Kenneth J. Gruneisen - Passed the CAN SLIM® Master's Exam
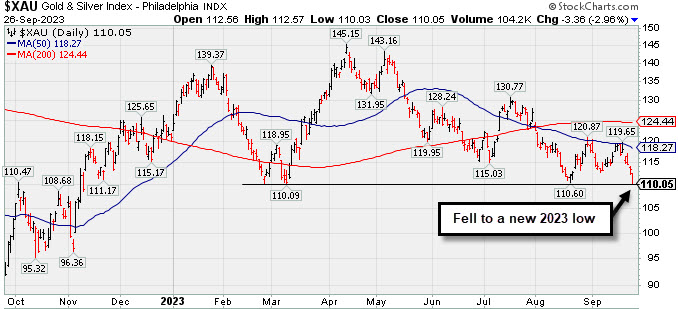
The Retail Index ($RLX -2.94%) outpaced the Bank Index ($BKX -1.63%) and the Broker/Dealer Index ($XBD -1.80%) to the downside. The Semiconductor Index ($SOX -1.77%) and the Networking Index ($NWX -2.01%) suffered large losses while the Biotech Index ($BTK +0.58%) was a standout by ending the session with a modest gain. The Oil Services Index ($OSX -0.70%) and the Integrated Oil Index ($XOI -0.66%) both posted modest losses.
PICTURED: The Gold & Silver Index ($XAU -2.96%) was a standout decliner as it slumped to a new 2023 low.
| Oil Services |
$OSX |
94.24 |
-0.66 |
-0.70% |
+12.38% |
| Integrated Oil |
$XOI |
1,920.70 |
-12.68 |
-0.66% |
+7.47% |
| Semiconductor |
$SOX |
3,329.62 |
-59.84 |
-1.77% |
+31.50% |
| Networking |
$NWX |
728.69 |
-14.95 |
-2.01% |
-6.97% |
| Broker/Dealer |
$XBD |
479.97 |
-8.81 |
-1.80% |
+6.87% |
| Retail |
$RLX |
3,340.18 |
-101.32 |
-2.94% |
+21.28% |
| Gold & Silver |
$XAU |
110.05 |
-3.36 |
-2.96% |
-8.94% |
| Bank |
$BKX |
77.63 |
-1.29 |
-1.63% |
-23.03% |
| Biotech |
$BTK |
5,030.21 |
+29.10 |
+0.58% |
-4.75% |
|
|
|
 |
Featured Stocks
Kenneth J. Gruneisen - Passed the CAN SLIM® Master's Exam
Symbol/Exchange
Company Name
Industry Group | PRICE | CHANGE
(%Change) | Day High | Volume
(% DAV)
(% 50 day avg vol) | 52 Wk Hi
% From Hi | Featured
Date | Price
Featured | Pivot Featured | | Max Buy |  STRL - NASDAQ STRL - NASDAQ
Sterling Infrastructure
Bldg-Heavy Construction | $70.32 | -1.81
-2.51% | $72.56 | 275,896
67.46% of 50 DAV
50 DAV is 409,000 | $84.00
-16.29%
| 12/14/2022 | $32.41 | PP = $33.72 | | MB = $35.41 | Most Recent Note - 9/21/2023 5:24:17 PM
G - Fell near its 50 DMA line ($71.38) with today''s big loss on below-average volume. Fundamentals remain strong.
>>> FEATURED STOCK ARTICLE : 7th Straight Loss Off High for Sterling Infrastructure - 9/13/2023 | View all notes | Set NEW NOTE alert | Company Profile | SEC News | Chart | Request a new note C A S I | FIX - NYSE
Comfort Systems USA
Bldg-A/C and Heating Prds | $169.60 | -2.37
-1.38% | $172.65 | 194,014
78.87% of 50 DAV
50 DAV is 246,000 | $192.33
-11.82%
| 4/27/2023 | $148.85 | PP = $152.23 | | MB = $159.84 |  Most Recent Note - 9/26/2023 5:52:51 PM Most Recent Note - 9/26/2023 5:52:51 PM
G - Suffered a loss today with light volume. Only a prompt rebound above the 50 DMA line would help its outlook improve. Fundamentals remain strong.
>>> FEATURED STOCK ARTICLE : Violated 50-Day Moving Average With a Damaging Gap Down - 9/21/2023 | View all notes | Set NEW NOTE alert | Company Profile | SEC News | Chart | Request a new note C A S I | CLH - NYSE
Clean Harbors
Pollution Control | $164.28 | -4.74
-2.80% | $169.80 | 176,687
58.31% of 50 DAV
50 DAV is 303,000 | $178.33
-7.88%
| 3/10/2023 | $136.89 | PP = $136.74 | | MB = $143.58 | Most Recent Note - 9/26/2023 5:49:19 PM
Slumped below its 50 DMA line ($169) and closed near the session low. It will be dropped from the Featured Stocks list tonight. Jun ''23 quarterly earnings were -13% on +3% sales revenues versus the year-ago period, below the +25% minimum earnings guideline (C criteria), raising fundamental concerns.
>>> FEATURED STOCK ARTICLE : Enduring Distributional Pressure Near 50-Day Moving Average - 9/20/2023 | View all notes | Set NEW NOTE alert | Company Profile | SEC News | Chart | Request a new note C A S I | ANET - NYSE
Arista Networks
Computer-Networking | $177.92 | -3.26
-1.80% | $179.74 | 1,436,880
54.32% of 50 DAV
50 DAV is 2,645,000 | $198.70
-10.46%
| 8/1/2023 | $188.84 | PP = $178.46 | | MB = $187.38 | Most Recent Note - 9/26/2023 5:51:38 PM
G - Quietly sputtering below its 50 DMA line ($181) today with another loss on light volume. Only a prompt rebound above the 50 DMA line would help its outlook improve. Fundamentals remain strong.
>>> FEATURED STOCK ARTICLE : Orderly Pullback Below "Max Buy" Level - 9/15/2023 | View all notes | Set NEW NOTE alert | Company Profile | SEC News | Chart | Request a new note C A S I | MEDP - NASDAQ
Medpace Holdings
Medical-Research Eqp/Svc | $242.15 | -2.55
-1.04% | $248.23 | 182,143
62.59% of 50 DAV
50 DAV is 291,000 | $282.73
-14.35%
| 7/25/2023 | $196.32 | PP = $241.57 | | MB = $253.65 | Most Recent Note - 9/22/2023 5:17:23 PM
G - Halted its slide today after 6 damaging losses, abruptly retreating below the prior high ($269) and violating its 50 DMA line ($260) triggering a technical sell signal. Only a prompt rebound above the 50 DMA line would help its outlook improve. Fundamentals remain strong. See the latest FSU analysis for more details and a new annotated graph.
>>> FEATURED STOCK ARTICLE : Damaging Streak of Losses Violated 50-Day Moving Average Line - 9/22/2023 | View all notes | Set NEW NOTE alert | Company Profile | SEC News | Chart | Request a new note C A S I | Symbol/Exchange
Company Name
Industry Group | PRICE | CHANGE
(%Change) | Day High | Volume
(% DAV)
(% 50 day avg vol) | 52 Wk Hi
% From Hi | Featured
Date | Price
Featured | Pivot Featured | | Max Buy | COKE - NASDAQ
Coca-Cola Consolidated
Beverages-Non-Alcoholic | $646.00 | -8.00
-1.22% | $653.92 | 23,739
57.90% of 50 DAV
50 DAV is 41,000 | $745.53
-13.35%
| 8/3/2023 | $718.56 | PP = $694.30 | | MB = $729.02 | Most Recent Note - 9/25/2023 5:25:02 PM
G - Volume totals have been cooling while recently sputtering below its 50 DMA line ($672.75) after volume-driven losses. A rebound above the 50 DMA line is needed to help its outlook improve. See the latest FSU analysis for more details and a new annotated graph.
>>> FEATURED STOCK ARTICLE : Lingering Below 50 DMA Line and Perched -12.3% Off High - 9/25/2023 | View all notes | Set NEW NOTE alert | Company Profile | SEC News | Chart | Request a new note C A S I | PLUS - NASDAQ
ePlus
Computer-Tech Services | $62.29 | -1.45
-2.27% | $63.74 | 102,804
96.08% of 50 DAV
50 DAV is 107,000 | $75.90
-17.93%
| 8/8/2023 | $67.60 | PP = $62.92 | | MB = $66.07 | Most Recent Note - 9/25/2023 5:27:48 PM
Y - Volume totals have been cooling while recently consolidating above its 50 DMA line ($62.46). More damaging losses may trigger a technical sell signal.
>>> FEATURED STOCK ARTICLE : Still Consolidating Above 50 DMA Line - 9/12/2023 | View all notes | Set NEW NOTE alert | Company Profile | SEC News | Chart | Request a new note C A S I
|
|
|
|
Color Codes Explained :
Y - Better candidates highlighted by our
staff of experts.
G - Previously featured
in past reports as yellow but may no longer be buyable under the
guidelines.
***Last / Change / Volume data in this table is the closing quote data***
|
|
|
THESE ARE NOT BUY RECOMMENDATIONS!
Comments contained in the body of this report are technical
opinions only. The material herein has been obtained
from sources believed to be reliable and accurate, however,
its accuracy and completeness cannot be guaranteed.
This site is not an investment advisor, hence it does
not endorse or recommend any securities or other investments.
Any recommendation contained in this report may not
be suitable for all investors and it is not to be deemed
an offer or solicitation on our part with respect to
the purchase or sale of any securities. All trademarks,
service marks and trade names appearing in this report
are the property of their respective owners, and are
likewise used for identification purposes only.
This report is a service available
only to active Paid Premium Members.
You may opt-out of receiving report notifications
at any time. Questions or comments may be submitted
by writing to Premium Membership Services 665 S.E. 10 Street, Suite 201 Deerfield Beach, FL 33441-5634 or by calling 1-800-965-8307
or 954-785-1121.
|
|
|