You are not logged in.
This means you
CAN ONLY VIEW reports that were published prior to Tuesday, March 25, 2025.
You
MUST UPGRADE YOUR MEMBERSHIP if you want to see any current reports.
AFTER MARKET UPDATE - MONDAY, JUNE 10TH, 2024
Previous After Market Report Next After Market Report >>>
|
|
|
|
DOW |
+69.05 |
38,868.04 |
+0.18% |
|
Volume |
893,882,738 |
+7% |
|
Volume |
5,240,924,000 |
+6% |
|
NASDAQ |
+59.40 |
17,192.53 |
+0.35% |
|
Advancers |
1,369 |
50% |
|
Advancers |
2,131 |
50% |
|
S&P 500 |
+13.80 |
5,360.79 |
+0.26% |
|
Decliners |
1,376 |
50% |
|
Decliners |
2,169 |
50% |
|
Russell 2000 |
+5.06 |
2,031.61 |
+0.25% |
|
52 Wk Highs |
65 |
|
|
52 Wk Highs |
88 |
|
|
S&P 600 |
-6.01 |
1,290.42 |
-0.46% |
|
52 Wk Lows |
60 |
|
|
52 Wk Lows |
176 |
|
|
 |
Major Indices Overcame Early Weakness to End Higher
Kenneth J. Gruneisen - Passed the CAN SLIM® Master's Exam
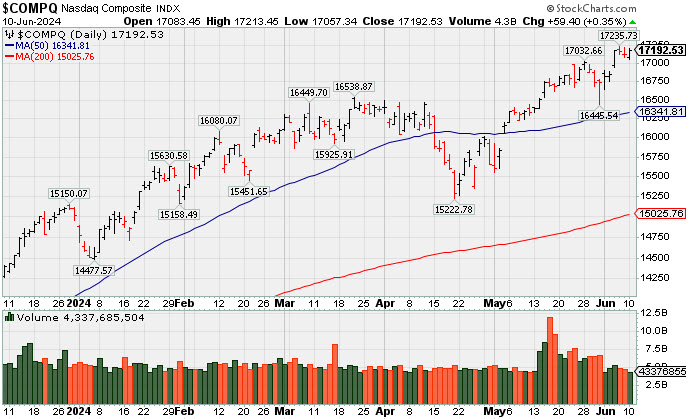
The S&P 500 was down -0.3% at its low on Monday yet recovered and closed +0.3% higher, which marked a fresh all-time high for the benchmark index. The Nasdaq Composite also logged a new record high, closing with a +0.4% gain. Volume totals reported were higher than the prior session on the NYSE and on the Nasdaq exchange. Market breadth was fairly even as decliners matched advancers at the NYSE and on at the Nasdaq. There were 27 high-ranked companies from the Leaders List that hit new 52-week highs and were listed on the BreakOuts Page versus the total of 19 on the prior session. New 52-week highs slightly outnumbered new 52-week lows on the NYSE but new lows outnumbered new highs by 2-1 on the Nasdaq exchange. The major indices are in a confirmed uptrend (M criteria) that recently endured some pressure. Disciplined investors will watch for encouraging new highs totals to see the market showing some broad-based strength and resiience. Any uptrend requires healthy leadership.
PICTURED: The Nasdaq Composite Index is consolidating near its all-time high.
NVIDIA (NVDA +0.75%) ended slighty higher after it trraded down as much as -3.2% at the session low. This rebound action boosted the PHLX Semiconductor Index (SOX) which closed +1.4% higher after trading down as much as -0.9% earlier. Apple (AAPL -1.91%) lost ground and was an exception in the mega cap space after introducing "Apple Intelligence," the personal intelligence system for iPhone, iPad, and Mac, at its Worldwide Developers Conference. Eli Lilly (LLY +1.77%) was an influential winner today after an FDA advisory panel voted 11-0 to recommend LLY's donanemab as a treatment for early stage Alzheimer's disease.
A fresh $58 billion 3-yr note sale met soft demand. The 10-yr note yield rose four basis points to 4.47% and the 2-yr note yield rose one basis point to 4.88%. This week the economic calendar includes Wednesday's release of the May Consumer Price Index and the latest FOMC policy decision along with an updated Summary of Economic Projections and Fed Chair Powell's press conference.
|
 Kenneth J. Gruneisen started out as a licensed stockbroker in August 1987, a couple of months prior to the historic stock market crash that took the Dow Jones Industrial Average down -22.6% in a single day. He has published daily fact-based fundamental and technical analysis on high-ranked stocks online for two decades. Through FACTBASEDINVESTING.COM, Kenneth provides educational articles, news, market commentary, and other information regarding proven investment systems that work in good times and bad.
Comments contained in the body of this report are technical opinions only and are not necessarily those of Gruneisen Growth Corp. The material herein has been obtained from sources believed to be reliable and accurate, however, its accuracy and completeness cannot be guaranteed. Our firm, employees, and customers may effect transactions, including transactions contrary to any recommendation herein, or have positions in the securities mentioned herein or options with respect thereto. Any recommendation contained in this report may not be suitable for all investors and it is not to be deemed an offer or solicitation on our part with respect to the purchase or sale of any securities. |
|
 |
Retail, Broker/Dealer, Semi, and Commodity-Linked Groups Rose
Kenneth J. Gruneisen - Passed the CAN SLIM® Master's Exam
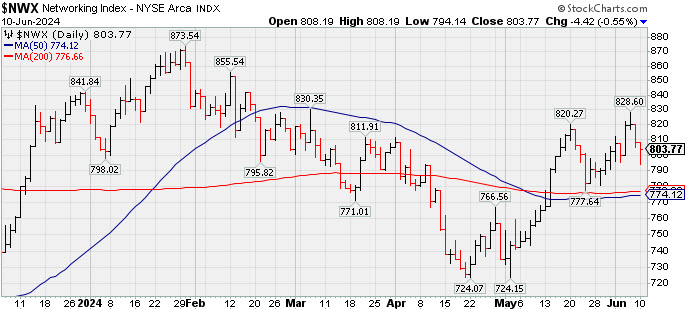
The Retail Index ($RLX +1.19%) and the Broker/Dealer Index ($XBD +0.84%) both posted gains while the Bank Index ($BKX -0.85%) ended lower. The tech sector was mixed as the Networking Index ($NWX -0.55%) edged lower and the Biotech Index ($BTK -0.05%) was little changed while the Semiconductor Index ($SOX +1.42%) posted a solid gain. The Oil Services Index ($OSX +2.93%), Integrated Oil Index ($XOI +0.80%), and the Gold & Silver Index ($XAU +1.45%) posted unanimous gains.
![]() PICTURED: The Networking Index ($NWX -0.55%) edged lower, consolidating above its 50-day and 200-day moving average (DMA) lines.
| Oil Services |
$OSX |
83.03 |
+2.36 |
+2.93% |
-1.01% |
| Integrated Oil |
$XOI |
2,025.03 |
+16.08 |
+0.80% |
+8.73% |
| Semiconductor |
$SOX |
5,362.40 |
+75.16 |
+1.42% |
+28.43% |
| Networking |
$NWX |
803.77 |
-4.42 |
-0.55% |
-3.49% |
| Broker/Dealer |
$XBD |
629.79 |
+5.28 |
+0.84% |
+13.01% |
| Retail |
$RLX |
4,449.44 |
+52.48 |
+1.19% |
+14.42% |
| Gold & Silver |
$XAU |
138.18 |
+1.98 |
+1.45% |
+9.93% |
| Bank |
$BKX |
102.09 |
-0.87 |
-0.85% |
+6.32% |
| Biotech |
$BTK |
5,243.63 |
-2.75 |
-0.05% |
-3.23% |
|
|
|
 |
Featured Stocks
Kenneth J. Gruneisen - Passed the CAN SLIM® Master's Exam
|
|
|
Color Codes Explained :
Y - Better candidates highlighted by our
staff of experts.
G - Previously featured
in past reports as yellow but may no longer be buyable under the
guidelines.
***Last / Change / Volume data in this table is the closing quote data***
Symbol/Exchange
Company Name
Industry Group |
PRICE |
CHANGE
(%Change) |
Day High |
Volume
(% DAV)
(% 50 day avg vol) |
52 Wk Hi
% From Hi |
Featured
Date |
Price
Featured |
Pivot Featured |
|
Max Buy |
 TDG
-
NYSE
TDG
-
NYSE
TransDigm Group
Aerospace/Defense
|
$1,305.99
|
-4.01
-0.31% |
$1,317.12
|
247,971
120.37% of 50 DAV
50 DAV is 206,000
|
$1,369.58
-4.64%
|
4/12/2024
|
$1,224.21
|
PP = $1,246.32
|
|
MB = $1,308.64
|
Most Recent Note - 6/6/2024 3:52:40 PM
G - Touched a new all-time high today but again made a "negative reversal". It is extended from any sound base and its 50 DMA line ($1,271) defines near-term support to watch on pullbacks. Fundamentals remain strong.
>>> FEATURED STOCK ARTICLE : Aerospace/Defense Firm Hitting Another All-Time High - 5/21/2024 |
View all notes |
Set NEW NOTE alert |
Company Profile |
SEC
News |
Chart |
Request a new note
C
A
S
I |
USLM
-
NASDAQ
U.S. Lime & Minerals
Bldg-Cement/Concrt/Ag
|
$328.66
|
+6.05
1.88% |
$328.66
|
23,146
92.58% of 50 DAV
50 DAV is 25,000
|
$378.78
-13.23%
|
2/9/2024
|
$254.68
|
PP = $265.09
|
|
MB = $278.34
|
Most Recent Note - 6/6/2024 9:50:42 PM
G - Suffered a 15th loss in the span of 16 sessions and testing its 50 DMA line ($327) which defines important near-term support to watch. More damaging losses would raise concerns and trigger a technical sell signal. Fundamentals remain strong. See the latest FSU analysis for more details and a new annotated graph.
>>> FEATURED STOCK ARTICLE : Streak of Losses Testing 50-Day Moving Average Line - 6/6/2024 |
View all notes |
Set NEW NOTE alert |
Company Profile |
SEC
News |
Chart |
Request a new note
C
A
S
I |
CLS
-
NYSE
Celestica
Elec-Contract Mfg
|
$54.54
|
+2.29
4.38% |
$54.84
|
1,481,429
62.24% of 50 DAV
50 DAV is 2,380,000
|
$61.06
-10.68%
|
5/15/2024
|
$51.52
|
PP = $51.22
|
|
MB = $53.78
|
 Most Recent Note - 6/10/2024 5:06:36 PM
G - Posted a solid gain today with lighter than average volume. Prior highs in the $51 area define initial support to watch above its 50 DMA line.
>>> FEATURED STOCK ARTICLE : Steady Pullback to Below "Max Buy" Level Following Rally - 6/4/2024 |
View all notes |
Set NEW NOTE alert |
Company Profile |
SEC
News |
Chart |
Request a new note
C
A
S
I |
DECK
-
NYSE
Deckers Outdoor
Apparel-Shoes and Rel Mfg
|
$1,054.95
|
+10.64
1.02% |
$1,056.88
|
280,759
77.99% of 50 DAV
50 DAV is 360,000
|
$1,106.89
-4.69%
|
5/24/2024
|
$1,010.60
|
PP = $956.27
|
|
MB = $1,004.08
|
Most Recent Note - 6/6/2024 3:50:43 PM
G - Pulling back today with lighter volume. It has been stubbornly holding its ground near its all-time high following noted volume-driven gains, extended from prior highs in the $956 area that define initial support to watch on pullbacks.
>>> FEATURED STOCK ARTICLE : Big "Breakaway Gap" for Deckers Outdoor - 5/24/2024 |
View all notes |
Set NEW NOTE alert |
Company Profile |
SEC
News |
Chart |
Request a new note
C
A
S
I |
ELF
-
NYSE
e.l.f. Beauty
Cosmetics/Personal Care
|
$182.48
|
+4.85
2.73% |
$182.62
|
937,792
54.94% of 50 DAV
50 DAV is 1,707,000
|
$221.83
-17.74%
|
5/24/2024
|
$193.79
|
PP = $182.73
|
|
MB = $191.87
|
Most Recent Note - 6/10/2024 5:07:53 PM
Y - Managed a "positive reversal" for a gain today with below-average volume, quietly consolidating below its pivot point after breaking out a "double-bottom" base. Prior low ($177.99 pn 5/31/24) and 50 DMA line ($171) define important near-term support to watch.
>>> FEATURED STOCK ARTICLE : Down on Lighter Volume After Breakout From "Double Bottom" Base - 5/29/2024 |
View all notes |
Set NEW NOTE alert |
Company Profile |
SEC
News |
Chart |
Request a new note
C
A
S
I |
Symbol/Exchange
Company Name
Industry Group |
PRICE |
CHANGE
(%Change) |
Day High |
Volume
(% DAV)
(% 50 day avg vol) |
52 Wk Hi
% From Hi |
Featured
Date |
Price
Featured |
Pivot Featured |
|
Max Buy |
PDD
-
NASDAQ
PDD Holdings ADR
Retail-Internet
|
$148.48
|
+4.58
3.18% |
$148.91
|
6,049,654
65.64% of 50 DAV
50 DAV is 9,216,000
|
$164.69
-9.84%
|
5/24/2024
|
$161.85
|
PP = $153.09
|
|
MB = $160.74
|
Most Recent Note - 6/10/2024 5:11:56 PM
Y - Posted a 3rd consecutive gain with below average volume. Raised concerns recently as it negated the breakout after clearing a 20-week base. Disciplined investors avoid big losses by selling any stock that falls more than 7-8% below their purchase price.
>>> FEATURED STOCK ARTICLE : Pulled Back Below Prior Highs Raising Concerns - 5/28/2024 |
View all notes |
Set NEW NOTE alert |
Company Profile |
SEC
News |
Chart |
Request a new note
C
A
S
I |
CRWD
-
NASDAQ
CrowdStrike Holdings
Computer Sftwr-Security
|
$374.57
|
+25.45
7.29% |
$384.98
|
15,548,742
516.91% of 50 DAV
50 DAV is 3,008,000
|
$365.00
2.62%
|
5/28/2024
|
$351.47
|
PP = $365.10
|
|
MB = $383.36
|
Most Recent Note - 6/10/2024 12:44:26 PM
Y - Hitting a new all-time high with today's big "breakaway gap" and volume-driven gain triggering a technical buy signal. Rebounded above its 50 DMA line ($319) last week. Bullish action came after it reported Apr '24 quarterly earnings +63% on +33% sales revenues versus the year-ago period, continuing its strong earnings track record. Recent lows define important near-term support to watch on pullbacks.
>>> FEATURED STOCK ARTICLE : Volume-Driven Loss Triggered Technical Sell Signal - 5/30/2024 |
View all notes |
Set NEW NOTE alert |
Company Profile |
SEC
News |
Chart |
Request a new note
C
A
S
I |
NVO
-
NYSE
Novo Nordisk ADR
Medical-Ethical Drugs
|
$143.63
|
+0.75
0.52% |
$143.94
|
3,119,834
83.02% of 50 DAV
50 DAV is 3,758,000
|
$143.73
-0.07%
|
6/7/2024
|
$143.06
|
PP = $138.38
|
|
MB = $145.30
|
Most Recent Note - 6/10/2024 5:10:26 PM
Y - Posted an 8th consecutive gain today and lighter volume has been behind recent gains while wedging to new all-time highs. Color code was changed to yellow with pivot point cited based on its 3/07/24 high. o clinch a proper technical buy signal gains above the pivot point must be backed by at least +40% above-average volume. Fundamentals remain strong. See the latest FSU analysis for more details and ab annotated graph.
>>> FEATURED STOCK ARTICLE : Wedging Into New High Ground - 6/7/2024 |
View all notes |
Set NEW NOTE alert |
Company Profile |
SEC
News |
Chart |
Request a new note
C
A
S
I |
|
|
|
THESE ARE NOT BUY RECOMMENDATIONS!
Comments contained in the body of this report are technical
opinions only. The material herein has been obtained
from sources believed to be reliable and accurate, however,
its accuracy and completeness cannot be guaranteed.
This site is not an investment advisor, hence it does
not endorse or recommend any securities or other investments.
Any recommendation contained in this report may not
be suitable for all investors and it is not to be deemed
an offer or solicitation on our part with respect to
the purchase or sale of any securities. All trademarks,
service marks and trade names appearing in this report
are the property of their respective owners, and are
likewise used for identification purposes only.
This report is a service available
only to active Paid Premium Members.
You may opt-out of receiving report notifications
at any time. Questions or comments may be submitted
by writing to Premium Membership Services 665 S.E. 10 Street, Suite 201 Deerfield Beach, FL 33441-5634 or by calling 1-800-965-8307
or 954-785-1121.
|
|
|