You are not logged in.
This means you
CAN ONLY VIEW reports that were published prior to Monday, April 28, 2025.
You
MUST UPGRADE YOUR MEMBERSHIP if you want to see any current reports.
AFTER MARKET UPDATE - FRIDAY, MAY 31ST, 2024
Previous After Market Report Next After Market Report >>>
|
|
|
|
DOW |
+574.84 |
38,686.32 |
+1.51% |
|
Volume |
2,005,562,155 |
+120% |
|
Volume |
6,788,449,900 |
-1% |
|
NASDAQ |
-2.06 |
16,735.02 |
-0.01% |
|
Advancers |
2,145 |
78% |
|
Advancers |
2,517 |
60% |
|
S&P 500 |
+42.03 |
5,277.51 |
+0.80% |
|
Decliners |
614 |
22% |
|
Decliners |
1,679 |
40% |
|
Russell 2000 |
+13.53 |
2,070.13 |
+0.66% |
|
52 Wk Highs |
110 |
|
|
52 Wk Highs |
83 |
|
|
S&P 600 |
+14.12 |
1,329.65 |
+1.07% |
|
52 Wk Lows |
34 |
|
|
52 Wk Lows |
102 |
|
|
 |
Major Indices' Late Rally Showed Encouraging Market Resilience
Kenneth J. Gruneisen - Passed the CAN SLIM® Master's Exam
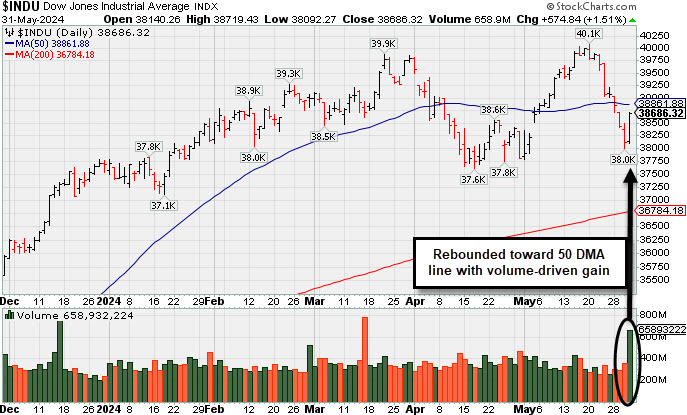
The major indices closed at or near Friday's highs helped by a surge of buying activity in the last 20 minutes of trading, action likely driven by short-covering and month-end positioning. Volume was higher than the prior session on the NYSE and lower on the Nasdaq exchange. Breadth was positive as advancers led decliners by more than a 3-1 margin on the NYSE and by a 5-3 margin on the Nasdaq exchange. Leadership improved as there were 43 high-ranked companies from the Leaders List that hit new 52-week highs and were listed on the BreakOuts Page versus the total of 31 on the prior session. New 52-week highs outnumbered new 52-week lows on the NYSE but new lows outnumbered new highs for a thrid conmsecutiev session on the Nasdaq exchange. The major indices are in a confirmed uptrend (M criteria) that recently endured some pressure. It was encouraging to see the market show some broad-based resiience.
PICTURED: The Dow Jones Industrial Average posted a solid volume-driven gain on Friday, rebounding toward its 50-day moving average (DMA) line which may act as resistance.
Ten of the 11 S&P 500 sectors closed higher on Friday while 8 of the sectors logged gains greater than +1.0%. The release of the April Personal Income and Spending Report turned out better than feared, however, it reflected no improvement in inflation. Treasury yields moved lower in response. The 10-yr note yield dropped four basis points to 4.51%. The 2-yr note yield settled four basis points lower at 4.89%.
Growth stocks struggled to generate optimism after Dell (DELL -17.87%) reported disappointing earnings. |
 Kenneth J. Gruneisen started out as a licensed stockbroker in August 1987, a couple of months prior to the historic stock market crash that took the Dow Jones Industrial Average down -22.6% in a single day. He has published daily fact-based fundamental and technical analysis on high-ranked stocks online for two decades. Through FACTBASEDINVESTING.COM, Kenneth provides educational articles, news, market commentary, and other information regarding proven investment systems that work in good times and bad.
Comments contained in the body of this report are technical opinions only and are not necessarily those of Gruneisen Growth Corp. The material herein has been obtained from sources believed to be reliable and accurate, however, its accuracy and completeness cannot be guaranteed. Our firm, employees, and customers may effect transactions, including transactions contrary to any recommendation herein, or have positions in the securities mentioned herein or options with respect thereto. Any recommendation contained in this report may not be suitable for all investors and it is not to be deemed an offer or solicitation on our part with respect to the purchase or sale of any securities. |
|
 |
Financial and Energy-Linked Groups Led Gainers
Kenneth J. Gruneisen - Passed the CAN SLIM® Master's Exam
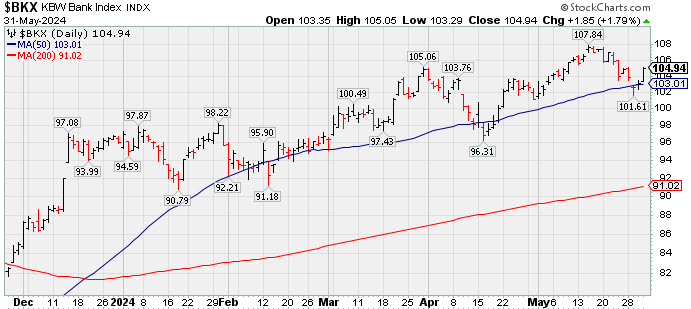
The Bank Index ($BKX +1.79%) posted a solid gain that outpaced the Broker/Dealer Index ($XBD +0.39%), meanwhile, the Retail Index ($RLX -0.55%) edged lower and created a drag on the major indices. The tech sector was mixed as the Semiconductor Index ($SOX -0.96%) suffered a loss while the Biotech Index ($BTK +0.32%) and the Networking Index ($NWX +0.75%) both posted modest gains. Energy-linked groups had a positive bias as the Oil Services ($OSX +2.05%) and the Integrated Oil Index ($XOI +2.38%) both posted solid gains while the Gold & Silver Index ($XAU -0.52%) edged lower.
![]() PICTURED: The Bank Index ($BKX +1.79%) posted a solid gain on Friday, ending the month by finding prompt support near its 50-day moving average (DMA) line.
| Oil Services |
$OSX |
86.37 |
+1.74 |
+2.05% |
+2.97% |
| Integrated Oil |
$XOI |
2,092.13 |
+48.61 |
+2.38% |
+12.33% |
| Semiconductor |
$SOX |
5,123.36 |
-49.90 |
-0.96% |
+22.70% |
| Networking |
$NWX |
802.41 |
+5.95 |
+0.75% |
-3.65% |
| Broker/Dealer |
$XBD |
628.88 |
+2.47 |
+0.39% |
+12.85% |
| Retail |
$RLX |
4,286.35 |
-23.88 |
-0.55% |
+10.22% |
| Gold & Silver |
$XAU |
145.16 |
-0.76 |
-0.52% |
+15.49% |
| Bank |
$BKX |
104.94 |
+1.85 |
+1.79% |
+9.29% |
| Biotech |
$BTK |
5,131.21 |
+16.61 |
+0.32% |
-5.31% |
|
|
|
 |
Featured Stocks
Kenneth J. Gruneisen - Passed the CAN SLIM® Master's Exam
Symbol/Exchange
Company Name
Industry Group | PRICE | CHANGE
(%Change) | Day High | Volume
(% DAV)
(% 50 day avg vol) | 52 Wk Hi
% From Hi | Featured
Date | Price
Featured | Pivot Featured | | Max Buy |  TDG - NYSE TDG - NYSE
TransDigm Group
Aerospace/Defense | $1,343.23 | +21.38
1.62% | $1,348.89 | 297,496
150.25% of 50 DAV
50 DAV is 198,000 | $1,363.66
-1.50%
| 4/12/2024 | $1,224.21 | PP = $1,246.32 | | MB = $1,308.64 | Most Recent Note - 5/29/2024 2:25:22 PM
G - There was a "negative reversal" on the prior session after hitting yet another new all-time high. It is extended from any sound base and its 50 DMA line ($1,257) defines near-term support to watch on pullbacks. Fundamentals remain strong.
>>> FEATURED STOCK ARTICLE : Aerospace/Defense Firm Hitting Another All-Time High - 5/21/2024 | View all notes | Set NEW NOTE alert | Company Profile | SEC News | Chart | Request a new note C A S I | USLM - NASDAQ
U.S. Lime & Minerals
Bldg-Cement/Concrt/Ag | $342.74 | -3.04
-0.88% | $353.00 | 24,388
97.55% of 50 DAV
50 DAV is 25,000 | $378.78
-9.51%
| 2/9/2024 | $254.68 | PP = $265.09 | | MB = $278.34 | Most Recent Note - 5/30/2024 6:13:44 PM
G - Posted a small gain today with below average volume, breaking a streak of 10 consecutive small losses. Its 50 DMA line ($323.25) defines important near-term support to watch. Fundamentals remain strong.
>>> FEATURED STOCK ARTICLE : Stubbornly Held Ground and Posted Quiet Gain for Best-Ever Close - 5/14/2024 | View all notes | Set NEW NOTE alert | Company Profile | SEC News | Chart | Request a new note C A S I | CLS - NYSE
Celestica
Elec-Contract Mfg | $55.92 | -1.48
-2.58% | $57.49 | 3,632,905
159.55% of 50 DAV
50 DAV is 2,277,000 | $61.06
-8.42%
| 5/15/2024 | $51.52 | PP = $51.22 | | MB = $53.78 |  Most Recent Note - 5/31/2024 1:00:16 PM Most Recent Note - 5/31/2024 1:00:16 PM
G - Pulling back today with ever-increasing volume behind its 3rd consecutive loss, retreating from its all-time high. Noted recently - "Extended from the previously noted base. Prior highs in the $51 area define initial support to watch above its 50 DMA line ($47.83)."
>>> FEATURED STOCK ARTICLE : Strong Breakout After 6-Week Flat Base - 5/15/2024 | View all notes | Set NEW NOTE alert | Company Profile | SEC News | Chart | Request a new note C A S I | AROC - NYSE
Archrock
OilandGas-Machinery/Equip | $20.24 | +0.55
2.79% | $20.33 | 2,019,508
136.27% of 50 DAV
50 DAV is 1,482,000 | $21.61
-6.34%
| 5/20/2024 | $21.23 | PP = $21.50 | | MB = $22.58 | Most Recent Note - 5/31/2024 5:29:28 PM
Y - Posted a volume-driven gain today rebounding above its 50 DMA line ($20) helping its outlook improve and its color code was changed to yellow. The recent lows in the $19 area define important near-term support to watch on pullbacks.
>>> FEATURED STOCK ARTICLE : Strong Finish for Archrock After Highlighted in Mid-Day Report - 5/20/2024 | View all notes | Set NEW NOTE alert | Company Profile | SEC News | Chart | Request a new note C A S I | DECK - NYSE
Deckers Outdoor
Apparel-Shoes and Rel Mfg | $1,093.92 | +11.34
1.05% | $1,094.62 | 571,378
153.18% of 50 DAV
50 DAV is 373,000 | $1,095.48
-0.14%
| 5/24/2024 | $1,010.60 | PP = $956.27 | | MB = $1,004.08 | Most Recent Note - 5/30/2024 6:12:18 PM
G - Hit another new all-time high with today''s gain. Rallied well above its "max buy" level, quickly getting extended from prior highs in the $956 area that define initial support to watch on pullbacks.
>>> FEATURED STOCK ARTICLE : Big "Breakaway Gap" for Deckers Outdoor - 5/24/2024 | View all notes | Set NEW NOTE alert | Company Profile | SEC News | Chart | Request a new note C A S I | Symbol/Exchange
Company Name
Industry Group | PRICE | CHANGE
(%Change) | Day High | Volume
(% DAV)
(% 50 day avg vol) | 52 Wk Hi
% From Hi | Featured
Date | Price
Featured | Pivot Featured | | Max Buy | ELF - NYSE
e.l.f. Beauty
Cosmetics/Personal Care | $186.91 | +4.51
2.47% | $187.41 | 1,427,321
84.91% of 50 DAV
50 DAV is 1,681,000 | $221.83
-15.74%
| 5/24/2024 | $193.79 | PP = $182.73 | | MB = $191.87 | Most Recent Note - 5/31/2024 5:32:15 PM
Y - Managed a "positive reversal" for a gain with light volume today. Color code was changed to yellow in the 5/24/24 mid-day report with pivot point cited based on its 4/29/24 high after breaking out a "double-bottom" base. Rallied further after gapping up and rebounding above its 50 DMA line ($172.67) helping its technical stance and outlook improve. See the latest FSU analysis for more details and an annotated graph.
>>> FEATURED STOCK ARTICLE : Down on Lighter Volume After Breakout From "Double Bottom" Base - 5/29/2024 | View all notes | Set NEW NOTE alert | Company Profile | SEC News | Chart | Request a new note C A S I | PDD - NASDAQ
PDD Holdings ADR
Retail-Internet | $149.78 | -2.25
-1.48% | $150.49 | 7,138,084
68.05% of 50 DAV
50 DAV is 10,490,000 | $164.69
-9.05%
| 5/24/2024 | $161.85 | PP = $153.09 | | MB = $160.74 | Most Recent Note - 5/29/2024 12:29:50 PM
Y - Consolidating near prior highs, showing resilience today with a "positive reversal" after undercutting the prior high raising concerns. Color code was changed to yellow in the 5/24/24 mid-day report with pivot point cited based on its 1/11/24 high plus 10 cents. Rallied to new 52-week highs with 3 consecutive volume-driven gains clearing a 20-week base during which it found prompt support at its 200 DMA line. Quarterly comparisons through Mar '24 showed encouraging sales revenues and greatly improved earnings versus the year-ago periods with growth rate acceleration. After years of losses, it had a profitable FY '21-23 helping it better match the fundamental annual earnings (A criteria) guidelines of the fact-based investment system. See the latest FSU analysis for more details and an annotated graph.
>>> FEATURED STOCK ARTICLE : Pulled Back Below Prior Highs Raising Concerns - 5/28/2024 | View all notes | Set NEW NOTE alert | Company Profile | SEC News | Chart | Request a new note C A S I | CRWD - NASDAQ
CrowdStrike Holdings
Computer Sftwr-Security | $313.67 | -2.25
-0.71% | $329.77 | 5,312,851
217.74% of 50 DAV
50 DAV is 2,440,000 | $365.00
-14.06%
| 5/28/2024 | $351.47 | PP = $365.10 | | MB = $383.36 | Most Recent Note - 5/30/2024 6:07:01 PM
G - Color code is changed to green after violating its 50 DMA line ($318) with a volume-driven loss today triggering a technical sell signal. Due to report Apr '24 quarterly results on 6/04/24. See the latest FSU analysis for more details and a new annotated graph.
>>> FEATURED STOCK ARTICLE : Volume-Driven Loss Triggered Technical Sell Signal - 5/30/2024 | View all notes | Set NEW NOTE alert | Company Profile | SEC News | Chart | Request a new note C A S I |
|
|
|
Color Codes Explained :
Y - Better candidates highlighted by our
staff of experts.
G - Previously featured
in past reports as yellow but may no longer be buyable under the
guidelines.
***Last / Change / Volume data in this table is the closing quote data***
|
|
|
THESE ARE NOT BUY RECOMMENDATIONS!
Comments contained in the body of this report are technical
opinions only. The material herein has been obtained
from sources believed to be reliable and accurate, however,
its accuracy and completeness cannot be guaranteed.
This site is not an investment advisor, hence it does
not endorse or recommend any securities or other investments.
Any recommendation contained in this report may not
be suitable for all investors and it is not to be deemed
an offer or solicitation on our part with respect to
the purchase or sale of any securities. All trademarks,
service marks and trade names appearing in this report
are the property of their respective owners, and are
likewise used for identification purposes only.
This report is a service available
only to active Paid Premium Members.
You may opt-out of receiving report notifications
at any time. Questions or comments may be submitted
by writing to Premium Membership Services 665 S.E. 10 Street, Suite 201 Deerfield Beach, FL 33441-5634 or by calling 1-800-965-8307
or 954-785-1121.
|
|
|