***Last / Change / Volume data in this table is the closing quote data***
Symbol/Exchange
Company Name
Industry Group |
PRICE |
CHANGE
(%Change) |
Day High |
Volume
(% DAV)
(% 50 day avg vol) |
52 Wk Hi
% From Hi |
Featured
Date |
Price
Featured |
Pivot Featured |
|
Max Buy |
BIDU
-
NASDAQ
Baidu Inc Ads
INTERNET - Internet Information Providers
|
$133.67
|
-1.25
-0.93% |
$136.30
|
6,489,274
92.92% of 50 DAV
50 DAV is 6,983,400
|
$136.49
-2.07%
|
3/17/2011
|
$121.97
|
PP = $131.73
|
|
MB = $138.32
|
Most Recent Note - 3/25/2011 11:55:01 AM
Y - Up today for a 5th consecutive gain and another new all-time high. Its gain with 2 times average volume on 3/23/11 triggered a technical buy signal after a riskier "late stage" set-up. The M criteria remains a concern until a follow-through day confirms the new rally and justifies new buying efforts under the system's strict guidelines. Prior high near $131 defines initial chart support to watch.
>>> The latest Featured Stock Update with an annotated graph appeared on 3/9/2011. Click here.
View all notes |
Alert me of new notes |
CANSLIM.net Company Profile |
SEC |
Zacks Reports |
StockTalk |
News |
Chart |
Request a new note
C
A N
S L
I M


|
CMG
-
NYSE
Chipotle Mexican Grill
LEISURE - Restaurants
|
$257.96
|
+1.22
0.48% |
$263.53
|
1,012,554
93.92% of 50 DAV
50 DAV is 1,078,100
|
$275.00
-6.20%
|
2/11/2011
|
$271.15
|
PP = $262.87
|
|
MB = $276.01
|
Most Recent Note - 3/25/2011 11:09:01 AM
G - Rising from support at its 50 DMA line with gains this week backed by light volume. Its recent low ($234.48 on 3/02/11) defines another important nearby level for chart readers to watch closely. Subsequent violations and damaging losses would raise greater concerns and trigger technical sell signals.
>>> The latest Featured Stock Update with an annotated graph appeared on 3/14/2011. Click here.
View all notes |
Alert me of new notes |
CANSLIM.net Company Profile |
SEC |
Zacks Reports |
StockTalk |
News |
Chart |
Request a new note
C
A N
S L
I M
|
CTCT
-
NASDAQ
Constant Contact Inc
MEDIA - Advertising Services
|
$33.38
|
-1.88
-5.33% |
$36.13
|
695,965
180.16% of 50 DAV
50 DAV is 386,300
|
$35.98
-7.23%
|
3/22/2011
|
$33.59
|
PP = $32.49
|
|
MB = $34.11
|
 Most Recent Note - 3/28/2011 7:07:46 PM
G - Finished near the session low today after a negative reversal for a considerable loss on above average volume. Prior highs in the $32 area define support to watch above its 50 DMA line.
>>> The latest Featured Stock Update with an annotated graph appeared on 3/22/2011. Click here.
View all notes |
Alert me of new notes |
CANSLIM.net Company Profile |
SEC |
Zacks Reports |
StockTalk |
News |
Chart |
Request a new note
C
A N
S L
I M
|
CTSH
-
NASDAQ
Cognizant Tech Sol Cl A
COMPUTER SOFTWARE and SERVICES - Business Software and Services
|
$79.57
|
-0.46
-0.57% |
$80.45
|
1,938,717
80.33% of 50 DAV
50 DAV is 2,413,300
|
$81.17
-1.97%
|
2/7/2011
|
$75.09
|
PP = $76.46
|
|
MB = $80.28
|
Most Recent Note - 3/25/2011 11:15:48 AM
Y - Hitting another new 52-week high (N criteria) today, with no resistance remaining due to overhead supply. Volume on the prior session was only +11% above average while it rallied above its pivot point, not heavy enough to trigger a proper technical buy signal. Disciplined investors also know that a follow-through day (FTD) is needed to confirm the market direction (M criteria) is again favorable for new buying efforts.
>>> The latest Featured Stock Update with an annotated graph appeared on 3/17/2011. Click here.
View all notes |
Alert me of new notes |
CANSLIM.net Company Profile |
SEC |
Zacks Reports |
StockTalk |
News |
Chart |
Request a new note
C
A N
S L
I M
|
DECK
-
NASDAQ
Deckers Outdoor Corp
CONSUMER NON-DURABLES - Textile - Apparel Footwear
|
$83.37
|
+0.06
0.07% |
$85.84
|
726,098
49.35% of 50 DAV
50 DAV is 1,471,400
|
$94.70
-11.96%
|
2/3/2011
|
$79.61
|
PP = $82.67
|
|
MB = $86.80
|
Most Recent Note - 3/28/2011 3:48:51 PM
Y - Today's 4th consecutive gain with light volume has it continuing to rebound back above its 50 DMA line. Color code is changed to yellow based on its resilience after slumping below its latest pivot point, but it has not formed a sound new base. Its recent low ($77.71 on 3/21/11) defines the next important chart support level.
>>> The latest Featured Stock Update with an annotated graph appeared on 3/3/2011. Click here.
View all notes |
Alert me of new notes |
CANSLIM.net Company Profile |
SEC |
Zacks Reports |
StockTalk |
News |
Chart |
Request a new note
C
A N
S L
I M
|
Symbol/Exchange
Company Name
Industry Group |
PRICE |
CHANGE
(%Change) |
Day High |
Volume
(% DAV)
(% 50 day avg vol) |
52 Wk Hi
% From Hi |
Featured
Date |
Price
Featured |
Pivot Featured |
|
Max Buy |
EZPW
-
NASDAQ
Ezcorp Inc Cl A
SPECIALTY RETAIL - Specialty Retail, Other
|
$31.32
|
+0.14
0.45% |
$31.62
|
246,723
62.52% of 50 DAV
50 DAV is 394,600
|
$31.80
-1.51%
|
2/18/2011
|
$27.94
|
PP = $30.04
|
|
MB = $31.54
|
Most Recent Note - 3/25/2011 1:06:04 PM
G - Gapped up again today and rallied above its "max buy" level. Color code is changed to green after getting extended from its latest base. As previously noted - "A follow-through day from at least one of the major averages (M criteria) is also necessary in order to justify new (or add-on) buying efforts under the system's guidelines."
>>> The latest Featured Stock Update with an annotated graph appeared on 3/10/2011. Click here.
View all notes |
Alert me of new notes |
CANSLIM.net Company Profile |
SEC |
Zacks Reports |
StockTalk |
News |
Chart |
Request a new note
C
A N
S L
I M
|
FOSL
-
NASDAQ
Fossil Inc
CONSUMER DURABLES - Recreational Goods, Other
|
$88.25
|
-0.28
-0.32% |
$89.20
|
697,014
72.49% of 50 DAV
50 DAV is 961,500
|
$89.42
-1.31%
|
2/1/2011
|
$73.30
|
PP = $74.44
|
|
MB = $78.16
|
Most Recent Note - 3/25/2011 10:31:43 AM
G - Up today for a 5th consecutive gain and another new all-time high, getting more extended from any sound base. Support to watch is at its 50 DMA line.
>>> The latest Featured Stock Update with an annotated graph appeared on 2/24/2011. Click here.
View all notes |
Alert me of new notes |
CANSLIM.net Company Profile |
SEC |
Zacks Reports |
StockTalk |
News |
Chart |
Request a new note
C
A N
S L
I M
|
HMSY
-
NASDAQ
H M S Holdings Corp
COMPUTER SOFTWARE and SERVICES - Healthcare Information Service
|
$81.33
|
-0.21
-0.26% |
$82.16
|
153,063
91.38% of 50 DAV
50 DAV is 167,500
|
$83.98
-3.16%
|
11/19/2010
|
$61.89
|
PP = $63.01
|
|
MB = $66.16
|
Most Recent Note - 3/25/2011 11:51:16 PM
G - Hit a new 52-week high today but reversed and closed near the session low. It has endured distributional pressure while advancing in recent weeks, and it is extended from any sound base pattern. See the latest FSU analysis for additional details and a new annotated graph.
>>> The latest Featured Stock Update with an annotated graph appeared on 3/25/2011. Click here.
View all notes |
Alert me of new notes |
CANSLIM.net Company Profile |
SEC |
Zacks Reports |
StockTalk |
News |
Chart |
Request a new note
C
A N
S L
I M
|
HS
-
NYSE
Healthspring Inc
HEALTH SERVICES - Health Care Plans
|
$36.85
|
+0.25
0.68% |
$37.11
|
1,238,329
173.07% of 50 DAV
50 DAV is 715,500
|
$39.19
-5.97%
|
3/22/2011
|
$38.29
|
PP = $38.85
|
|
MB = $40.79
|
Most Recent Note - 3/28/2011 7:17:04 PM
G - Held its ground today. Gapped down on 3/25/11 after pricing a new Public Offering of 7.5 million shares, holding its ground near recent lows and well above its 50 DMA line. It failed to convincingly rally for a close above its pivot point after touching a new 52-week high on 3/22/11, and its color code was changed to green after slumping more than -7% below its pivot point.
>>> The latest Featured Stock Update with an annotated graph appeared on 3/23/2011. Click here.
View all notes |
Alert me of new notes |
CANSLIM.net Company Profile |
SEC |
Zacks Reports |
StockTalk |
News |
Chart |
Request a new note
C
A N
S L
I M
|
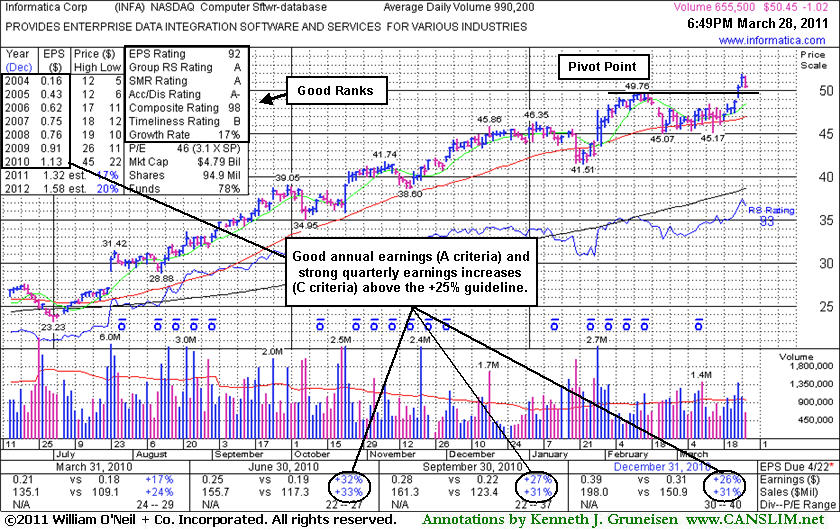
INFA
-
NASDAQ
Informatica Corp
COMPUTER SOFTWARE and SERVICES - Business Software and Services
|
$50.45
|
-1.02
-1.98% |
$51.71
|
659,676
66.62% of 50 DAV
50 DAV is 990,200
|
$51.97
-2.92%
|
3/24/2011
|
$50.04
|
PP = $49.86
|
|
MB = $52.35
|
Most Recent Note - 3/28/2011 7:30:12 PM
Y - Today's loss on lighter volume followed 6 consecutive gains. Prior highs in the $49 area define initial support to watch. See the latest FSU analysis for more details and a new annotated graph.
>>> The latest Featured Stock Update with an annotated graph appeared on 3/28/2011. Click here.
View all notes |
Alert me of new notes |
CANSLIM.net Company Profile |
SEC |
Zacks Reports |
StockTalk |
News |
Chart |
Request a new note
C
A N
S L
I M
|
Symbol/Exchange
Company Name
Industry Group |
PRICE |
CHANGE
(%Change) |
Day High |
Volume
(% DAV)
(% 50 day avg vol) |
52 Wk Hi
% From Hi |
Featured
Date |
Price
Featured |
Pivot Featured |
|
Max Buy |
LULU
-
NASDAQ
Lululemon Athletica
MANUFACTURING - Textile Manufacturing
|
$85.27
|
+6.63
8.43% |
$86.00
|
6,011,029
294.74% of 50 DAV
50 DAV is 2,039,400
|
$85.28
-0.01%
|
3/28/2011
|
$68.11
|
PP = $85.38
|
|
MB = $89.65
|
Most Recent Note - 3/28/2011 7:14:06 PM
Y - Considerable gain today with above average volume for a new 52-week high, but it failed to close above its pivot point for a convincing technical buy signal. Confirming gains with volume would be a reassurance to watch for, otherwise it is likely that prior highs may act as resistance. Color code was changed to yellow with new pivot point based on its 52-week high plus 10 cents after a new base-on-base pattern. The M criteria remains a concern, yet healthy leadership (new 52-week highs) has recently been a reassuring sign.
>>> The latest Featured Stock Update with an annotated graph appeared on 2/25/2011. Click here.
View all notes |
Alert me of new notes |
CANSLIM.net Company Profile |
SEC |
Zacks Reports |
StockTalk |
News |
Chart |
Request a new note
C
A N
S L
I M
|
MG
-
NYSE
Mistras Group Inc
DIVERSIFIED SERVICES - Bulding and Faci;ity Management Services
|
$17.11
|
+0.00
0.00% |
$17.19
|
72,533
70.76% of 50 DAV
50 DAV is 102,500
|
$17.23
-0.70%
|
3/15/2011
|
$15.48
|
PP = $15.90
|
|
MB = $16.70
|
Most Recent Note - 3/25/2011 5:05:59 PM
G - Inched up for another new high today after stubbornly holding its ground. It is getting more extended from a sound base pattern. Prior highs and its 50 DMA line define important support to watch.
>>> The latest Featured Stock Update with an annotated graph appeared on 3/15/2011. Click here.
View all notes |
Alert me of new notes |
CANSLIM.net Company Profile |
SEC |
Zacks Reports |
StockTalk |
News |
Chart |
Request a new note
C
A N
S L
I M
|
MWIV
-
NASDAQ
M W I Veterinary Supply
HEALTH SERVICES - Medical Instruments and; Supplies
|
$77.90
|
+2.56
3.40% |
$77.95
|
107,214
115.28% of 50 DAV
50 DAV is 93,000
|
$78.48
-0.74%
|
11/4/2010
|
$61.79
|
PP = $59.60
|
|
MB = $62.58
|
Most Recent Note - 3/28/2011 3:38:05 PM
G - Gain today has it poised for its second highest close ever. Consolidating in a tight range for the past 3 weeks, extended from any sound base pattern.
>>> The latest Featured Stock Update with an annotated graph appeared on 3/8/2011. Click here.
View all notes |
Alert me of new notes |
CANSLIM.net Company Profile |
SEC |
Zacks Reports |
StockTalk |
News |
Chart |
Request a new note
C
A N
S L
I M
|
OPEN
-
NASDAQ
Opentable Inc
INTERNET - Internet Software and Services
|
$104.29
|
+2.60
2.56% |
$106.15
|
1,279,363
114.35% of 50 DAV
50 DAV is 1,118,800
|
$103.73
0.54%
|
3/17/2011
|
$90.71
|
PP = $96.07
|
|
MB = $100.87
|
Most Recent Note - 3/28/2011 1:52:57 PM
G - Up again today for another new all-time high, getting more extended from its recently noted new base. Its prior high near $96 defines initial support to watch following its latest technical breakout.
>>> The latest Featured Stock Update with an annotated graph appeared on 3/24/2011. Click here.
View all notes |
Alert me of new notes |
CANSLIM.net Company Profile |
SEC |
Zacks Reports |
StockTalk |
News |
Chart |
Request a new note
C
A N
S L
I M
|
PAY
-
NYSE
Verifone Systems Inc
COMPUTER HARDWARE - Transaction Automation Systems
|
$54.88
|
+2.08
3.94% |
$56.00
|
2,645,659
140.35% of 50 DAV
50 DAV is 1,885,000
|
$54.04
1.55%
|
1/27/2011
|
$41.77
|
PP = $44.97
|
|
MB = $47.22
|
Most Recent Note - 3/28/2011 1:49:34 PM
G - Up today for another new all-time high. Repeatedly noted - "No resistance remains due to overhead supply, but it is extended from a sound base pattern. Its 50 DMA line defines chart support to watch."
>>> The latest Featured Stock Update with an annotated graph appeared on 3/2/2011. Click here.
View all notes |
Alert me of new notes |
CANSLIM.net Company Profile |
SEC |
Zacks Reports |
StockTalk |
News |
Chart |
Request a new note
C
A N
S L
I M
|
Symbol/Exchange
Company Name
Industry Group |
PRICE |
CHANGE
(%Change) |
Day High |
Volume
(% DAV)
(% 50 day avg vol) |
52 Wk Hi
% From Hi |
Featured
Date |
Price
Featured |
Pivot Featured |
|
Max Buy |
PCLN
-
NASDAQ
Priceline.Com Inc
INTERNET - Internet Software and Services
|
$483.99
|
-3.01
-0.62% |
$491.36
|
771,326
66.02% of 50 DAV
50 DAV is 1,168,300
|
$490.39
-1.31%
|
1/3/2011
|
$399.55
|
PP = $428.20
|
|
MB = $449.61
|
Most Recent Note - 3/25/2011 11:20:55 PM
G - Rose to a new 52-week high with a third consecutive gain on average volume, getting extended from any sound base pattern. Its 50 DMA line has defined support.
>>> The latest Featured Stock Update with an annotated graph appeared on 3/21/2011. Click here.
View all notes |
Alert me of new notes |
CANSLIM.net Company Profile |
SEC |
Zacks Reports |
StockTalk |
News |
Chart |
Request a new note
C
A N
S L
I M
|
RAX
-
NYSE
Rackspace Hosting Inc
INTERNET - Internet Software and; Services
|
$38.80
|
+0.26
0.67% |
$39.30
|
1,130,988
63.50% of 50 DAV
50 DAV is 1,781,200
|
$40.62
-4.48%
|
3/16/2011
|
$36.28
|
PP = $40.72
|
|
MB = $42.76
|
Most Recent Note - 3/25/2011 10:41:57 AM
Y - Approaching its 52-week high and pivot point on the right side of an orderly 7-week flat base after finding support at its 50 DMA line. This high-ranked leader has strong fundamental and technical characteristics, and a breakout with volume may trigger a buy signal, however the M criteria is still an overriding concern.
>>> The latest Featured Stock Update with an annotated graph appeared on 3/16/2011. Click here.
View all notes |
Alert me of new notes |
CANSLIM.net Company Profile |
SEC |
Zacks Reports |
StockTalk |
News |
Chart |
Request a new note
C
A N
S L
I M
|
TIBX
-
NASDAQ
Tibco Software Inc
COMPUTER SOFTWARE and SERVICES - Business Software and Services
|
$26.13
|
-0.21
-0.80% |
$26.63
|
3,215,063
133.18% of 50 DAV
50 DAV is 2,414,000
|
$26.77
-2.39%
|
3/18/2011
|
$23.88
|
PP = $26.04
|
|
MB = $27.34
|
Most Recent Note - 3/28/2011 3:42:01 PM
Y - Holding its ground near its 52-week high, clear of all resistance, however volume as it rallied above its pivot point last week did not meet the minimum guideline to trigger a proper technical buy signal. The M criteria also remains an overriding concern for disciplined investors until the rally attempt is confirmed with a follow-through day from at least one of the major averages.
>>> The latest Featured Stock Update with an annotated graph appeared on 3/18/2011. Click here.
View all notes |
Alert me of new notes |
CANSLIM.net Company Profile |
SEC |
Zacks Reports |
StockTalk |
News |
Chart |
Request a new note
C
A N
S L
I M
|
UA
-
NYSE
Under Armour Inc Cl A
CONSUMER NON-DURABLES - Textile - Apparel Clothing
|
$65.11
|
-0.68
-1.03% |
$66.69
|
498,071
62.31% of 50 DAV
50 DAV is 799,400
|
$70.69
-7.89%
|
1/27/2011
|
$58.31
|
PP = $56.99
|
|
MB = $59.84
|
Most Recent Note - 3/25/2011 11:20:49 AM
G - Quietly holding its ground this week above its 50 DMA line and recent lows defining important chart support. It may be forming a base-on-base pattern, but more damaging losses would hurt its outlook.
>>> The latest Featured Stock Update with an annotated graph appeared on 3/7/2011. Click here.
View all notes |
Alert me of new notes |
CANSLIM.net Company Profile |
SEC |
Zacks Reports |
StockTalk |
News |
Chart |
Request a new note
C
A N
S L
I M
|
ULTA
-
NASDAQ
Ulta Salon Cosm & Frag
SPECIALTY RETAIL - Specialty Retail, Other
|
$47.94
|
+0.29
0.61% |
$48.67
|
325,805
52.59% of 50 DAV
50 DAV is 619,500
|
$48.45
-1.05%
|
1/6/2011
|
$36.12
|
PP = $37.34
|
|
MB = $39.21
|
Most Recent Note - 3/25/2011 11:22:23 AM
G - Quietly touched a new all-time high today. Stubbornly holding its ground after a spurt of volume-driven gains. Support to watch is at its 50 DMA line and recent chart lows near the $40 level.
>>> The latest Featured Stock Update with an annotated graph appeared on 2/17/2011. Click here.
View all notes |
Alert me of new notes |
CANSLIM.net Company Profile |
SEC |
Zacks Reports |
StockTalk |
News |
Chart |
Request a new note
C
A N
S L
I M
|
Symbol/Exchange
Company Name
Industry Group |
PRICE |
CHANGE
(%Change) |
Day High |
Volume
(% DAV)
(% 50 day avg vol) |
52 Wk Hi
% From Hi |
Featured
Date |
Price
Featured |
Pivot Featured |
|
Max Buy |