You are not logged in.
This means you
CAN ONLY VIEW reports that were published prior to Monday, April 7, 2025.
You
MUST UPGRADE YOUR MEMBERSHIP if you want to see any current reports.
AFTER MARKET UPDATE - FRIDAY, JANUARY 17TH, 2025
Previous After Market Report Next After Market Report >>>
|
|
|
|
DOW |
+334.70 |
43,487.83 |
+0.78% |
|
Volume |
1,170,450,734 |
+28% |
|
Volume |
8,284,566,900 |
+14% |
|
NASDAQ |
+291.91 |
19,630.20 |
+1.51% |
|
Advancers |
1,660 |
62% |
|
Advancers |
2,692 |
63% |
|
S&P 500 |
+59.32 |
5,996.66 |
+1.00% |
|
Decliners |
1,026 |
38% |
|
Decliners |
1,602 |
37% |
|
Russell 2000 |
+9.09 |
2,275.88 |
+0.40% |
|
52 Wk Highs |
97 |
|
|
52 Wk Highs |
101 |
|
|
S&P 600 |
+7.58 |
1,441.99 |
+0.53% |
|
52 Wk Lows |
10 |
|
|
52 Wk Lows |
77 |
|
|
 |
Greater Conviction as Major Indices Posted Solid Gains
Kenneth J. Gruneisen - Passed the CAN SLIM® Master's Exam
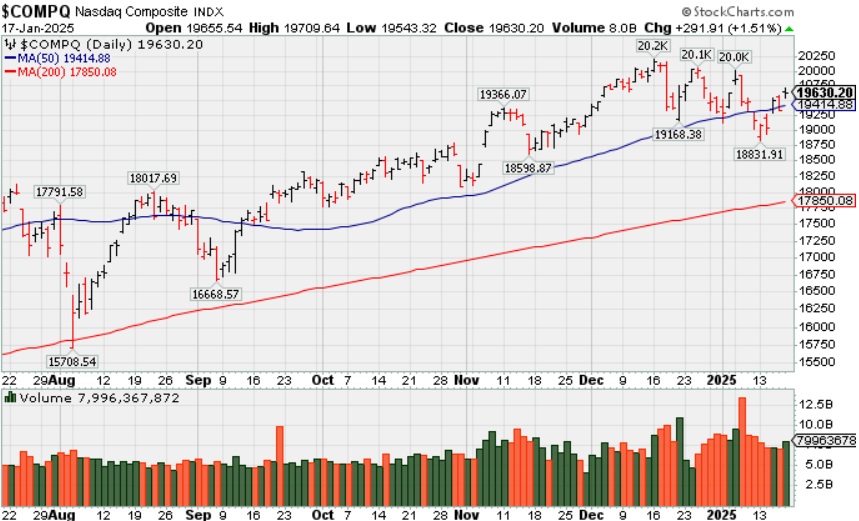
U.S. markets will be closed Monday for Martin Luther King, Jr. Day. Friday's session saw solid gains for the major indices and S&P 500 closed above its 50-day moving average (5,966). Volume totals reported were higher than the prior session totals on the NYSE and on the Nasdaq exchange, action indicative of greater institutional buying demand. Breadth was positive as advancers led decliners by an 8-5 margin at the NYSE and by 5-3 on the Nasdaq exchange. There were 47 high-ranked companies from the Leaders List that hit new 52-week highs and were listed on the BreakOuts Page, versus 41 on the prior session. New 52-week highs totals expanded and outnumbered shrinking new 52-week lows on the NYSE and on the Nasdaq exchange. The major indices appear to have shaken off the recent pressure (M criteria) as leadership improved throughout the week, avoiding a more worrisome correction. Disciplined investors know to only buy stocks meeting all key criteria as they emerge from properly formed bases.
PICTURED: The Nasdaq Composite Index posted a gain with higher volume on Friay while making more progress above its 50-day moving average (DMA) line.
Growth optimism and speculation lifted US equities markets ahead of Monday's inauguration of Donald J. Trump as the 47th President of the United States of America.
Tesla (TSLA +3.1%) added to the influence of other mega-cap stocks as the consumer discretionary (+1.7%), information technology (+1.7%), and communication services (+1.1%) sectors outperformed the market. Nine of the 11 S&P 500 sectors were higher with the exceptions, real estate (-0.04%) and health care (-0.7%). Drug stocks faced pressure as the Department of Health and Human Services announced 15 additional drugs for Medicare's price negotiations, including Novo Nordisk's (NVO -5.3%) Ozempic and Wegovy.
Total housing starts increased 15.8% month-over-month in December to a seasonally adjusted annual rate of 1.499 million units. Total building permits were down 0.7% month-over-month to a seasonally adjusted annual rate of 1.483 million. Total industrial production increased 0.9% month-over-month in December following an upwardly revised 0.2% increase (from -0.1%) in November. The capacity utilization rate jumped to 77.6% from an upwardly revised 77.0% (from 76.8%) in November. Total industrial production increased 0.5% yr/yr while the capacity utilization rate was 2.1 percentage points below its long-run average.
|
 Kenneth J. Gruneisen started out as a licensed stockbroker in August 1987, a couple of months prior to the historic stock market crash that took the Dow Jones Industrial Average down -22.6% in a single day. He has published daily fact-based fundamental and technical analysis on high-ranked stocks online for two decades. Through FACTBASEDINVESTING.COM, Kenneth provides educational articles, news, market commentary, and other information regarding proven investment systems that work in good times and bad.
Comments contained in the body of this report are technical opinions only and are not necessarily those of Gruneisen Growth Corp. The material herein has been obtained from sources believed to be reliable and accurate, however, its accuracy and completeness cannot be guaranteed. Our firm, employees, and customers may effect transactions, including transactions contrary to any recommendation herein, or have positions in the securities mentioned herein or options with respect thereto. Any recommendation contained in this report may not be suitable for all investors and it is not to be deemed an offer or solicitation on our part with respect to the purchase or sale of any securities. |
|
 |
Financial, Retail, Commodity, and Most Tech Indexes Rose
Kenneth J. Gruneisen - Passed the CAN SLIM® Master's Exam
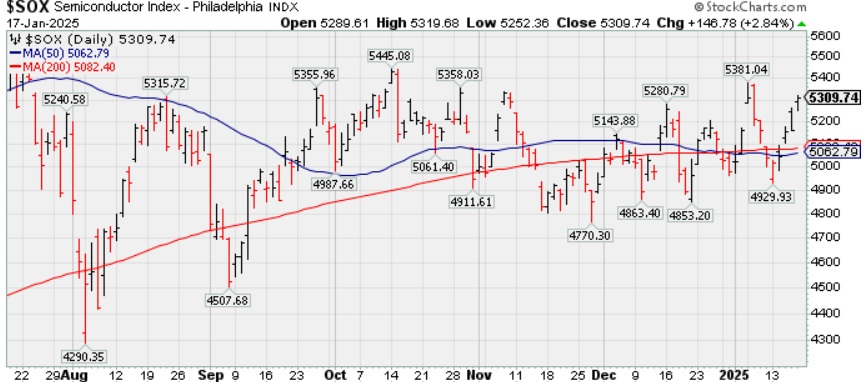
The Broker/Dealer Index ($XBD +1.27%), Bank Index ($BKX +1.28%), and the Retail Index ($RLX +1.71%) each posted solid gains on Friday. The tech sector had a positive bias as the Semiconductor Index ($SOX +2.84%) outpaced the Networking Index ($NWX +0.84%), but the Biotech Index ($BTK -0.56%) suffered a small loss. The Gold & Silver Index ($XAU +0.706%), Oil Services Index ($OSX +2.09%), and the Integrated Oil Index ($XOI +0.54%) rounded out the mostly positive session with gains.
PICTURED: The Semiconductor Index ($SOX +2.84%) posted a 4th consecutive solid gain, rebounding further above its 50-day moving average (DMA) line toward prior highs.
| Oil Services |
$OSX |
78.57 |
+1.61 |
+2.09% |
+8.22% |
| Integrated Oil |
$XOI |
1,930.22 |
+10.31 |
+0.54% |
+9.45% |
| Semiconductor |
$SOX |
5,309.74 |
+146.78 |
+2.84% |
+6.62% |
| Networking |
$NWX |
1,295.88 |
+10.73 |
+0.84% |
+3.79% |
| Broker/Dealer |
$XBD |
861.25 |
+10.84 |
+1.27% |
+6.94% |
| Retail Index |
$RLX |
5,302.48 |
+89.13 |
+1.71% |
+2.47% |
| Gold & Silver |
$XAU |
147.04 |
+1.02 |
+0.70% |
+7.19% |
| Bank |
$BKX |
136.28 |
+1.72 |
+1.28% |
+6.91% |
| Biotech |
$BTK |
5,987.30 |
-33.94 |
-0.56% |
+4.21% |
|
|
|
 |
Featured Stocks
Kenneth J. Gruneisen - Passed the CAN SLIM® Master's Exam
Symbol/Exchange
Company Name
Industry Group | PRICE | CHANGE
(%Change) | Day High | Volume
(% DAV)
(% 50 day avg vol) | 52 Wk Hi
% From Hi | Featured
Date | Price
Featured | Pivot Featured | | Max Buy |  GVA - NYSE GVA - NYSE
Granite Construction
Bldg-Heavy Construction | $92.37 | +0.16
0.17% | $93.54 | 802,849
135.62% of 50 DAV
50 DAV is 592,000 | $105.20
-12.20%
| 6/11/2024 | $59.76 | PP = $64.33 | | MB = $67.55 | Most Recent Note - 1/15/2025 8:49:28 PM
G - Posted a 3rd consecutive gain today rising near its 50 DMA line ($93.80). A rebound above that short-term average is needed for its outlook to improve. Sputtering after a noted "negative reversal" at its all-time high. Reported Sep ''24 quarterly earnings +19% on +14% sales revenues versus the year-ago period, repeatedly noted as "below the +25% minimum guideline (C criteria) of the fact-based investment system."
>>> FEATURED STOCK ARTICLE : Negative Reversal After Hitting New All-Time High - 12/6/2024 | View all notes | Set NEW NOTE alert | Company Profile | SEC News | Chart | Request a new note C A S I | TXRH - NASDAQ
Texas Roadhouse
Retail-Restaurants | $178.95 | +0.63
0.35% | $181.56 | 826,396
120.29% of 50 DAV
50 DAV is 687,000 | $206.04
-13.15%
| 7/26/2024 | $173.08 | PP = $175.82 | | MB = $184.61 |  Most Recent Note - 1/17/2025 10:14:07 AM Most Recent Note - 1/17/2025 10:14:07 AM
G - Recently finding support at its 200 DMA line ($173) but lingering below its 50 DMA line ($190) in recent weeks. A rebound above the 50 DMA line is still needed for its outlook to improve.
>>> FEATURED STOCK ARTICLE : Hovering Near High After Recent Volume-driven Gains - 11/15/2024 | View all notes | Set NEW NOTE alert | Company Profile | SEC News | Chart | Request a new note C A S I | HWM - NYSE
Howmet Aerospace
Aerospace/Defense | $125.30 | +2.32
1.89% | $126.26 | 3,921,408
163.05% of 50 DAV
50 DAV is 2,405,000 | $124.15
0.93%
| 1/8/2025 | $115.05 | PP = $120.81 | | MB = $126.85 | Most Recent Note - 1/15/2025 12:28:57 PM
Y - Gapped up today for a 2nd consecutive session, hitting a new all-time high. Noted twice since new pivot point noted on 1/08/25 - "Subsequent volume-driven gains above the pivot point may trigger a new (or add-on) technical buy signal. Found support recently above the prior high ($106.93 on 10/21/24). Fundamentals remain strong."
>>> FEATURED STOCK ARTICLE : Extended From Prior Base and Perched at High - 12/5/2024 | View all notes | Set NEW NOTE alert | Company Profile | SEC News | Chart | Request a new note C A S I | NGVC - NYSE
Natural Grocers
Retail-Super/Mini Mkts | $40.33 | +0.37
0.93% | $40.46 | 75,645
64.11% of 50 DAV
50 DAV is 118,000 | $47.57
-15.22%
| 11/5/2024 | $30.57 | PP = $30.42 | | MB = $31.94 | Most Recent Note - 1/15/2025 8:43:06 PM
G - Posted a 3rd consecutive gain today after halting its slide at its 50 DMA line ($39.16). More damaging losses would raise serious concerns and trigger a worrisome technical sell signal. Reported Sep ''24 quarterly earnings +50% on +9% sales revenues versus the year-ago period.
>>> FEATURED STOCK ARTICLE : Consolidating After Considerable Rally to New Highs - 12/16/2024 | View all notes | Set NEW NOTE alert | Company Profile | SEC News | Chart | Request a new note C A S I | CLS - NYSE
Celestica
Elec-Contract Mfg | $113.28 | +2.56
2.31% | $114.19 | 2,650,285
119.22% of 50 DAV
50 DAV is 2,223,000 | $115.52
-1.94%
| 10/11/2024 | $57.62 | PP = $63.59 | | MB = $66.77 | Most Recent Note - 1/16/2025 12:26:44 PM
G - Extended from any sound base and hitting a new all-time high with today's big gap up gain adding to a recent spurt higher. Its 50 DMA line ($91.43) defines initial support to watch on pullbacks.
>>> FEATURED STOCK ARTICLE : Pulling Back After Considerable Rally - 11/13/2024 | View all notes | Set NEW NOTE alert | Company Profile | SEC News | Chart | Request a new note C A S I | Symbol/Exchange
Company Name
Industry Group | PRICE | CHANGE
(%Change) | Day High | Volume
(% DAV)
(% 50 day avg vol) | 52 Wk Hi
% From Hi | Featured
Date | Price
Featured | Pivot Featured | | Max Buy | PAY - NYSE
Paymentus Holdings
Finance-CrdtCard/PmtPr | $30.14 | -0.10
-0.33% | $30.75 | 423,608
80.38% of 50 DAV
50 DAV is 527,000 | $38.94
-22.60%
| 1/3/2025 | $34.21 | PP = $38.94 | | MB = $40.89 | Most Recent Note - 1/15/2025 8:44:33 PM
G - Still lingering below its 50 DMA line ($33) after noted losses backed by above average volume. A prompt rebound above the 50 DMA line is needed for its outlook to improve.
>>> FEATURED STOCK ARTICLE : Losses Below 50-Day Moving Average Hurt Outlook - 1/8/2025 | View all notes | Set NEW NOTE alert | Company Profile | SEC News | Chart | Request a new note C A S I | RMD - NYSE
ResMed
Medical-Products | $239.78 | +2.65
1.12% | $240.37 | 776,858
97.60% of 50 DAV
50 DAV is 796,000 | $260.49
-7.95%
| 10/25/2024 | $256.64 | PP = $255.28 | | MB = $268.04 | Most Recent Note - 1/15/2025 8:46:46 PM
G - Posted a gain today with above average volume. A rebound above its 50 DMA line ($239.66) is still needed for its outlook to improve. Its Relative Strength Rating is 80, at the 80+ minimum guideline for buy candidates. Recent lows and its 200 DMA line define important near-term support in the $223-224 area.
>>> FEATURED STOCK ARTICLE : Recent Slump Below 50-Day Moving Average Raised Concerns - 11/18/2024 | View all notes | Set NEW NOTE alert | Company Profile | SEC News | Chart | Request a new note C A S I | ATGE - NYSE
Adtalem Global Education
Consumer Svcs-Education | $98.17 | +0.83
0.85% | $99.17 | 225,066
56.69% of 50 DAV
50 DAV is 397,000 | $98.64
-0.48%
| 12/31/2024 | $91.50 | PP = $93.03 | | MB = $97.68 | Most Recent Note - 1/17/2025 10:06:48 AM
G - After a noted "positive reversal" today''s 4th consecutive gain has it wedging to new all-time highs above its "max buy" level and its color code is changed to green. New pivot point was cited based on its 11/06/24 high plus 10 cents. It did not produce gains above its pivot point with heavy enough volume to trigger a proper new (or add-on) technical buy signal. Its 50 DMA line ($90.34) defines initial support above the prior low ($84.79 on 12/18/24). Fundamentals remain strong.
>>> FEATURED STOCK ARTICLE : Hovering Near High With Volume Totals Cooling - 12/4/2024 | View all notes | Set NEW NOTE alert | Company Profile | SEC News | Chart | Request a new note C A S I | TW - NASDAQ
Tradeweb Markets
Financial Svcs-Specialty | $129.02 | -2.14
-1.63% | $132.00 | 780,942
92.31% of 50 DAV
50 DAV is 846,000 | $141.69
-8.94%
| 11/19/2024 | $134.41 | PP = $136.23 | | MB = $143.04 | Most Recent Note - 1/15/2025 12:45:56 PM
G - Slumping further below its 50 DMA line ($132) with today's big loss approaching prior lows in the $125 area which define the next very important support level to watch. More damaging losses would raise serious concerns. A rebound above the 50 DMA line is needed for its outlook to improve and it must produce a volume-driven gain above the pivot point to trigger a proper technical buy signal. It was highlighted in yellow with pivot point cited based on its 10/15/24 high plus 10 cents.
>>> FEATURED STOCK ARTICLE : Tradeweb Markets Perched Near High - 11/19/2024 | View all notes | Set NEW NOTE alert | Company Profile | SEC News | Chart | Request a new note C A S I | ATAT - NASDAQ
Atour Lifestyle Hldgs ADR
Leisure-Lodging | $25.85 | +0.52
2.05% | $26.39 | 685,579
54.45% of 50 DAV
50 DAV is 1,259,000 | $29.90
-13.55%
| 12/9/2024 | $29.34 | PP = $29.25 | | MB = $30.71 | Most Recent Note - 1/17/2025 10:02:56 AM
G - Still lingering below its 50 DMA line ($26.53) which may act as resistance. A rebound above the 50 DMA line is needed for its outlook to improve.
>>> FEATURED STOCK ARTICLE : Volume Above Average Behind Breakout Gain - 12/9/2024 | View all notes | Set NEW NOTE alert | Company Profile | SEC News | Chart | Request a new note C A S I | Symbol/Exchange
Company Name
Industry Group | PRICE | CHANGE
(%Change) | Day High | Volume
(% DAV)
(% 50 day avg vol) | 52 Wk Hi
% From Hi | Featured
Date | Price
Featured | Pivot Featured | | Max Buy | CRAI - NASDAQ
CRA International
Comml Svcs-Consulting | $182.75 | -0.17
-0.09% | $185.00 | 31,364
89.61% of 50 DAV
50 DAV is 35,000 | $210.70
-13.27%
| 12/17/2024 | $208.34 | PP = $208.48 | | MB = $218.90 | Most Recent Note - 1/15/2025 8:48:02 PM
G - Still lingering below its 50 DMA line. A rebound above the 50 DMA line ($190) is needed for its outlook to improve. Its 200 DMA line ($173) defines important near-term support. Fundamentals remain strong.
>>> FEATURED STOCK ARTICLE : Volume-Driven Gain for New High Triggered Technical Buy Signal - 12/17/2024 | View all notes | Set NEW NOTE alert | Company Profile | SEC News | Chart | Request a new note C A S I | LRN - NYSE
Stride
Consumer Svcs-Education | $114.16 | +1.21
1.07% | $115.02 | 866,502
122.39% of 50 DAV
50 DAV is 708,000 | $115.42
-1.09%
| 1/10/2025 | $114.31 | PP = $112.90 | | MB = $118.55 | Most Recent Note - 1/16/2025 12:47:58 PM
Y - Rising above the pivot point cited based on its 12/04/24 high and hitting a new all-time high with today's early gain. Recently consolidated in an orderly fashion above its 50 DMA line ($105). the 1/10/25 mid-day report noted - "A gain and strong close above the pivot point backed by at least +40% above average volume may clinch a technical buy signal. Reported Sep '24 quarterly earnings +755% on +15% sales revenues versus the year ago period. Three of the 4 latest quarterly comparisons were well above the +25% minimum earnings guideline (C criteria). Annual earnings (A criteria) history has been strong after a downturn in FY '20."
>>> FEATURED STOCK ARTICLE : Encountered Distributional Pressure Amid Broader Weakness - 1/10/2025 | View all notes | Set NEW NOTE alert | Company Profile | SEC News | Chart | Request a new note C A S I |
|
|
|
Color Codes Explained :
Y - Better candidates highlighted by our
staff of experts.
G - Previously featured
in past reports as yellow but may no longer be buyable under the
guidelines.
***Last / Change / Volume data in this table is the closing quote data***
|
|
|
THESE ARE NOT BUY RECOMMENDATIONS!
Comments contained in the body of this report are technical
opinions only. The material herein has been obtained
from sources believed to be reliable and accurate, however,
its accuracy and completeness cannot be guaranteed.
This site is not an investment advisor, hence it does
not endorse or recommend any securities or other investments.
Any recommendation contained in this report may not
be suitable for all investors and it is not to be deemed
an offer or solicitation on our part with respect to
the purchase or sale of any securities. All trademarks,
service marks and trade names appearing in this report
are the property of their respective owners, and are
likewise used for identification purposes only.
This report is a service available
only to active Paid Premium Members.
You may opt-out of receiving report notifications
at any time. Questions or comments may be submitted
by writing to Premium Membership Services 665 S.E. 10 Street, Suite 201 Deerfield Beach, FL 33441-5634 or by calling 1-800-965-8307
or 954-785-1121.
|
|
|