7/19/2021 1:13:45 PM - Pulling back from its all-time high toward its 50 DMA line ($131). Showed mostly bullish action since last noted in the 5/21/21 mid-day report - "Reported earnings +56% on +20% sales revenues for the Mar '21 quarter versus the year ago period, its 2nd strong comparison. Prior quarterly comparisons showed earnings increases below the +25% minimum guidelines (C criteria)."
5/21/2021 12:58:56 PM - Found prompt support near its 50 DMA line ($121) and it is perched near its all-time high. Reported earnings +56% on +20% sales revenues for the Mar '21 quarter versus the year ago period, its 2nd strong comparison. Prior quarterly comparisons showed earnings increases below the +25% minimum guidelines (C criteria).
4/21/2021 12:42:24 PM - Extended from any sound base and abruptly retreating from its all-time high with today's big volume-driven loss. The 4/20/21 mid-day report cautioned members - "Reported earnings +31% on +16% sales revenues for the Dec '20 quarter versus the year ago period. Prior quarterly comparisons showed earnings increases below the +25% minimum guidelines (C criteria)."
4/20/2021 12:51:59 PM - Extended from any sound base and hitting a new all-time high with today's big volume-driven gain. Reported earnings +31% on +16% sales revenues for the Dec '20 quarter versus the year ago period. Prior quarterly comparisons showed earnings increases below the +25% minimum guidelines (C criteria).
11/13/2019 12:32:00 PM - Gapped down on the prior session, retreating from new all-time highs after 6 consecutive gains. The prior mid-day report cautioned members - "Reported earnings +11% on +18% sales revenues for the Sep '19 quarter. Prior quarterly comparisons also showed earnings increases below the +25% minimum guidelines (C criteria)."
11/12/2019 12:39:49 PM - Gapped down today retreating from new all-time highs after 6 consecutive gain. Reported earnings +11% on +18% sales revenues for the Sep '19 quarter. Prior quarterly comparisons also showed earnings increases below the +25% minimum guidelines (C criteria).
10/11/2019 12:53:05 PM - No resistance remains while hitting new all-time highs with today's 3rd consecutive gain. Reported earnings +7% on +12% sales revenues for the Jun '19 quarter. Prior quarterly comparisons also showed earnings increases below the +25% minimum guidelines (C criteria).
5/15/2019 1:09:55 PM - Slumped below its 50 DMA line this week with volume-driven losses after recently challenging its all-time high. Reported earnings +15% on +7% sales revenues for the Mar '19 quarter. Prior quarterly comparisons also showed earnings increases below the +25% minimum guidelines (C criteria).
5/9/2017 12:57:17 PM - Consolidating near its 52 week and all-time highs . Reported earnings +13% on +27% sales revenues for the Mar '17 quarter. Prior quarterly comparisons also showed earnings increases below the +25% minimum guidelines (C criteria).
3/31/2017 12:52:47 PM - Consolidating near its 50 DMA line. The 3/10/17 mid-day report cautioned members - "Reported earnings +16% on +23% sales revenues for the Dec '16 quarter. Prior quarterly comparisons showed earnings increases below the +25% minimum guidelines (C criteria)."
3/10/2017 12:25:01 PM - Reported earnings +18% on +23% sales revenues for the Dec '16 quarter. Prior quarterly comparisons showed earnings increases below the +25% minimum guidelines (C criteria).
1/20/2017 12:12:56 PM - The 1/17/17 mid-day report noted - "Wedged to new 52-week and all-time highs with recent gains lacking great volume conviction. Reported earnings +20% on +18% sales revenues for the Sep '16 quarter. Prior quarterly comparisons showed earnings increases below the +25% minimum guidelines (C criteria)."
1/17/2017 12:51:19 PM - Wedged to new 52-week and all-time highs with recent gains lacking great volume conviction. Reported earnings +20% on +18% sales revenues for the Sep '16 quarter. Prior quarterly comparisons showed earnings increases below the +25% minimum guidelines (C criteria)."
12/11/2015 12:28:29 PM - The 12/10/15 mid-day report cautioned - "Recently enduring distributional pressure while perched near 52-week and all-time highs. Reported earnings +25% on +17% sales revenues for the Sep '15 quarter. Prior quarterly comparisons showed earnings increases below the +25% minimum guidelines (C criteria)."
12/10/2015 12:45:36 PM - Recently enduring distributional pressure while perched near 52-week and all-time highs. Reported earnings +25% on +17% sales revenues for the Sep '15 quarter. Prior quarterly comparisons showed earnings increases below the +25% minimum guidelines (C criteria).
10/19/2015 12:42:03 PM - Sputtering after undercutting prior highs following an impressive streak of gains into new high territory. Found support at its 200 DMA line during its consolidation since noted with caution in the 8/10/15 mid-day report - "Reported earnings +18% on +22% sales revenues for the Jun '15 quarter, and prior quarterly comparisons showed earnings increases below the +25% minimum guidelines (C criteria)."
10/15/2015 12:44:23 PM - Third consecutive loss today, pulling back from its 52-week high and undercutting prior highs following an impresssice streak of gains into new high territory. Found support at its 200 DMA line during its consolidation since noted with caution in the 8/10/15 mid-day report - "Reported earnings +18% on +22% sales revenues for the Jun '15 quarter, and prior quarterly comparisons showed earnings increases below the +25% minimum guidelines (C criteria)."
10/14/2015 1:07:36 PM - Pulling back from its 52-week high following an impressive streak of gains into new high territory. Found support at its 200 DMA line during its consolidation since noted with caution in the 8/10/15 mid-day report - "Reported earnings +18% on +22% sales revenues for the Jun '15 quarter, and prior quarterly comparisons showed earnings increases below the +25% minimum guidelines (C criteria)."
9/3/2015 12:29:28 PM - Found support at its 200 DMA line during its consolidation since last noted with caution in the 8/10/15 mid-day report - "Reported earnings +18% on +22% sales revenues for the Jun '15 quarter, and prior quarterly comparisons showed earnings increases below the +25% minimum guidelines (C criteria)."
8/10/2015 9:41:07 PM - Gapped up today hitting another new 52-week high. The 8/05/15 mid-day report cautioned members - "Reported earnings +18% on +22% sales revenues for the Jun '15 quarter, and prior quarterly comparisons showed earnings increases below the +25% minimum guidelines (C criteria)."
8/5/2015 12:47:26 PM - Gapped up today hitting a new 52-week high. Reported earnings +18% on +22% sales revenues for the Jun '15 quarter, and prior quarterly comparisons showed earnings increases below the +25% minimum guidelines (C criteria).
6/3/2015 12:54:21 PM - Still sputtering below its 50 DMA line since last noted with caution in the 5/26/15 mid-day report - "Reported earnings +12% on +20% sales revenues for the Mar '15 quarter and prior quarterly comparisons showed earnings increases below the +25% minimum guidelines (C criteria)."
5/26/2015 12:24:10 PM - Reported earnings +12% on +20% sales revenues for the Mar '15 quarter and prior quarterly comparisons showed earnings increases below the +25% minimum guidelines (C criteria).
8/14/2014 12:40:50 PM - Reported earnings +11% on +2% sales revenues for the Jun '14 quarter and prior quarterly comparisons showed earnings increases below the +25% minimum guidelines (C criteria).
11/6/2013 12:43:04 PM - Violating its 50 DMA line with today's volume-driven loss while also slumping back into the previously noted base. Reported earnings -2% on +37% sales revenues for the Sep '13 quarter. The past 8 quarterly comparisons through Sep '13 showed earnings increases below the +25% minimum guidelines (C criteria).
10/8/2013 12:11:38 PM - Found support near its 50 DMA line while building a 9-week flat base. The past 7 quarterly comparisons through Jun '13 showed earnings increases below the +25% minimum guidelines (C criteria).
8/12/2013 12:35:57 PM - Hitting a new 52-week high with above average volume behind today's 3rd consecutive gain, extended from any sound base. The past 7 quarterly comparisons through Jun '13 showed earnings increases below the +25% minimum guidelines (C criteria).
2/19/2013 12:39:44 PM - Holding its ground near its 52-week high since 2/14/13 after a consider breakaway gap. The 2/15/13 mid-day report cautioned - "The past 5 quarterly comparisons through Dec '12 showed earnings increases below the +25% minimum guidelines (C criteria). It survived but failed to impress since last noted on 9/28/11 when it suffered a damaging loss violating its 200 DMA line and it was dropped from the Featured Stocks list."
2/15/2013 12:25:44 PM - Gapped up today following a consider breakaway gap on the prior session. The past 5 quarterly comparisons through Dec '12 showed earnings increases below the +25% minimum guidelines (C criteria). It survived but failed to impress since last noted on 9/28/11 when it suffered a damaging loss violating its 200 DMA line and it was dropped from the Featured Stocks list.
9/28/2011 6:51:47 PM - Suffered a damaging loss today and violated its 200 DMA line. Based on weak action it will be dropped from the Featured Stocks list tonight.
9/27/2011 8:22:48 PM - G - Suffered another small loss today with above average volume indicating distributional pressure. Testing support near its closely coinciding 50 and 200 DMA lines.
9/23/2011 6:48:23 PM - G - Suffered a 6th consecutive damaging loss today. Testing support near its closely coinciding 50 and 200 DMA lines. See latest FSU analysis for more details and a new annotated graph.
9/22/2011 4:13:50 PM - G - Slumping below previous highs in the $30-31 area and testing its closely coinciding 50 and 200 DMA lines, raising concerns. Closed near the session high today but with above average volume behind its 5th consecutive loss since touching a new 52-week high.
9/20/2011 4:35:36 PM - G - Closed near the session low today with light volume behind its 3rd consecutive loss since touching a new 52-week high. Previous highs in the $30-31 area define initial chart support to watch above its closely coinciding 50 and 200 DMA lines.
9/19/2011 3:05:00 PM - G - Quietly pulling back today after touching a new 52-week high on the prior session. No resistance remains due to overhead supply. Previous highs in the $30-31 area define initial chart support to watch above its closely coinciding 50 and 200 DMA lines.
9/16/2011 1:12:53 PM - G - Hovering near its 52-week high today with no resistance remaining due to overhead supply. Previous highs in the $30-31 area define initial chart support to watch above its closely coinciding 50 and 200 DMA lines.
9/13/2011 7:33:44 PM - G - Gain today came with better above average volume, finishing -4% off its 52-week high. Previous highs in the $30-31 area define initial chart support to watch.
9/12/2011 5:06:05 PM - G - Gain today with lighter but above average volume, finishing -6% off its 52-week high. Previous highs in the $30-31 area define initial chart support to watch.
9/9/2011 12:27:01 PM - G - Gapped down today, now slumping -7.4% off its 52-week high. Previous highs in the $30-31 area define initial chart support to watch.
9/9/2011 10:34:57 AM - G - Up from earlier lows after a gap down today, now perched -4.9% off its 52-week high. Previous highs in the $30-31 area define initial chart support to watch.
9/7/2011 4:20:02 PM - G - Solid gain today broke a streak of 4 consecutive losses since reaching a new 52-week high on 8/30/11. Previous highs in the $30-31 area now define initial chart support on pullbacks.
9/6/2011 4:14:31 PM - G - After slumping under its "max buy" level it closed near the session high today but suffered its 4th consecutive loss with above average volume since reaching a new 52-week high on 8/30/11. Previous highs in the $30-31 area now define initial chart support on pullbacks.
9/2/2011 7:32:51 PM - G - Pulled back today for its 3rd consecutive loss after reaching a new 52-week high this week with a solid volume-driven gain on 8/30/11 indicative of institutional accumulation. Previous highs in the $30-31 area now define initial chart support on pullbacks.
8/31/2011 12:48:08 PM - G - Holding its ground today near its 52-week high after a solid volume-driven gain to new highs on the prior session indicative of institutional accumulation. Previous highs in the $30-31 area now define initial chart support on pullbacks.
8/30/2011 1:11:26 PM - G - Color code was changed to green again after quickly rallying well above its "max buy" level and hitting a new 52-week high with today's volume-driven gain. Prior highs in the $30-31 area which were a resistance level now define initial chart support on pullbacks.
8/30/2011 10:50:13 AM - G - Color code is changed to green again after quickly rallying well above its "max buy" level and hitting a new 52-week high today. A considerable confirming gain with +43% above average volume on 8/29/11 helped it rebound above its previously cited pivot point. No resistance remains due to overhead supply. See the latest FSU analysis for more details and a new annotated graph.
8/29/2011 6:41:12 PM - Y - Color code is changed to yellow after a considerable confirming gain above its previously cited pivot point today with +43% above average volume, rallying for its best close of the year. Very little resistance remains due to overhead supply. See the latest FSU analysis for more details and a new annotated graph.
8/26/2011 6:39:47 PM - G - Closed near the session high today after a positive reversal. Gains this week helped it challenge its 8/03/11 high, and little resistance remains due to overhead supply.
8/25/2011 1:07:31 PM - G - Reversed into the red after opening higher today. Gains this week helped it approach its 8/03/11 high, and little resistance remains due to overhead supply.
8/24/2011 6:07:35 PM - G - Today's 3rd consecutive gain led to a close just 20 cents below its 8/03/11 close after a considerable gap up. Little resistance remains due to overhead supply.
8/23/2011 5:46:34 PM - G - Posted a considerable gain today and closed near the session high after rebounding well above its 50 and 200 DMA lines, helping its outlook. It marked its 3rd best close since its 8/03/11 gap up.
8/22/2011 5:46:00 PM - G - Posted a gain today but it is still sputtering under its 50 and 200 DMA lines following volume-driven losses. Only a prompt rebound above those important moving averages would help its outlook. It made no progress since its 8/03/11 gap up.
8/19/2011 4:17:22 PM - G - Slumped under its 50 and 200 DMA lines with volume-driven losses, making no progress since its 8/03/11 gap up. Only a prompt rebound above those important moving averages would help its outlook.
8/18/2011 3:30:34 PM - G - Gapped down today, slumping under its 50 and 200 DMA lines and again struggling amid a widely negative market (M criteria). Last week it churned a lot of volume without making progress since its 8/03/11 gap up.
8/16/2011 1:26:50 PM - G - Quietly slumping near its 50 and 200 DMA lines today, struggling amid a widely negative market (M criteria). Last week it churned a lot of volume without making progress since its 8/03/11 gap up.
8/15/2011 4:11:10 PM - G - Quietly consolidating above its 50 and 200 DMA lines. Last week it churned a lot of volume without making progress since its 8/03/11 gap up.
8/11/2011 4:19:21 PM - G - Consolidating near its 50 and 200 DMA lines, churning a lot of volume without making progress since its 8/03/11 gap up.
8/10/2011 7:41:08 PM - G - Slumped below its 50 and 200 DMA lines again today, raising concerns. Color code is changed to green.
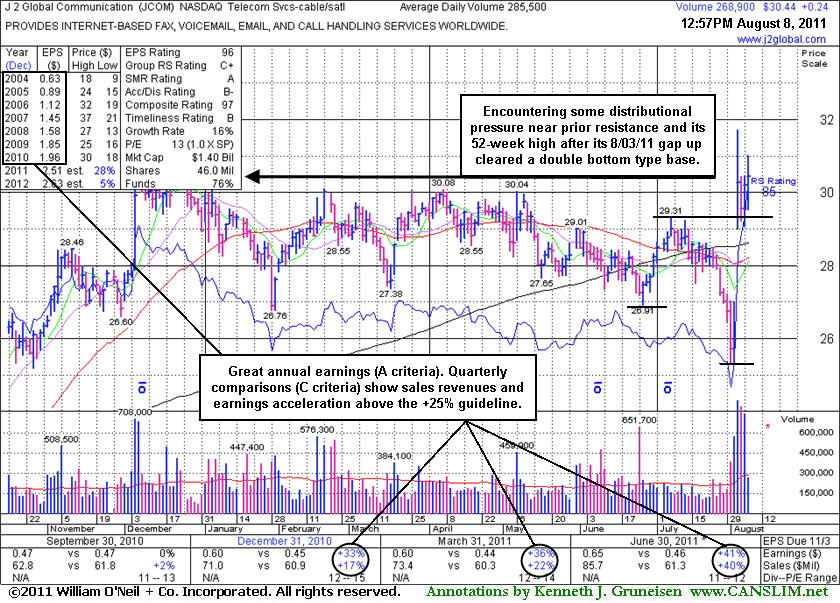
8/9/2011 4:59:48 PM - Y - Strength in the final hour today helped it rebound from a loss that took it below its 50 and 200 DMA lines and it managed to post a solid gain with more than 2 times average volume. The weakness in the market (M criteria) contributed to a negative reversal on 8/08/11 when it was featured in the mid-day report with an annotated daily graph (read here) with pivot point based on its 7/07/11 high after a double bottom type base. Technically it has been enduring distributional pressure near previously stubborn resistance in the $30 area since gapping up on 8/03/11 from below its 50 and 200 DMA lines. The 3 latest quarterly comparisons through June '11 show sales revenues and earnings acceleration and has a strong annual earnings, satisfying the C and A criteria.
8/8/2011 6:48:31 PM - Y - No overhead supply remains to act as resistance, but the negative market (M criteria) contributed to a negative reversal today. Color code was changed to yellow with pivot point based on its 7/07/11 high after a double bottom type base. Technically it has been enduring distributional pressure near previously stubborn resistance in the $30 area since gapping up on 8/03/11 from below its 50 and 200 DMA lines. The 3 latest quarterly comparisons through June '11 show sales revenues and earnings acceleration and has a strong annual earnings, satisfying the C and A criteria. See the latest FSU analysis for an annotated weekly graph after the daily graph annotated below.
8/8/2011 - Y - No overhead supply remains to act as resistance. Color code is changed to yellow with pivot point based on its 7/07/11 high after a double bottom type base. Technically it has been enduring distributional pressure near previously stubborn resistance in the $30 area since gapping up on 8/03/11 from below its 50 and 200 DMA lines. The 3 latest quarterly comparisons through June '11 show sales revenues and earnings acceleration and has a strong annual earnings, satisfying the C and A criteria.
6/20/2007 12:50:23 PM - Too extended from a sound base of support at this point to be considered buyable under the guidelines.
6/1/2007 12:43:14 PM - Too extended from a sound base of support at this point to be considered buyable under the guidelines.
5/17/2007 12:52:54 PM - Too extended from a sound base of support at this point to be considered buyable under the guidelines.
5/16/2007 12:35:44 PM - Too extended from a sound base of support at this point to be considered buyable under the guidelines.
6/27/2006 12:49:22 PM - Too extended from a sound base of support at this point to be considered buyable under the guidelines.
6/26/2006 12:49:22 PM - Base remains questionable.
6/21/2006 12:54:21 PM - Above average volume gains today to new highs yet base is questionable.
11/14/2005 12:42:43 PM - 'C' below guidelines and no base to buy from.
11/8/2005 12:55:56 PM - 'C' below guidelines and no base to buy from.
3/30/2005 12:19:22 PM - G - More losses today. (CANSLIM.net daily coverage will be suspended.)
3/29/2005 2:31:37 PM - G - Downgraded by Pacific Growth Equities to "equal weight" from "over weight," Concerns that a tax on assigned telephone numbers might be introduced, hurting the company's profitability.
3/29/2005 2:06:48 PM - G - Just quickly reversed from earlier highs and now sits near 50 DMA. Important for it to stay above. No news found at this time.
3/15/2005 6:33:21 PM - G - Ended session with a loss and near session lows yet price remains above support. Volume has been somewhat questionable in this recent advance. Continues acting ok above PP. NOTE: Watch for stocks highlighted in yellow as these are the better CANSLIM-based buy candidates. Once they become green they are considered to be too extended under the guidelines.
3/4/2005 12:35:41 PM - G - Best in just OK group. PP= $36.45 MB= $38.27. Volume has been somewhat questionable in this recent advance. Continues acting ok above PP. NOTE: Watch for stocks highlighted in yellow as these are the better CANSLIM-based buy candidates. Once they become green they are considered to be too extended under the guidelines.
3/3/2005 12:41:15 PM - G - Best in just OK group. PP= $36.45 MB= $38.27. Volume has been somewhat questionable in this recent advance. Continues acting ok above PP. NOTE: Watch for stocks highlighted in yellow as these are the better CANSLIM-based buy candidates. Once they become green they are considered to be too extended under the guidelines.
2/16/2005 12:32:53 PM - G - Best in decent group. PP= $36.45 MB= $38.27.
2/15/2005 12:27:10 PM - G - Best in decent group. PP= $36.45 MB= $38.27.
2/14/2005 12:56:03 PM - Y- Best in pretty good group. PP= $36.45 MB= $38.27
2/7/2005 12:38:14 PM - Y- Best in decent group. PP= $36.45 MB= $38.27