11/10/2017 12:16:51 PM - Testing its 50 DMA line ($46.23) again today after challenging its 52-week high with volume-driven gains this week. Due to report Sep '17 earnings news. Fundamental concerns remain. Erratic history is not a match with respect to the C and A criteria.
8/16/2017 12:04:36 PM - Pulling back from its 52-week high for a 2nd consecutive session after reporting Jun '17 earnings +9% on +52% sales revenues, below the +25% minimum earnings guideline (C criteria). Prior mid-day reports noted - "Reported earnings +78% on +32% sales revenues for the Mar '17 quarter but fundamental concerns remain. Erratic history is not a match with respect to the C and A criteria."
8/15/2017 12:09:55 PM - Pulling back from its 52-week high today after reporting Jun '17 earnings +9% on +52% sales revenues, below the +25% minimum earnings guideline (C criteria). Prior mid-day reports noted - "Reported earnings +78% on +32% sales revenues for the Mar '17 quarter but fundamental concerns remain. Erratic history is not a match with respect to the C and A criteria."
8/14/2017 12:07:30 PM - Powering to a new 52-week high today with a gap up and considerable volume-driven gain. Due to report Jun '17 earnings news before the U.S. market opens on Tuesday, August 15, 2017. Prior mid-day reports noted - "Reported earnings +78% on +32% sales revenues for the Mar '17 quarter but fundamental concerns remain. Erratic history is not a match with respect to the C and A criteria."
8/11/2017 12:22:29 PM - Perched near its 52-week high following a considerable volume-driven gain. Due to report Jun '17 earnings news soon. Prior mid-day reports noted - "Reported earnings +78% on +32% sales revenues for the Mar '17 quarter but fundamental concerns remain. Erratic history is not a match with respect to the C and A criteria."
8/8/2017 11:47:26 AM - Revered into the red today after rallying for a new 52-week high, posting a considerable volume-driven gain on the prior session. Due to report Jun '17 earnings news. The 8/07/17 mid-day report noted - "Reported earnings +78% on +32% sales revenues for the Mar '17 quarter but fundamental concerns remain. Erratic history is not a match with respect to the C and A criteria."
8/7/2017 12:10:20 PM - Rallying for a new 52-week high with today's volume-driven gain. Reported earnings +78% on +32% sales revenues for the Mar '17 quarter but fundamental concerns remain. Erratic history is not a match with respect to the C and A criteria.
5/22/2017 12:50:05 PM - Rallying for a new 52-week high with today's volume-driven gain. Reported earnings +78% on +32% sales revenues for the Mar '17 quarter but fundamental concerns remain. Not a match with respect to the C and A criteria.
5/19/2017 12:29:20 PM - Rallying near its 52-week high with today's volume-driven gain. Reported earnings +78% on +32% sales revenues for the Mar '17 quarter but fundamental concerns remain. Not a match with respect to the C and A criteria.
5/12/2017 1:17:05 PM - Rebounding near its 52-week high. Reported earnings +78% on +32% sales revenues for the Mar '17 quarter but fundamental concerns remain. Not a match with respect to the C and A criteria.
9/27/2016 12:20:31 PM - Went through a deep consolidation since last noted with caution in the 1/09/15 mid-day report. Fundamentals are no longer a match with respect to the C and A criteria following erratic earnings results while sales revenues growth rate has shown deceleration.
1/9/2015 12:10:22 PM - Met stubborn resistance in prior months at the $97-98 level. Gapped up today, rallying toward prior highs and its 52-week high. Fundamentals remain strong with respect to the C and A criteria. Reported better than expected Sep '14 earnings +70% on +60% sales revenues.
11/17/2014 12:33:13 PM - Reported better than expected Sep '14 earnings +70% on +29% sales revenues and gave encouraging guidance. Pulling back today after tallying a big volume-driven gain when the 11/14/14 mid-day report cautioned members - "Faces resistance due to overhead supply up through the $98 level. Rebounded from a pullback below its 50 DMA line after dropped from the Featured Stocks list on 10/02/14."
11/14/2014 12:07:49 PM - Reported better than expected Sep '14 earnings and gave encouraging guidance. Rallying above recent highs with today's big volume-driven gain, but it faces resistance due to overhead supply up through the $98 level. Rebounded from a pullback below its 50 DMA line after dropped from the Featured Stocks list on 10/02/14.
10/2/2014 1:13:42 PM - Failing to rebound promptly after violating its 50 DMA line with losses amid widespread market (M criteria) weakness. Faces resistance due to overhead supply following recent technical sell signals. It will be dropped from the Featured Stocks list tonight.
10/1/2014 2:00:33 PM - G - Violating its 50 DMA line with today's big loss amid widespread market (M criteria) weakness which is prompting concerns and triggering technical sell signals.
10/1/2014 2:00:30 PM - G - Violating its 50 DMA line with today's big loss amid widespread market (M criteria) weakness which is prompting concerns and triggering technical sell signals.
9/26/2014 6:57:44 PM - G - Rose today with light volume, halting its slide at its 50 DMA line ($74.72). A violation would raise concerns and trigger a technical sell signal. Noted repeatedly with caution - "Has the look of a 'climax run' with volume-driven gains getting very extended from its prior base."
9/25/2014 6:07:02 PM - G - Fell near its 50 DMA line ($74.16) with lighter volume behind today's loss. A violation would raise concerns and trigger a technical sell signal. Noted repeatedly with caution - "Has the look of a 'climax run' with volume-driven gains getting very extended from its prior base."
9/22/2014 12:09:11 PM - G - Undercutting prior lows and slumping toward its 50 DMA line with higher volume behind today's loss. Noted repeatedly with caution - "Has the look of a 'climax run' with volume-driven gains getting very extended from its prior base."
9/18/2014 5:48:51 PM - G - Volume totals have been cooling after halting its slide. See the latest FSU analysis for more details and new annotated graphs. Noted repeatedly with caution - "Has the look of a 'climax run' with volume-driven gains getting very extended from its prior base."
9/15/2014 7:37:12 PM - G - Erased early gains and suffered another loss with above average volume. Recently enduring distributional pressure while fundamentals remain strong. Noted repeatedly with caution - "Has the look of a 'climax run' with volume-driven gains getting very extended from its prior base."
9/11/2014 6:26:45 PM - G - Finished near the session high today but suffered another loss with heavy volume, enduring distributional pressure. Fundamentals remain strong. Noted repeatedly with caution - "Has the look of a 'climax run' with volume-driven gains getting very extended from its prior base."
9/10/2014 4:50:56 PM - G - Halted its slide with a small volume-driven gain today following a considerable loss with heavy volume on the prior session, enduring distributional pressure. Fundamentals remain strong. Noted repeatedly with caution - "Has the look of a 'climax run' with volume-driven gains getting very extended from its prior base."
9/9/2014 6:18:24 PM - G - Considerable loss today with heavy volume, enduring distributional pressure and finishing near the session low. Fundamentals remain strong. Noted repeatedly with caution - "Has the look of a 'climax run' with volume-driven gains getting very extended from its prior base."
9/9/2014 12:06:41 PM - G - Stubbornly holding its ground new its high. Fundamentals remain strong. Noted repeatedly with caution - "Has the look of a 'climax run' with volume-driven gains getting very extended from its prior base."
9/3/2014 5:51:54 PM - G - Rallied today for its second-best close with a small gain backed by slightly above average volume. Fundamentals remain strong, however recently enduring distributional pressure and noted repeatedly with caution - "Has the look of a 'climax run' with volume-driven gains getting very extended from its prior base."
9/2/2014 6:39:57 PM - G - Finished near the session high today for a small gain with above average volume. Fundamentals remain strong, however recently enduring distributional pressure and noted repeatedly with caution - "Has the look of a 'climax run' with volume-driven gains getting very extended from its prior base."
8/28/2014 12:01:51 PM - G - Finished near the session low with a loss on heavy volume on the prior session and enduring more distributional pressure today. Previously noted with caution - "Has the look of a "climax run" with volume-driven gains getting very extended from its prior base." See the latest FSU analysis for more details and annotated graphs.
8/27/2014 6:02:34 PM - G - Finished near the session low with a loss on heavy volume today. Previously noted with caution - "Has the look of a "climax run" with volume-driven gains getting very extended from its prior base." See the latest FSU analysis for more details and new annotated graphs.
8/27/2014 12:14:19 PM - G - Pulling back with above average volume today. Previously noted with caution - "Has the look of a "climax run" with volume-driven gains getting very extended from its prior base. Its 50 DMA line ($58.50) defines important near-term support to watch on pullbacks."
8/26/2014 12:01:16 PM - G - Has the look of a "climax run" with volume-driven gains getting very extended from its prior base. Its 50 DMA line ($58.50) defines important near-term support to watch on pullbacks.
8/25/2014 12:03:03 PM - G - Trading up considerably today with a big gain on heavy volume. Has the look of a "climax run" yet it is very extended from its prior base. Its 50 DMA line ($57.47) defines important near-term support to watch on pullbacks.
8/22/2014 12:21:01 PM - G - Trading up today following a streak of 3 consecutive small losses on heavy volume. Has the look of a "climax run" yet it is very extended from its prior base. Its 50 DMA line ($56.54) defines important near-term support to watch on pullbacks.
8/21/2014 12:07:17 PM - G - Pulling back for a 3rd consecutive loss on heavy volume following a streak of 9 consecutive gains. Has the look of a "climax run" after getting very extended from its prior base. Its 50 DMA line ($55.09) defines important near-term support to watch on pullbacks.
8/20/2014 6:13:20 PM - G - Down for a 2nd consecutive loss on heavy volume following a streak of 9 consecutive gains. Has the look of a "climax run" after getting very extended from its prior base. Its 50 DMA line ($55.09) defines important near-term support to watch on pullbacks.
8/20/2014 11:55:26 AM - G - Paused following 9 consecutive gains, churning heavy volume on the prior session. Has the look of a "climax run" after getting very extended from its prior base. Its 50 DMA line ($55.16) defines important near-term support to watch on pullbacks.
8/19/2014 12:10:23 PM - G - Reversed into the red today after hitting yet another new 52-week high following 9 consecutive gains. Has the look of a "climax run" after getting very extended from its prior base. Its 50 DMA line ($54.30) defines important near-term support to watch on pullbacks.
8/18/2014 1:24:45 PM - G - Powering to yet another new 52-week high with today's 9th consecutive gain, having the look of a "climax run" and getting more extended from its prior base. Its 50 DMA line ($53.48) defines important near-term support to watch on pullbacks.
8/15/2014 1:51:01 PM - G - Powering to yet another new 52-week high with today's 8th consecutive gain, having the look of a "climax run" and getting more extended from its prior base. Its 50 DMA line ($52.67) defines important near-term support to watch on pullbacks.
8/13/2014 12:08:03 PM - G - Powering to yet another new 52-week high with today's 6th consecutive gain, getting more extended from its prior base. Its 50 DMA line ($51.19) defines important near-term support to watch on pullbacks.
8/12/2014 10:59:01 AM - G - Powering to yet another new 52-week high with today's 5th consecutive gain, getting more extended from its prior base. Its 50 DMA line ($50.39) defines important near-term support to watch on pullbacks.
8/11/2014 1:22:33 PM - G - Powering to another new 52-week high with today's 4th consecutive gain, getting more extended from its prior base. Its 50 DMA line ($49.79) defines important near-term support to watch on pullbacks. See the latest FSU analysis for more details and annotated graphs.
8/8/2014 7:40:40 PM - G - Perched at its 52-week high after today's 3rd consecutive gain, getting more extended from its prior base. Its 50 DMA line ($49.27) defines important near-term support to watch on pullbacks. See the latest FSU analysis for more details and new annotated graphs.
8/8/2014 4:03:55 PM - G - Perched at its 52-week high after today's 3rd consecutive gain, getting more extended from its prior base. Its 50 DMA line ($49.27) defines important near-term support to watch on pullbacks.
8/4/2014 12:10:19 PM - G - Hitting a new 52-week high with today's volume-driven gain, getting more extended from its prior base. Its 50 DMA line ($47.63) defines important near-term support to watch on pullbacks.
8/1/2014 5:44:40 PM - G - Posted a gain today snapping a streak of 3 consecutive losses. It remains extended from its prior base after recently wedging higher. Prior highs and its 50 DMA line coincide in the $46 area defining important near-term support to watch on pullbacks.
7/31/2014 4:02:23 PM - G - Pulled back with today's 3rd consecutive loss on average volume. It remains extended from its prior base after recently wedging higher. Prior highs and its 50 DMA line coincide in the $46 area defining important near-term support to watch on pullbacks.
7/29/2014 8:07:00 PM - G - Small loss today on higher but below average volume. It remains extended from its prior base after recently wedging higher. Prior highs and its 50 DMA line coincide in the $46 area defining important near-term support to watch on pullbacks.
7/23/2014 4:29:08 PM - G - Hit another new high with below average volume behind today's 4th consecutive gain, getting more extended from its prior base while wedging higher.
7/21/2014 6:14:34 PM - G - Consolidating above its "max buy" level, extended from its prior base. See the latest FSU analysis for more details and annotated graphs.
7/17/2014 4:35:10 PM - G - Pulled back today with lighter volume. Consolidating above its "max buy" level, extended from its prior base.
7/14/2014 12:09:33 PM - G - Hitting another new 52-week high with today's 4th consecutive gain, getting more extended from its prior base. Managed a "positive reversal" on 7/10/14 after trading down considerably, likely prompting disciplined investors to sell if it fell more than -7% from their purchase price. Any stock which is sold can be bought back later if strength returns, however rule number one is to always limit losses while they are small.
7/11/2014 12:11:00 PM - G - Touched a new 52-week high today after rebounding above its "max buy" level and its color code is changed to green. Managed a "positive reversal" on the prior session after trading down considerably, likely prompting disciplined investors to sell if it fell more than -7% from their purchase price. Any stock which is sold can be bought back later if strength returns, however rule number one is to always limit losses while they are small.
7/10/2014 6:08:51 PM - Y - Managed a "positive reversal" today after trading down considerably earlier. Color code was changed to yellow after the volume-driven loss on 7/08/14. Keep in mind that odds are far more favorable for investors who buy while stocks are rising, rather than accumulating on pullbacks.
7/8/2014 12:25:36 PM - Y - Down considerably today with above average volume amid widespread weakness in China-based companies. Prior highs near $46 define initial support to watch. Color code is changed to yellow after the pullback. Keep in mind that odds are far more favorable for investors who buy while stocks are rising, rather than accumulating on pullbacks.
7/7/2014 4:37:39 PM - G - Hit a new 52-week high while rallying above its "max buy" level with slightly above average volume behind today's gain and its color code is changed to green.
7/3/2014 2:57:57 PM - Y - Holding its ground stubbornly near its 52-week high with volume totals cooling indicating that few investors have headed for the exit. A gain above its pivot point on 6/30/14 backed by +50% above average volume triggered a technical buy signal.
6/30/2014 11:54:54 AM - Y - Hit a new 52-week high and rallied above its pivot point with above average volume behind today's 4th consecutive gain. See the latest FSU analysis for more details and annotated graphs. The 6/26/14 mid-day report (read here) noted - "A gain above the pivot point backed by at least +40% above average volume could trigger a technical buy signal."
6/30/2014 10:59:49 AM - Y - Hitting a new 52-week high and rallying above its pivot point with above average volume behind today's 4th consecutive gain. See the latest FSU analysis for more details and annotated graphs. It was highlighted in yellow in the 6/26/14 mid-day report (read here) with while noted - "A gain above the pivot point backed by at least +40% above average volume could trigger a technical buy signal."
6/27/2014 6:52:23 PM - Y - Perched at its 52-week high today, it quietly held its ground. See the latest FSU analysis for more details and new annotated graphs. It was highlighted in yellow in the 6/26/14 mid-day report (read here) with while noted - "A gain above the pivot point backed by at least +40% above average volume could trigger a technical buy signal."
6/26/2014 6:21:50 PM - Y - It was highlighted in yellow in the earlier mid-day report (read here) with new new pivot point cited based on the 3/06/14 high plus 10 cents while noted - "A gain above the pivot point backed by at least +40% above average volume could trigger a technical buy signal. Fundamentals remain strong with respect to the C and A criteria as it reported earnings +100% on +47% sales revenues for the Mar '14 quarter since dropped from the Featured Stocks list on 1/27/14.
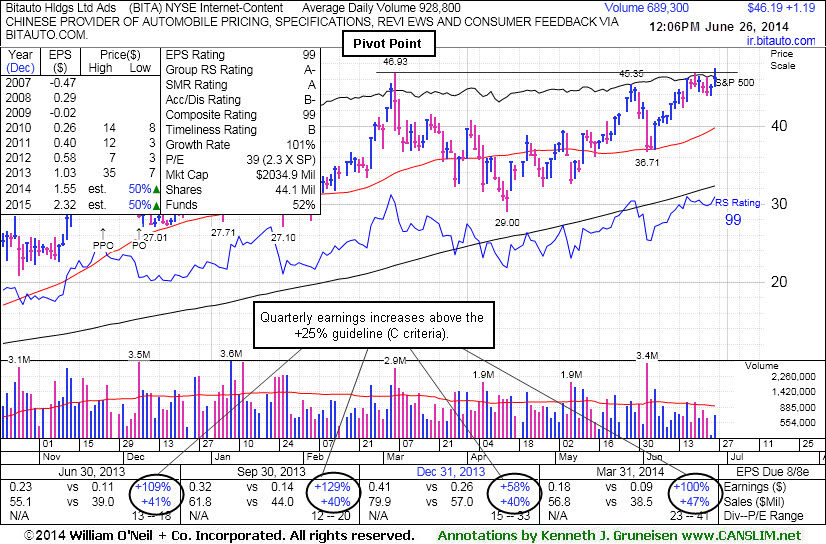
6/26/2014 12:57:48 PM - Y - Color code is changed to yellow with new new pivot point cited based on the 3/06/14 high plus 10 cents. A gain above the pivot point backed by at least +40% above average volume could trigger a technical buy signal. Fundamentals remain strong with respect to the C and A criteria as it reported earnings +100% on +47% sales revenues for the Mar '14 quarter since dropped from the Featured Stocks list on 1/27/14.
3/6/2014 12:29:37 PM - Fundamentals remain strong with respect to the C and A criteria. Found prompt support since dropped from the Featured Stocks list on 1/27/14 and rallied to new high territory. It may produce more climactic gains, but it did not form a sound base pattern and it is extended well beyond prior highs.
1/27/2014 7:03:46 PM - Violated it 50 DMA line while suffering a 3rd consecutive big volume-driven loss triggering a technical sell signal. It will be dropped from the Featured Stocks list tonight due to weak technical action.
1/27/2014 3:18:00 PM - G - Violated it 50 DMA line while suffering a 3rd consecutive big volume-driven loss triggering a technical sell signal and its color code is changed to green.
1/24/2014 11:32:23 AM - Y - Suffering a 2nd consecutive big loss amid widespread weakness in China-related issues. Raising concerns while undercutting prior highs in the $35 area previously noted as support to watch above its 50 DMA line ($31.52 now).
1/23/2014 3:18:58 PM - Y - Down considerably today amid widespread weakness in China-related issues. Color code is changed to yellow after retreating below its "max buy" level. Prior highs in the $35 area define support to watch above its 50 DMA line.
1/21/2014 3:16:48 PM - G - Poised for a best-ever close with today's gain lifting it beyond its "max buy" level. Prior highs in the $35 area define support to watch above its 50 DMA line.
1/13/2014 3:29:55 PM - G - Encountering distributional pressure this afternoon, it reversed into the red after early gains beyond its "max buy" level. Pyramiding is a tactic taught in the Certification designed to let the market action dictate your entries while proper discipline suggests that gains above a stock's pivot point should have at least +40% above average volume to trigger a valid technical buy signal.
1/13/2014 12:47:25 PM - G - Hitting new highs with today's gain, and its color code is changed to green while getting extended beyond the "max buy" level. Pyramiding is a tactic taught in the Certification designed to let the market action dictate your entries while proper discipline suggests that gains above a stock's pivot point should have at least +40% above average volume to trigger a valid technical buy signal.
1/10/2014 5:57:59 PM - Y - Hit a new high and finished strong with today's gain on only average volume. Gains above a stock's pivot point should have at least +40% above average volume to trigger a proper technical buy signal. Highlighted in yellow with new pivot point cited based on its 11/25/13 high plus 10 cents in the 1/08/14 mid-day report (read here) while noted with caution - "Subsequent volume-driven gains to new highs may trigger a new technical buy signal. Found support above its 50 DMA line during its consolidation since completing a Public Offering on 12/06/13. Faces little overhead supply to act as resistance A 50 DMA line violation would be a more worrisome technical sell signal. See the latest FSU analysis for more details and new annotated graphs."
1/9/2014 12:10:19 PM - Y - Hitting a new high today and trading above its pivot point after finishing strong on the prior session. Highlighted in yellow with new pivot point cited based on its 11/25/13 high plus 10 cents in the 1/08/14 mid-day report (read here) while noted with caution - "Subsequent volume-driven gains to new highs may trigger a new technical buy signal. Found support above its 50 DMA line during its consolidation since completing a Public Offering on 12/06/13. Faces little overhead supply to act as resistance A 50 DMA line violation would be a more worrisome technical sell signal. See the latest FSU analysis for more details and new annotated graphs."
1/8/2014 6:01:31 PM - Y - Finished strong after highlighted in yellow with new pivot point cited based on its 11/25/13 high plus 10 cents in the earlier mid-day report (read here). Subsequent volume-driven gains to new highs may trigger a new technical buy signal. Found support above its 50 DMA line during its consolidation since completing a Public Offering on 12/06/13. Faces little overhead supply to act as resistance A 50 DMA line violation would be a more worrisome technical sell signal. See the latest FSU analysis for more details and new annotated graphs.
1/8/2014 12:24:57 PM - Y - Color code is changed to yellow with new pivot point cited based on its 11/25/13 high plus 10 cents. Subsequent volume-driven gains to new highs may trigger a new technical buy signal. Found support above its 50 DMA line during its consolidation since completing a Public Offering on 12/06/13. Faces little overhead supply to act as resistance A 50 DMA line violation would be a more worrisome technical sell signal.
12/26/2013 12:49:32 PM - Found support above its 50 DMA line since dropped from the Featured Stocks list on 12/11/13, however it has not formed a sound base pattern. Completed a Public Offering on 12/06/13, and it faces overhead supply that may act as resistance up through the $35 level. A 50 DMA line violation would be a more worrisome technical sell signal.
12/11/2013 5:04:26 PM - It will be dropped from the Featured Stocks list tonight after finishing the session near its low and -21.5% off its 52-week high. Completed a Public Offering on 12/06/13, and it faces overhead supply that may act as resistance up through the $35 level. It may test support at its 50 DMA line, where a violation would be a more worrisome sign.
12/6/2013 3:53:46 PM - G - Priced a new Public Offering and it is down considerably today with heavy volume, now trading -19% off its 52-week high and slumping near its prior high in the $28 area defining initial support above its 50 DMA line.
12/5/2013 4:02:25 PM - G - Volume totals have been cooling while consolidating and now trading -12% off its 52-week high, still extended from any sound base. Its prior high in the $28 area define initial support to watch on pullbacks.
11/29/2013 10:53:00 AM - G - Hovering near its 52-week high, very extended from any sound base. Its prior high in the $28 area define initial support to watch on pullbacks.
11/26/2013 1:06:13 PM - G - Gapped down today, retreating from its 52-week high. Very extended from any sound base. Prior high in the $28 area define initial support to watch on pullbacks.
11/22/2013 8:09:33 PM - G - Rallied for another new high close today, getting more extended from any sound base. Prior high in the $28 area define initial support to watch on pullbacks.
11/21/2013 5:33:10 PM - G - Rallied for a new high close today, getting more extended from any sound base. Prior high in the $28 area define initial support to watch on pullbacks.
11/20/2013 1:27:48 PM - G - Small gap up today. Holding its ground near its 52-week high after a "negative reversal" following a streak of 6 consecutive volume-driven gains. Very extended from any sound base, meanwhile, its prior high in the $28 area defines initial support to watch on pullbacks.
11/18/2013 1:28:20 PM - G - Hitting yet another new 52-week high with today's 7th consecutive volume-driven gain, getting more extended from any sound base. Prior high in the $28 area defines initial support to watch on pullbacks.
11/15/2013 4:11:48 PM - G - Hit another new 52-week high with its 6th consecutive volume-driven gain, getting more extended from any sound base. Prior high in the $28 area defines initial support to watch on pullbacks.
11/13/2013 12:00:54 PM - G - Hitting another new 52-week high today while on track for a 4th consecutive volume-driven gain, getting more extended from any sound base. See the latest Featured Stock Update for more detailed analysis and annotated daily and weekly graphs.
11/12/2013 11:55:04 AM - G - Considerable gain today has it poised for a best-ever close, getting more extended from any sound base. See the latest FSU analysis for more details and annotated daily and weekly graphs
11/11/2013 5:57:11 PM - G - Consolidating near its high, extended from any sound base. See the latest FSU analysis for more details and new annotated daily and weekly graphs
11/8/2013 6:18:02 PM - G - Posted a gain today with near above average volume. Its 50 DMA line and prior highs define important support to watch on pullbacks.
11/7/2013 9:16:41 PM - G - Reversed into the red for a loss today with above average volume. Its 50 DMA line and prior highs define important support to watch on pullbacks.
11/6/2013 3:58:41 PM - G - Reversed in the red abruptly after early gains today. It remains very extended from its prior base and volume totals have been cooling over the past week. Its 50 DMA line and prior highs define important support to watch on pullbacks.
11/5/2013 6:42:44 PM - G - It remains very extended from its prior base and volume totals have been cooling while holding its ground. Its 50 DMA line and prior highs define important support to watch on pullbacks.
10/30/2013 2:06:47 PM - G - Down considerably for its 3rd volume-driven loss in the span of 4 sessions. Wider than usual intra-day price swings in recent days is a worrisome sign of uncertainty while it remains very extended from its prior base. Prior highs in the $18 area define initial support to watch on pullbacks.
10/29/2013 3:26:17 PM - G - Rebounding with above average volume behind today's solid gain. It is very extended from its prior base. Prior highs in the $18 area define initial support to watch on pullbacks.
10/28/2013 6:40:03 PM - G - Endured 2 consecutive damaging volume-driven losses yet remains very extended from its prior base. Prior highs in the $18 area define initial support to watch on pullbacks.
10/25/2013 2:54:57 PM - G - Down considerably with heavy volume today yet rebounding from the session's deeper lows. A finish in the upper third of its intra-day range would be a reassuring sign it is attracting prompt and solid support. Recently noted - "It may go on to produce more climactic gains, however it is very extended from its prior base. Prior highs in the $18 area define initial support to watch on pullbacks."
10/22/2013 12:08:19 PM - G - Churning above average volume today and it touched yet another new high. Recently noted - "It may go on to produce more climactic gains, however it is very extended from its prior base. Prior highs in the $18 area define initial support to watch on pullbacks."
10/21/2013 1:29:11 PM - G - Hitting yet another new high today. Recently noted - "It may go on to produce more climactic gains, however it is very extended from its prior base. Prior highs in the $18 area define initial support to watch on pullbacks."
10/18/2013 12:18:39 PM - G - Hit another new high today then reversed into the red following 5 consecutive gains. It may go on to produce more climactic gains, however it is very extended from its prior base. Prior highs in the $18 area define initial support to watch on pullbacks.
10/17/2013 12:15:17 PM - G - Hitting another new all-time high with today's 5th consecutive gain. It may go on to produce more climactic gains, however it is very extended from its prior base. Prior highs in the $18 area define initial support to watch on pullbacks.
10/16/2013 12:27:05 PM - G - Hitting new all-time highs today, getting more extended from its prior base. Prior highs in the $18 area define initial support to watch on pullbacks.
10/15/2013 6:49:23 PM - G - Rallied for a big gain today with above average volume for its second-best close. Prior highs in the $18 area define initial support to watch on pullbacks.
10/11/2013 6:04:02 PM - G - Posted a gain today on lighter volume following 2 negative reversals in the prior 3 sessions. Prior highs in the $18 area define initial support to watch on pullbacks.
10/10/2013 7:10:05 PM - G - Finished in the red after a 2nd negative reversal in the past 3 sessions. Prior highs in the $18 area define initial support to watch on pullbacks.
10/9/2013 6:23:49 PM - G - Posted a solid gain today with above average volume. Prior highs in the $18 area define define initial support to watch on pullbacks.
10/8/2013 12:45:07 PM - G - Hit another new 52-week high today and then reversed into the red. Prior highs in the $18 area define define initial support to watch on pullbacks.
10/7/2013 12:05:17 PM - G - Hitting new 52-week highs while adding to its recent spurt of volume-driven gains. Prior highs in the $18 area define define initial support to watch on pullbacks.
10/4/2013 12:13:30 PM - G - Gain today has it rallying further above its "max buy" level to new 52-week highs. Prior highs in the $18 area define define initial support on pullbacks. See the latest FSU analysis for more details and a new annotated graph.
10/3/2013 12:20:16 PM - G - Color code is changed to green after getting extended from its prior base and rallying beyond its "max buy" level to new 52-week highs with considerable volume-driven gains. Prior highs in the $18 area define define initial support on pullbacks. See the latest FSU analysis for more details and a new annotated graph.
10/2/2013 7:54:13 PM - Y - Today's gain with 3 times average volume helped it rise further above its pivot point to new 52-week highs. Prior gain with 3 times average volume triggered a new (or add-on) technical buy signal. Its 50 DMA line defines important support. See the latest FSU analysis for more details and a new annotated graph.
10/2/2013 12:26:13 PM - Y - Today's 2nd consecutive gain with above average volume has it rising further above its pivot point to new 52-week highs. Prior gain with 3 times average volume triggered a new (or add-on) technical buy signal. Its 50 DMA line defines important support.
10/1/2013 12:07:17 PM - Y - Solid gain today with above average volume while rising above its pivot point and challenging its 52-week high. A strong finish may clinch a new (or add-on) technical buy signal. Its 50 DMA line defines important support.
9/30/2013 12:07:29 PM - Y - Pulling back today following Friday's gain with slightly above average volume for a best-ever close. New pivot point cited based on its 9/09/13 high plus 10 cents after an advanced "3-weeks tight" base. A volume-driven gain above its pivot point may trigger a new (or add-on) technical buy signal. Its 50 DMA line defines important support.
9/27/2013 4:17:19 PM - Y - Rallied today with slightly above average volume for a best-ever close. New pivot point cited based on its 9/09/13 high plus 10 cents after an advanced "3-weeks tight" base. A volume-driven gain above its pivot point may trigger a new (or add-on) technical buy signal. Its 50 DMA line defines important support.
9/24/2013 3:51:59 PM - Y - Color code is changed to yellow with new pivot point cited based on its 9/09/13 high plus 10 cents after an advanced "3-weeks tight" base. Above average volume behind today's 4th consecutive gain has it poised for possibly a best-ever close. A volume-driven gain above its pivot point may trigger a new (or add-on) technical buy signal. Its 50 DMA line defines important support.
9/19/2013 7:14:36 PM - G - Rallied for a big gain on average volume today after a streak of 5 consecutive losses as it endured distributional pressure. Its choppy 6-week consolidation above its 50 DMA line and prior highs is not recognized as a sound base pattern.
9/17/2013 3:17:41 PM - G - Recently encountered distributional pressure. Its choppy 6-week consolidation above its 50 DMA line and prior highs is not recognized as a sound base pattern.
9/12/2013 4:02:47 PM - G - Gapped down today, retreating with heavy volume following a best-ever close on the prior session. During its choppy consolidation it found support above its 50 DMA line and prior highs.
9/10/2013 12:02:16 PM - G - Finished near the session low after early gains had it poised for a best-ever close on the prior session. During its choppy consolidation it found support above its 50 DMA line and prior highs.
9/9/2013 12:10:39 PM - G - Gapped up today, rallying for a 3rd consecutive volume-driven gain and poised for a best-ever close. During its choppy consolidation it found support above its 50 DMA line and prior highs.
9/6/2013 6:24:05 PM - G - Churned heavy volume today while encountering resistance after rallying within close striking distance of its best-ever close. Found support above its 50 DMA line and prior highs.
9/5/2013 12:11:59 PM - G - Considerable volume-driven gain today, rallying within close striking distance of its best-ever close. Found support above its 50 DMA line and prior highs.
9/3/2013 9:37:55 PM - G - Consolidating above its 50 DMA line and prior highs. See the latest FSU analysis for more details and a new annotated graph.
8/27/2013 7:41:23 PM - G - Down considerably today with above average volume. Still consolidating well above its 50 DMA line and prior highs. Disciplined investors always limit losses if any stock falls more than -7-8% from their purchase price.
8/26/2013 11:57:16 AM - G - Found prompt support near prior highs. Consolidating well above its 50 DMA line. Disciplined investors always limit losses if any stock falls more than -7-8% from their purchase price.
8/22/2013 5:48:25 PM - G - Tallied 3 gains with above average volume in the span of 4 sessions since finding prompt support near prior highs. Consolidating well above its 50 DMA line. Disciplined investors always limit losses if any stock falls more than -7-8% from their purchase price.
8/21/2013 9:19:42 PM - G - Found prompt support near prior highs and it is now consolidating well above its 50 DMA line. Disciplined investors always limit losses if any stock falls more than -7-8% from their purchase price.
8/19/2013 12:06:37 PM - G - Gapped up today, finding prompt support near prior highs and rebounding toward its recent high closes following 5 consecutive losses marked by above average volume. Disciplined investors always limit losses if any stock falls more than -7-8% from their purchase price.
8/16/2013 6:55:39 PM - G - Negated its impressive breakout gains and retraced back to prior high with 5 consecutive losses marked by above average volume. Disciplined investors always limit losses if any stock falls more than -7-8% from their purchase price.
8/15/2013 7:15:21 PM - G - Gapped down today for a 4th consecutive loss, retreating toward prior highs in the $13 area which define initial support to watch. The 8/07/13 After Market Update included more details and a new annotated graph under the headline "Found Prompt Support After Undercutting 50-Day Average".
8/13/2013 6:41:09 PM - G - Holding its ground stubbornly after 2 consecutive big volume-driven gains for new highs. Prior highs in the $13 area define initial support to watch on pullbacks. The 8/07/13 After Market Update included more details and a new annotated graph under the headline "Found Prompt Support After Undercutting 50-Day Average".
8/9/2013 12:27:09 PM - G - Tallying its 2nd consecutive volume-driven gain for new highs. Color code was changed to green after quickly getting extended beyond the "max buy" level. Prior highs in the $13 area define initial support to watch on pullbacks. The 8/07/13 After Market Update included more details and a new annotated graph under the headline "Found Prompt Support After Undercutting 50-Day Average".
8/9/2013 10:33:57 AM - G - Color code is changed to green after quickly getting extended beyond the "max buy" level cited. Prior highs in the $13 area define initial support to watch on pullbacks. The 8/07/13 After Market Update included more details and a new annotated graph under the headline "Found Prompt Support After Undercutting 50-Day Average".
8/8/2013 12:22:53 PM - Y - Gapped up today and rallied to a new 52-week high with heavy volume behind its considerable gain. Rallied above the pivot point based on its 5/08/13 high plus 10 cents noted in the prior mid-day report (read here). This China-based Internet-Content firm reported earnings +109% on +41% sales revenues for the Jun '13 quarter, continuing its strong earnings history (C and A criteria). Last evening's After Market Update included more details and a new annotated graph under the headline "Found Prompt Support After Undercutting 50-Day Average".
8/7/2013 6:08:37 PM - Y - Highlighted in yellow with pivot point based on its 5/08/13 high plus 10 cents in the earlier mid-day report (read here). This China-based Internet-Content firm is due to report Second Quarter 2013 financial results before the open on Thursday, August 8, 2013. Found prompt support after undercutting its 50 DMA line following today's gap down. Churned above average volume without making price progress on the right side of its choppy 13-week base pattern, a sign of distributional pressure. Quarterly and annual earnings (C and A criteria) history through Mar '13 has been strong. Its small supply (S criteria) of only 14.4 million shares in the public float can contribute to great volatility in the event of institutional buying or selling. Volume driven gains are needed to to trigger a technical buy signal. See the latest FSU analysis for more details and a new annotated graph.
8/7/2013 12:40:42 PM - Y - Color code is changed to yellow with pivot point based on its 5/08/13 high plus 10 cents. This China-based Internet-Content firm is due to report Second Quarter 2013 financial results before the open on Thursday, August 8, 2013. Found prompt support after undercutting its 50 DMA line following today's gap down. Churned above average volume without making price progress on the right side of its choppy 13-week base pattern, a sign of distributional pressure. Quarterly and annual earnings (C and A criteria) history through Mar '13 has been strong. Its small supply (S criteria) of only 14.4 million shares in the public float can contribute to great volatility in the event of institutional buying or selling. Volume driven gains are needed to to trigger a technical buy signal.
8/2/2013 12:23:55 PM - Churning above average volume without making price progress on the right side of a choppy 13-week base pattern, this China-based Internet-Content firm is perched -8% from its 52-week high and near multi-year highs . Due to report Second Quarter 2013 financial results on Thursday, August 8, 2013. Quarterly and annual earnings (C and A criteria) history through Mar '13 has been strong. Its small supply (S criteria) of only 14.4 million shares in the public float can contribute to great volatility in the event of institutional buying or selling.
7/29/2013 12:20:44 PM - This China-based Internet-Content firm is perched -7.9% from its 52-week high and near multi-year highs on the right side of a choppy 12-week base pattern. Quarterly and annual earnings (C and A criteria) history has been strong. Its small supply (S criteria) of only 14.4 million shares in the public float can contribute to great volatility in the event of institutional buying or selling.
7/26/2013 12:26:38 PM - This China-based Internet-Content firm is perched -7.2% from its 52-week high and near multi-year highs on the right side of a choppy 11-week base pattern. Quarterly and annual earnings (C and A criteria) history has been strong. Its small supply (S criteria) of only 14.4 million shares in the public float can contribute to great volatility in the event of institutional buying or selling.
6/12/2013 12:36:17 PM - Quarterly and annual earnings (C and A criteria) history has been strong. This China-based Internet-Content firm is perched within close striking distance of its 52-week high and near multi-year highs but it has not formed a sound base pattern. It has rallied with above average volume behind 4 consecutive gains after finding recent support near its 50 DMA line. Its small supply (S criteria) of only 14.4 million shares in the public float can contribute to great volatility in the event of institutional buying or selling.