Violated 50-Day Moving Average Following Latest Earnings Report - Friday, May 3, 2019
Zebra Extended From Prior Base - Monday, March 25, 2019
Big Volume-Driven Gain for New High - Thursday, February 14, 2019
Consolidating Above 200-Day Moving Average - Tuesday, December 18, 2018
Challenging High After Rebound Above 50-day Average - Wednesday, November 28, 2018
Hit New High Following Another Strong Earnings Increase - Tuesday, November 6, 2018
Zebra Tech Sputtering Near 50-Day Moving Average - Tuesday, October 23, 2018
Hovering Near All-Time High With Strong Fundamentals - Monday, September 24, 2018
Big Gain for New High Backed by Heavy Volume - Tuesday, August 7, 2018
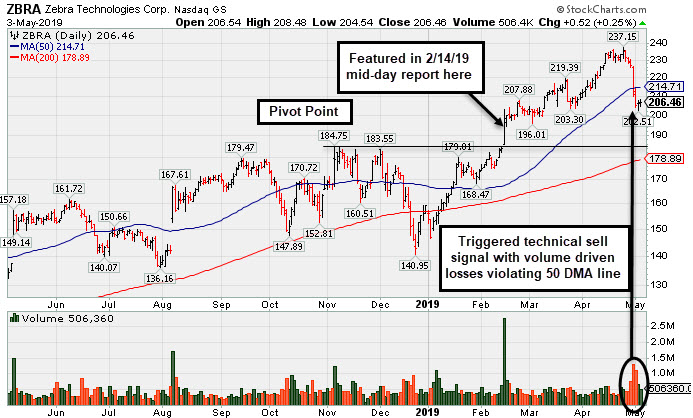
Violated 50-Day Moving Average Following Latest Earnings Report - Friday, May 3, 2019
Zebra Tech Corp Cl A (ZBRA +$0.52 or +0.25% to $206.46) slumped below its 50-day moving average (DMA) line ($214.71) with this week's damaging volume-driven losses triggering a technical sell signal. Weak action came after it reported earnings +14% on +9% sales revenues for the Mar '19 quarter, below the +25% minimum earnings guideline (C criteria). Volume and volatility often increase near earnings news.
It was last shown in this FSU section on 3/25/19 with an annotated graph under the headline, "Zebra Extended From Prior Base". ZBRA traded up as much as +19.7% after highlighted in yellow with new pivot point cited based on its 11/06/18 high plus 10 cents in the 2/14/18 mid-day report (read here).
Fundamentals remain strong and the bullish action came after it reported earnings +33% on +11% sales revenues for the Dec '18 quarter,continuing its strong earnings track record. The past 4 quarters showed earnings increases above the +25% minimum guideline (C criteria). Annual earnings (A criteria) history has been strong since a downturn in FY '08 and '09.
The number of top-rated funds owning its shares from 553 in Sep '17 to 800 in Mar '19, a reassuring sign concerning the I criteria. Its current Up/Down Volume Ratio of 1.0 is an unbiased indication its shares have been neutral concerning accumulation/distribution over the past 50 days. It has earned an B Timeliness Rating and a B Sponsorship Rating. There are 53.9 million shares outstanding (S criteria) which can contribute to greater price volatility in the event of institutional buying or selling.
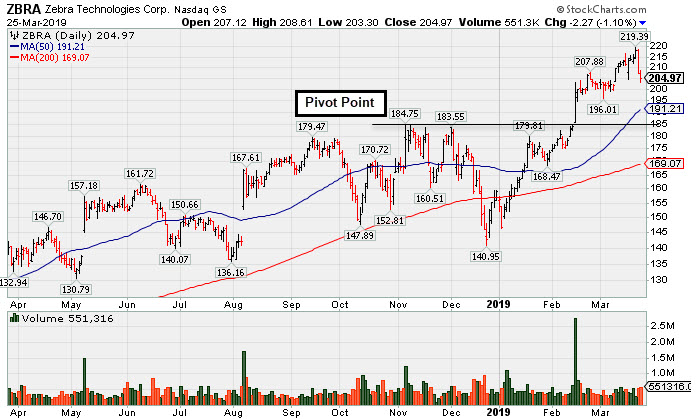
Zebra Extended From Prior Base - Monday, March 25, 2019
Zebra Tech Corp Cl A (ZBRA -$2.27 or -1.10% to $204.97) is extended from the prior base after wedging higher with recent gains lacking great volume-conviction. Its 50-day moving average DMA line ($191) and prior highs in the $184 area define important near-term support to watch.
ZBRA was highlighted in yellow with new pivot point cited based on its 11/06/18 high plus 10 cents in the 2/14/18 mid-day report (read here). It hit a new all-time high with +480% above average volume behind its gain clinching a technical buy signal. This FSU section on 2/14/19 included an annotated graph under the headline, "Big Volume-Driven Gain for New High".
Fundamentals remain strong and the bullish action came after it reported earnings +33% on +11% sales revenues for the Dec '18 quarter,continuing its strong earnings track record. The past 4 quarters showed earnings increases above the +25% minimum guideline (C criteria). Annual earnings (A criteria) history has been strong since a downturn in FY '08 and '09.
The number of top-rated funds owning its shares from 553 in Sep '17 to 740 in Dec '18, a reassuring sign concerning the I criteria. Its current Up/Down Volume Ratio of 2.4 is an unbiased indication its shares have been under accumulation over the past 50 days. It has earned an A Timeliness Rating and a B Sponsorship Rating. There are 53.8 million shares outstanding (S criteria) which can contribute to greater price volatility in the event of institutional buying or selling.
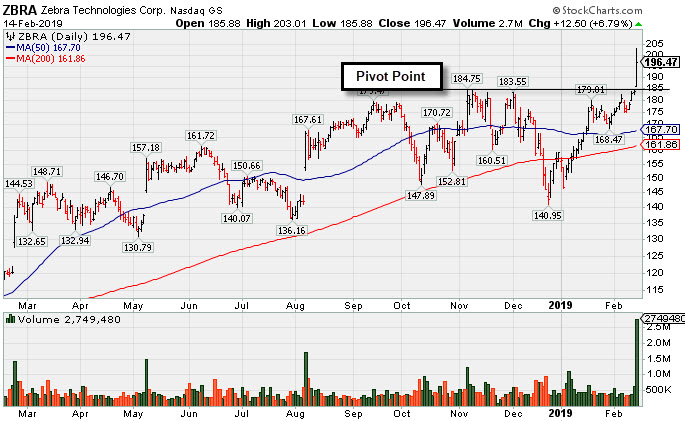
Big Volume-Driven Gain for New High - Thursday, February 14, 2019
Zebra Tech Corp Cl A (ZBRA +$12.50 or +6.79% to $196.47) was highlighted in yellow with new pivot point cited based on its 11/06/18 high plus 10 cents in the earlier mid-day report (read here). It hit a new all-time high with +480% above average volume behind its gain clinching a technical buy signal.
Fundamentals remain strong and the bullish action came after it reported earnings +33% on +11% sales revenues for the Dec '18 quarter, continuing its strong earnings track record. The past 4 quarters showed earnings increases above the +25% minimum guideline (C criteria). Annual earnings (A criteria) history has been strong since a downturn in FY '08 and '09.
It rebounded impressively after a slump below its 200-day moving average (DMA) line since dropped from the Featured Stocks list on 12/20/18. ZBRA was last shown in this FSU section on 12/18/18 with an annotated graph under the headline, "Consolidating Above 200-Day Moving Average".
The number of top-rated funds owning its shares from 553 in Sep '17 to 735 in Dec '18, a reassuring sign concerning the I criteria. Its current Up/Down Volume Ratio of 2.0 is an unbiased indication its shares have been under slight accumulation over the past 50 days. It has earned an A Timeliness Rating and a B Sponsorship Rating. There are 53.8 million shares outstanding (S criteria) which can contribute to greater price volatility in the event of institutional buying or selling.
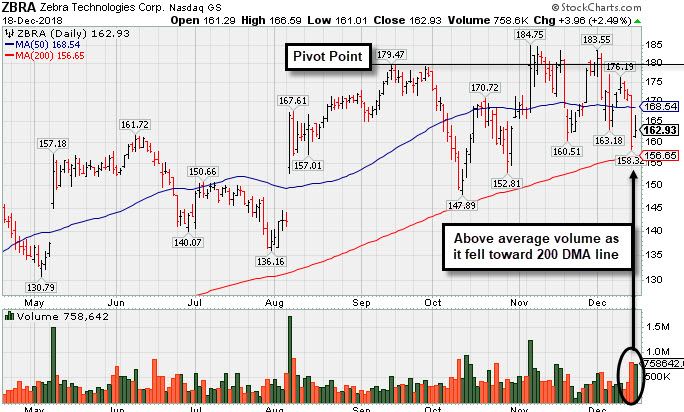
Consolidating Above 200-Day Moving Average - Tuesday, December 18, 2018
Zebra Tech Corp Cl A (ZBRA +$3.96 or +2.49% to $162.93) rebounded a little today after a slump toward its 200-day moving average (DMA) line, ending -11.8% off its all-time high. A damaging volume-driven loss on the prior session violated its 50 DMA line ($168) and undercut the recent lows triggering a technical sell signal. The 200 DMA line ($156) defines important near-term support to watch. A rebound above the 50 DMA line is needed for its outlook to improve. Concerns remain until a follow-through day confirms a new market rally (M criteria).
It reported Sep '18 earnings +54% on +17% sales revenues, continuing its strong earnings track record. Fundamentals remain strong. The past 3 quarters showed earnings increases above the +25% minimum guideline (C criteria). Recent sequential comparisons show encouraging sales revenues acceleration. Annual earnings (A criteria) history has been strong since a downturn in FY '08 and '09.
ZBRA has sputtered since last shown in this FSU section on 11/28/18 with an annotated graph under the headline, "Challenging High After Rebound Above 50-day Average". It was highlighted in yellow with pivot point cited based on its 6/08/18 high plus 10 cents in the 8/07/18 mid-day report (read here). It found support in recent months after pullbacks near its 200 DMA line.
The number of top-rated funds owning its shares from 553 in Sep '17 to 698 in Sep '18, a reassuring sign concerning the I criteria. Its current Up/Down Volume Ratio of 1.1 is an unbiased indication its shares have been under slight accumulation over the past 50 days. It has earned an A Timeliness Rating and a B Sponsorship Rating. There are 53.8 million shares outstanding (S criteria) which can contribute to greater price volatility in the event of institutional buying or selling.
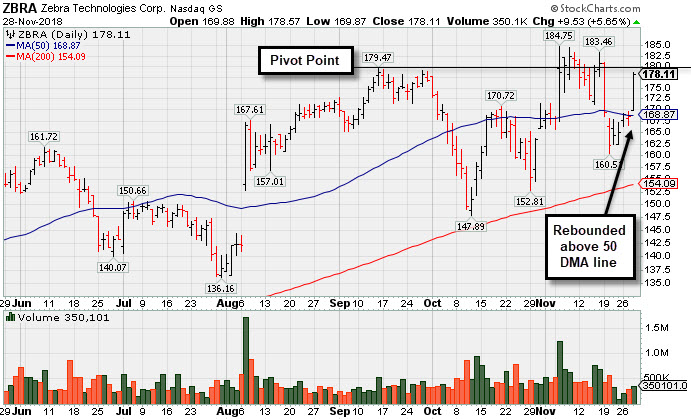
Challenging High After Rebound Above 50-day Average - Wednesday, November 28, 2018
Zebra Tech Corp Cl A (ZBRA+$9.53 or +5.65% to $178.11) posed a big gain rebounding above its 50-day moving average (DMA) line ($169) toward the prior high. The prior lows and 200 DMA line ($154) define important near-term support to watch.
It reported Sep '18 earnings +54% on +17% sales revenues, continuing its strong earnings track record. Fundamentals remain strong. The past 3 quarters showed earnings increases above the +25% minimum guideline (C criteria). Recent sequential comparisons show encouraging sales revenues acceleration. Annual earnings (A criteria) history has been strong since a downturn in FY '08 and '09.
Confirming volume-driven gains for the stock were a reassuring sign after ZBRA was last shown in this FSU section on 11/06/18 with an annotated graph under the headline, "Hit New High Following Another Strong Earnings Increase". However, concerns also remain until a follow-through day confirms a new market rally (M criteria). It was highlighted in yellow with pivot point cited based on its 6/08/18 high plus 10 cents in the 8/07/18 mid-day report (read here). It faces very little resistance due to overhead supply. It found support in recent weeks after a pullback near its 200 DMA line.
The number of top-rated funds owning its shares from 553 in Sep '17 to 687 in Sep '18, a reassuring sign concerning the I criteria. Its current Up/Down Volume Ratio of 1.1 is an unbiased indication its shares have been under slight accumulation over the past 50 days. It has earned an A Timeliness Rating and a B Sponsorship Rating. There are 53.8 million shares outstanding (S criteria) which can contribute to greater price volatility in the event of institutional buying or selling.
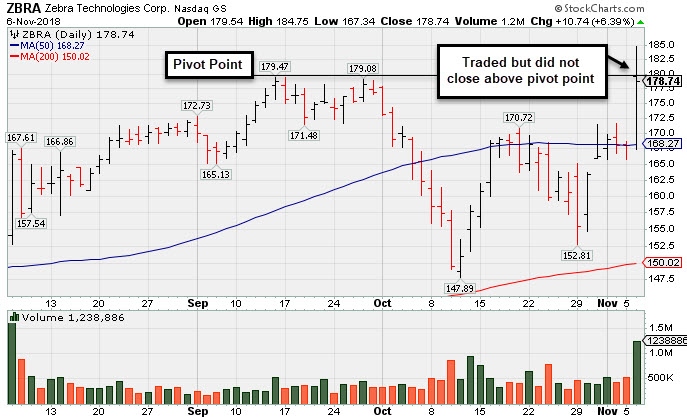
Hit New High Following Another Strong Earnings Increase - Tuesday, November 6, 2018
Zebra Tech Corp Cl A (ZBRA +$10.74 or +6.39% to $178.74) was highlighted in yellow with new pivot point cited based on its 9/14/18 high plus 10 cents. Volume and volatility often increase near earnings news. It reported Sep '18 earnings +54% on +17% sales revenues, continuing its strong earnings track record. A new high was hit with today's volume-driven gain, but it failed to finish above the pivot point to trigger a convincing technical buy signal. Confirming volume-driven gains for the stock would be a reassuring sign, however, concerns also remain until a follow-through day confirms a new market rally (M criteria). It faces no resistance due to overhead supply. It found support in recent weeks after a pullback near its 200 DMA line.
Fundamentals remain strong. The past 3 quarters showed earnings increases above the +25% minimum guideline (C criteria). Recent sequential comparisons show encouraging sales revenues acceleration. Annual earnings (A criteria) history has been strong since a downturn in FY '08 and '09.
ZBRA was last shown in this FSU section on 10/23/18 with an annotated graph under the headline, "Zebra Tech Sputtering Near 50-Day Moving Average". It was highlighted in yellow with pivot point cited based on its 6/08/18 high plus 10 cents in the 8/07/18 mid-day report (read here).
The number of top-rated funds owning its shares from 553 in Sep '17 to 694 in Sep '18, a reassuring sign concerning the I criteria. Its current Up/Down Volume Ratio of 1.1 is an unbiased indication its shares have been under slight accumulation over the past 50 days. It has earned an A Timeliness Rating and a B Sponsorship Rating. There are 53.7 million shares outstanding (S criteria) which can contribute to greater price volatility in the event of institutional buying or selling.
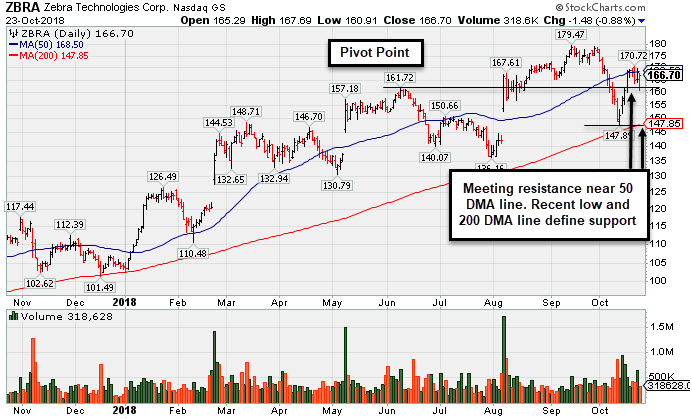
Zebra Tech Sputtering Near 50-Day Moving Average - Tuesday, October 23, 2018
Zebra Tech Corp Cl A (ZBRA -$1.48 or -0.88% to $166.70) is consolidating near its 50-day moving average (DMA) line ($168.50). The recent low ($147.89 on 10/11/18) defines near term support along with its 200 DMA line. It faces very little near-term resistance due to overhead supply up to $179.
Fundamentals remain strong. Its next earnings report is due on 11/05/18. Volume and volatility often increase near earnings news. Recently it reported Jun '18 earnings +64% on +13% sales revenues. Three of the past 4 quarters showed earnings increases above the +25% minimum guideline (C criteria). Recent sequential comparisons show encouraging sales revenues acceleration. Annual earnings (A criteria) history has been strong since a downturn in FY '08 and '09.
ZBRA found support near its 200 DMA line after enduring damaging distributional pressure since last shown in this FSU section on 9/24/18 with an annotated graph under the headline, "Hovering Near All-Time High With Strong Fundamentals". It was highlighted in yellow with pivot point cited based on its 6/08/18 high plus 10 cents in the 8/07/18 mid-day report (read here). It gapped up hitting a new all-time high with a big gain backed by +337% above average volume.
The number of top-rated funds owning its shares from 553 in Sep '17 to 692 in Sep '18, a reassuring sign concerning the I criteria. Its current Up/Down Volume Ratio of 1.4 is an unbiased indication its shares have been under accumulation over the past 50 days. It has earned an A Timeliness Rating and a B Sponsorship Rating. There are 53.7 million shares outstanding (S criteria) which can contribute to greater price volatility in the event of institutional buying or selling.
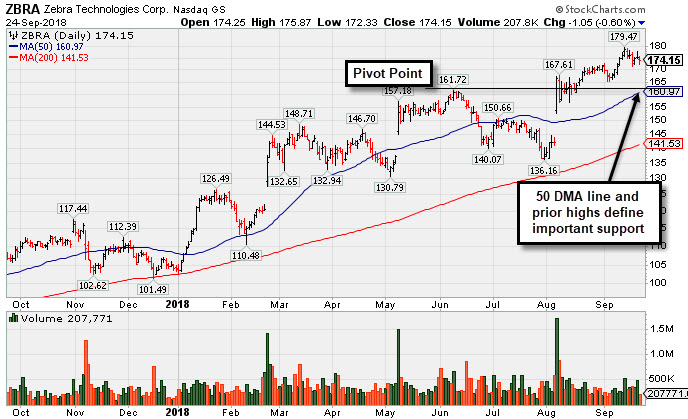
Hovering Near All-Time High With Strong Fundamentals - Monday, September 24, 2018
Zebra Tech Corp Cl A (ZBRA -$1.05 or -0.60% to $174.15) is hovering near its all-time high. The prior high in the $161 area defines support coinciding with its 50-day moving average (DMA) line. Fundamentals remain strong.
ZBRA was last shown in this FSU section on 8/07/18 with an annotated graph under the headline, "Big Gain for New High Backed by Heavy Volume". It was highlighted in yellow with pivot point cited based on its 6/08/18 high plus 10 cents in the earlier mid-day report (read here). It gapped up hitting a new all-time high with a big gain backed by +337% above average volume, rebounding from below its 50-day moving average (DMA) line.
Recently it reported Jun '18 earnings +64% on +13% sales revenues. Three of the past 4 quarters showed earnings increases above the +25% minimum guideline (C criteria). Recent sequential comparisons show encouraging sales revenues acceleration. Annual earnings (A criteria) history has been strong since a downturn in FY '08 and '09.
The number of top-rated funds owning its shares from 553 in Sep '17 to 677 in Jun '18, a reassuring sign concerning the I criteria. Its current Up/Down Volume Ratio of 1.8 is an unbiased indication its shares have been under accumulation over the past 50 days. has earned an A Timeliness Rating and a B Sponsorship Rating. There are 53.7 million shares outstanding (S criteria) which can contribute to greater price volatility in the event of institutional buying or selling.
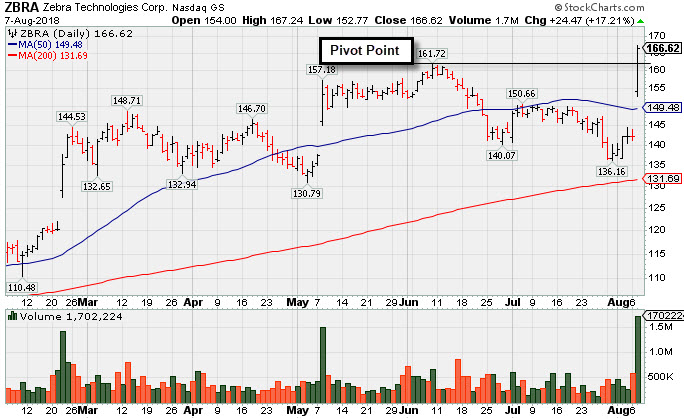
Big Gain for New High Backed by Heavy Volume - Tuesday, August 7, 2018
Zebra Tech Corp Cl A (ZBRA ) was highlighted in yellow with pivot point cited based on its 6/08/18 high plus 10 cents in the earlier mid-day report (read here). It gapped up today hitting a new all-time high with a big gain backed by +337% above average volume, rebounding from below its 50-day moving average (DMA) line.
Recently it reported Jun '18 earnings +64% on +13% sales revenues. Three of the past 4 quarters showed earnings increases above the +25% minimum guideline (C criteria). Recent sequential comparisons show encouraging sales revenues acceleration. Annual earnings (A criteria) history has been strong since a downturn in FY '08 and '09.
The number of top-rated funds owning its shares from 553 in Sep '17 to 635 in Jun '18, a reassuring sign concerning the I criteria. It has earned a B Timeliness Rating and a B Sponsorship Rating. There are 53.4 million shares outstanding (S criteria) which can contribute to greater price volatility in the event of institutional buying or selling.