Relative Strength Rating Fell While Sputtering Below 50 DMA Line - Thursday, December 23, 2021
Workday Inc Cl A (WDAY +$0.17 or +0.06% to $278.05) has seen its Relative Strength Rating slump to 73, below the 80+ minimum guideline for buy candidates while recently sputtering just below its 50-day moving average (DMA) line ($281.70). A rebound above the 50 DMA line and improvement in that RS rank is needed for its outlook to improve. The prior low ($258.22 on 12/06/21) and 200 DMA line ($253.70) define the next important support to watch.
It has a 93 Earnings Per Share Rating as fundamentals remain strong. WDAY reported Oct '21 quarterly earnings +28% on +20% sales revenues versus the year ago period, its 6th consecutive quarterly comparison well above the +25% minimum guideline (C criteria). Its annual earnings (A criteria) history has also been strong and steady. It has a Timeliness Rating of C and Sponsorship Rating of B.
WDAY was highlighted in yellow with pivot point cited based on its 2/16/21 high plus 10 cents in the 9/07/21 mid-day report (read here). It was shown in detail with an annotated graph on 11/16/21 under the headline, "Getting Extended From Previously Noted Base".
WDAY hails from the Computer Software-Enterprise group which is ranked 115th on the 197 Industry Groups list (L criteria). There are 191.1 million shares in the public float (S criteria). The number of top-rated funds owning its shares rose from 1,560 in Sep '20 to 1,833 in Sep '21, a reassuring sign concerning the I criteria. Its current Up/Down Volume Ratio of 1.2 is an unbiased indication its shares have been under slight accumulation over the past 50 days.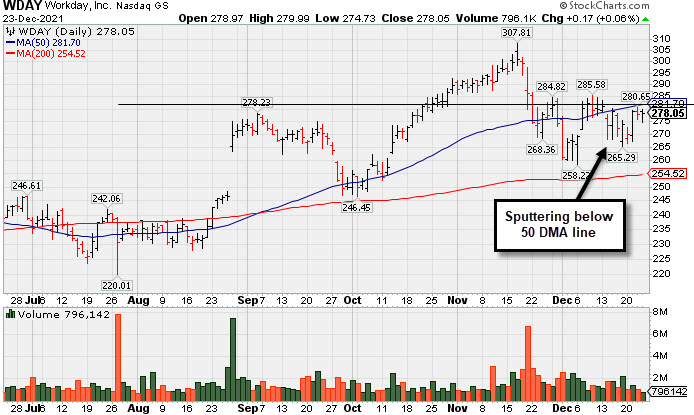
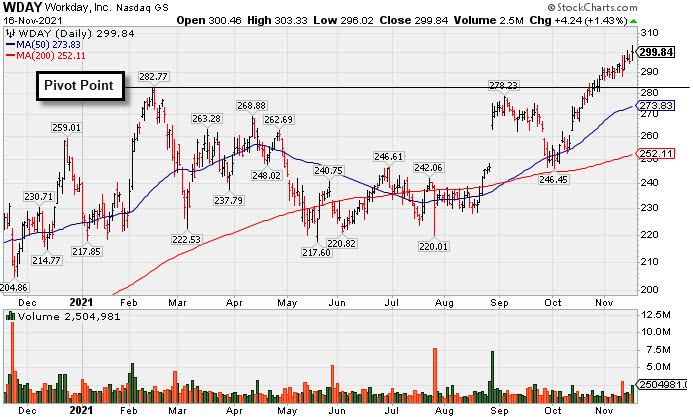
Getting Extended From Previously Noted Base - Tuesday, November 16, 2021
Workday Inc Cl A (WDAY+$4.24 or +1.43% to $299.84) rose above its "max buy" level getting extended from the previously noted base and its color code was changed to green. Its prior highs in the $282-278 area define near-term support above its 50-day moving average (DMA) line ($273.83) where any violations would raise concerns.
Fundamentals remain strong. WDAY was highlighted in yellow with pivot point cited based on its 2/16/21 high plus 10 cents in the 9/07/21 mid-day report (read here). It was shown in detail with an annotated graph on 10/13/21 under the headline, "Rebounding From 50-Day Moving Average Toward Prior Highs". It has a 96 Earnings Per Share Rating. It reported Jul '21 quarterly earnings +46% on +19% sales revenues versus the year ago period, its 5th consecutive quarterly comparison well above the +25% minimum guideline (C criteria). Its annual earnings (A criteria) history has also been strong and steady. It has a Timeliness Rating of A and Sponsorship Rating of B.
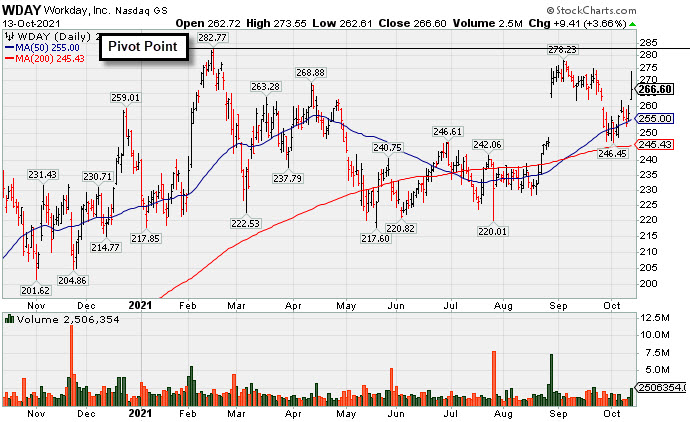
Rebounding From 50-Day Moving Average Toward Prior Highs - Wednesday, October 13, 2021
Workday Inc Cl A (WDAY +$9.41 or +3.66% to $266.60) gapped up today, but encountered pressure and ended near the middle of its intra-day range after larger early gains. Its 50-day moving average (DMA) line ($255).and recent lows ($246) define near-term support to watch where violations would raise concerns. It still faces a little resistance due to overhead supply up to the $278 level. Subsequent gains above the pivot point backed by at least +40% above average volume may trigger a technical buy signal.
Fundamentals remain strong. WDAY was highlighted in yellow with pivot point cited based on its 2/16/21 high plus 10 cents in the 9/07/21 mid-day report (read here). It was shown in detail with an annotated graph that evening under the headline "Gap Up and Recent Gains Challenge All-Time High".
It has a 94 Earnings Per Share Rating. It reported Jul '21 quarterly earnings +46% on +19% sales revenues versus the year ago period, its 5th consecutive quarterly comparison well above the +25% minimum guideline (C criteria). Its annual earnings (A criteria) history has also been strong and steady. It has a Timeliness Rating of A and Sponsorship Rating of B.
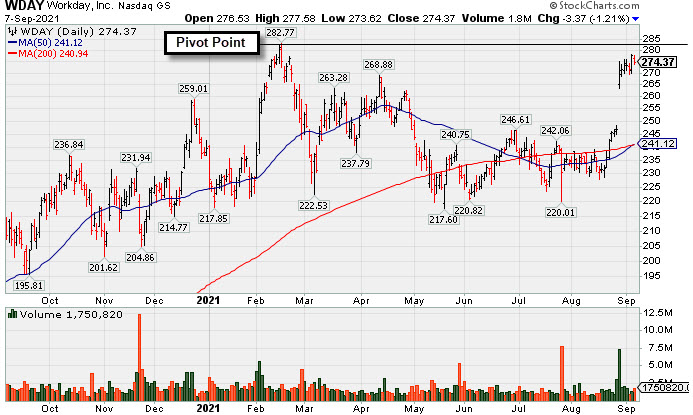
Gap Up and Recent Gains Challenge All-Time High - Tuesday, September 7, 2021
Workday Inc Cl A (WDAY -$3.37 or -1.21% to $274.37) was highlighted in yellow with pivot point cited based on its 2/16/21 high plus 10 cents in the earlier mid-day report (read here). It is perched within striking distance of its 52-week high after a big gap up 8/27/21 and additional volume-driven gains. Subsequent gains above the pivot point backed by at least +40% above average volume may trigger a technical buy signal.
It has a 94 Earnings Per Share Rating. It reported Jul '21 quarterly earnings +46% on +19% sales revenues versus the year ago period, its 5th consecutive quarterly comparison well above the +25% minimum guideline (C criteria). Its annual earnings (A criteria) history has also been strong and steady. It has a Timeliness Rating of A and Sponsorship Rating of B.