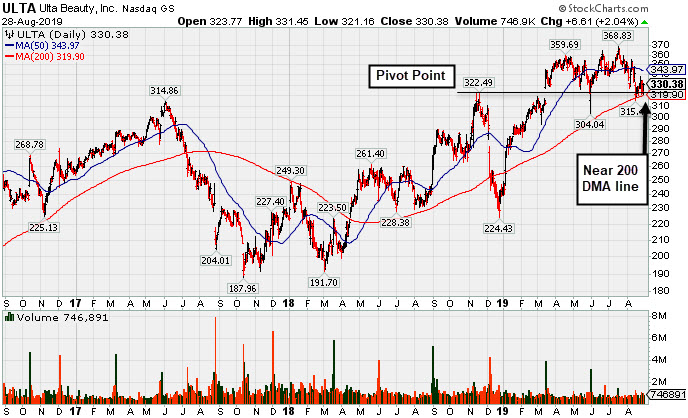
Slumped Near 200-Day Average Ahead of Earnings Report - Wednesday, August 28, 2019
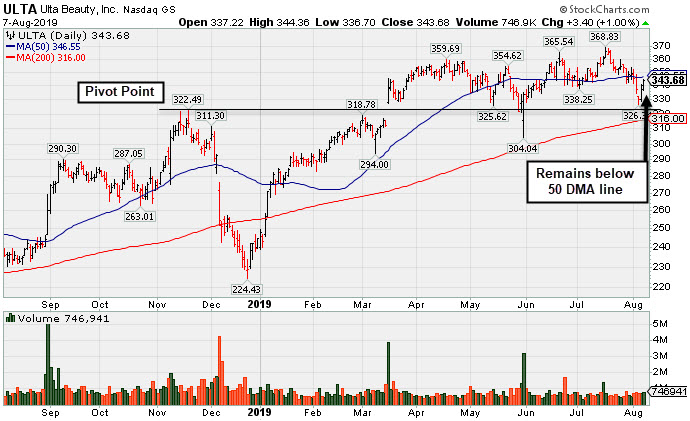
Ulta Beauty Sputtering Below 50-Day Moving Average -
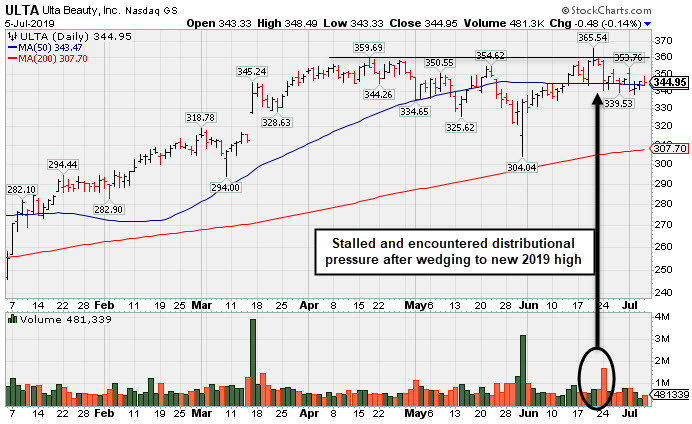
Stalled After Recently Wedging to New Record High - Friday, July 5, 2019
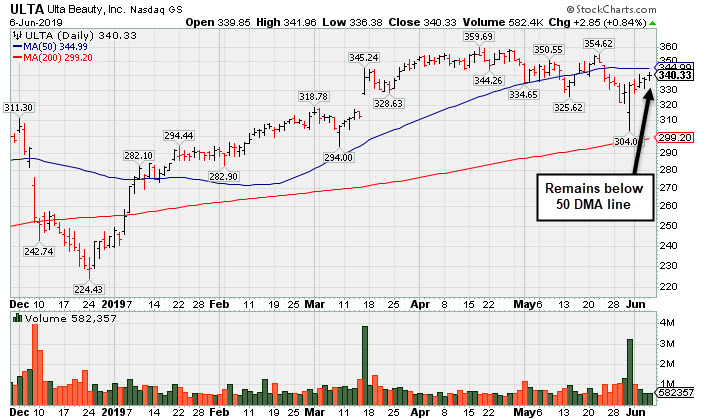
Sputtering Below 50-Day Moving Average Following Sub Par Earnings - Thursday, June 6, 2019
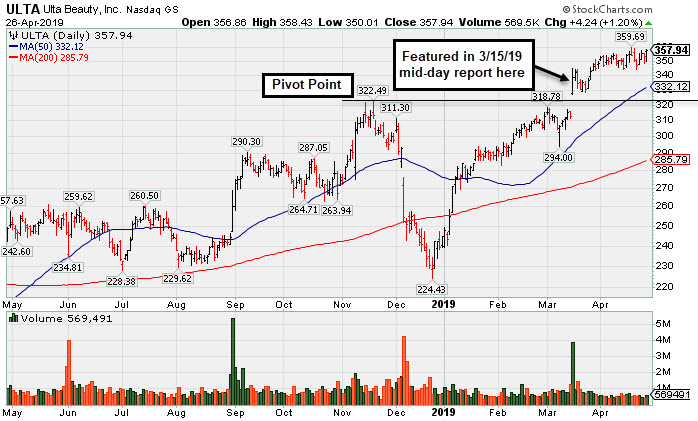
Volume Totals Cooling in Recent Weeks While Hovering Near High - Friday, April 26, 2019
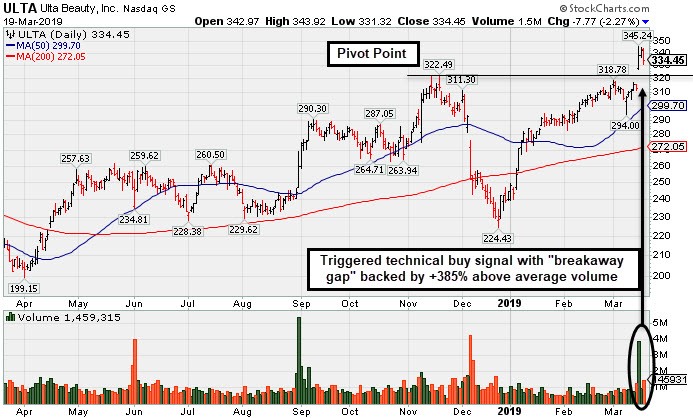
Consolidating Following Big "Breakaway Gap" - Tuesday, March 19, 2019
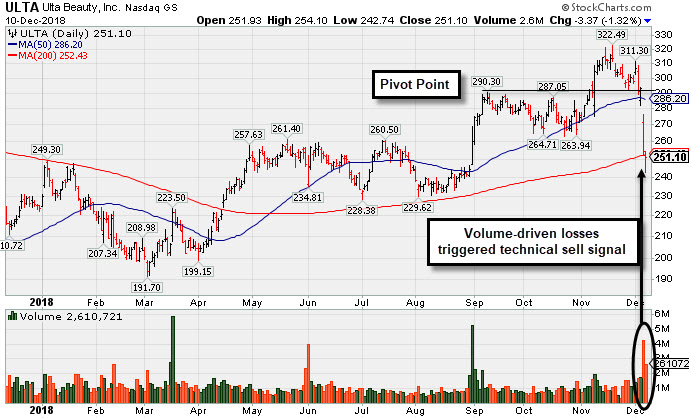
Damaging Technical Action Following Latest Strong Earnings Report - Monday, December 10, 2018
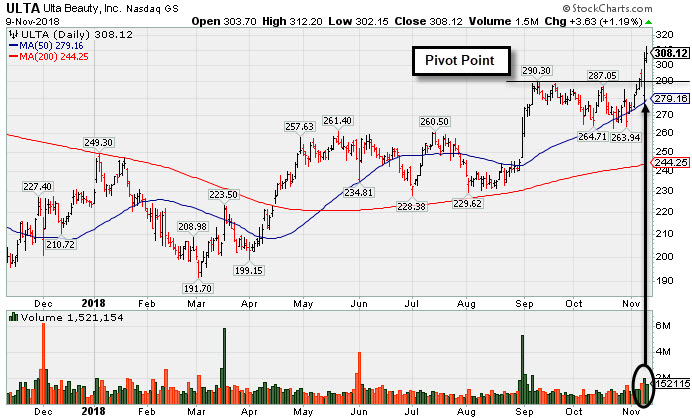
Volume Driven Gains Indicate Institutional Buying Demand - Friday, November 9, 2018
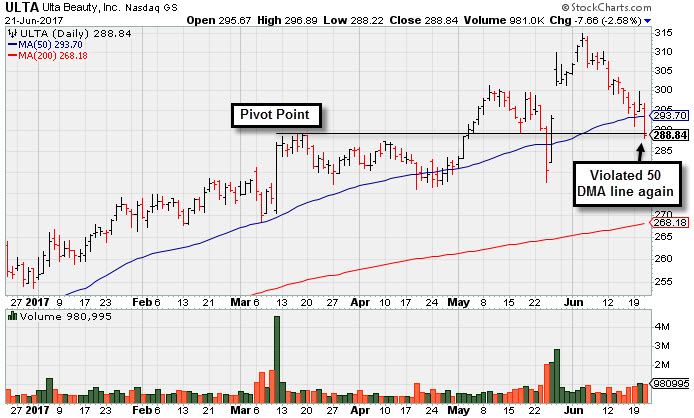
Violation of 50-Day Moving Average and Slumping Relative Strength -
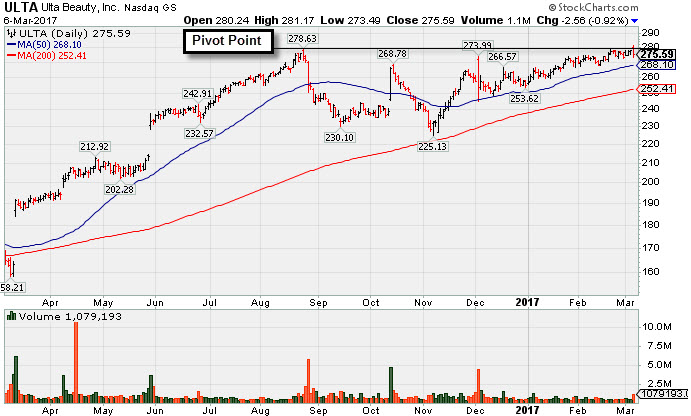
Bullish action came after it reported Jan '17 quarterly earnings +33% on +25% sales revenues. Its prior earnings history satisfies the C and A criteria. ULTA reported earnings +27%, +39%, +24%, and +26% in the Jan, Apr, Jul, and Oct '16 quarterly comparisons, respectively. Its strong earnings were underpinned by steady sales revenues increases in the +21-22% range during that span of time. Its solid annual earnings (A criteria) history is very reassuring.
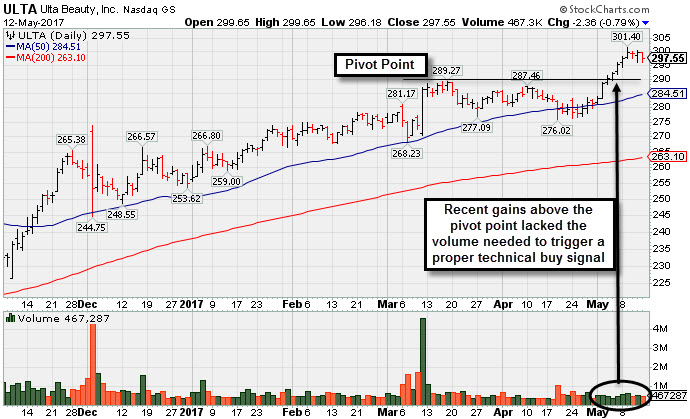
Holding Ground After Recent Gains Lacking Great Volume - Friday, May 12, 2017
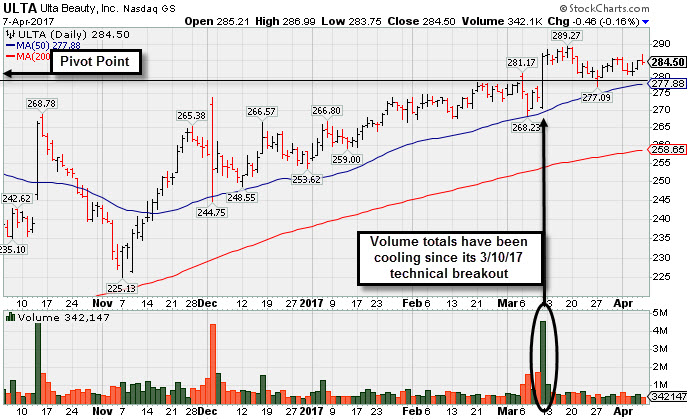
Prior highs near the $289 area define important support above its 50 DMA line ($284.51). Subsequent losses leading to violations would raise concerns and trigger technical sell signals.
Bullish action came after it reported Jan '17 quarterly earnings +33% on +25% sales revenues. Its prior earnings history satisfies the C and A criteria.
Volume Totals Cooling Following Technical Breakout - Friday, April 7, 2017
Earnings News Due as Good Looking Candidate Hovers Near Highs - Monday, March 6, 2017
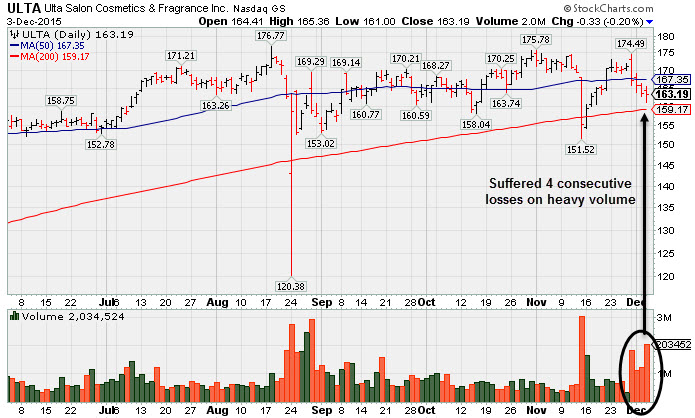
Streak of Volume Driven Losses Raising Concern - Thursday, December 3, 2015
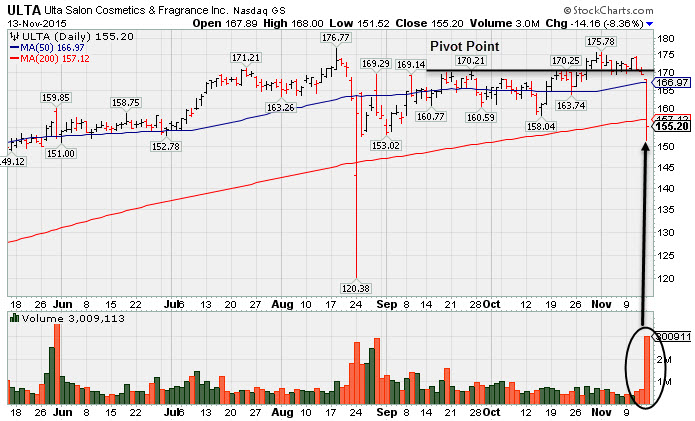
Gains on Light Volume Before Decisive Drop on Heavy Volume - Friday, November 13, 2015
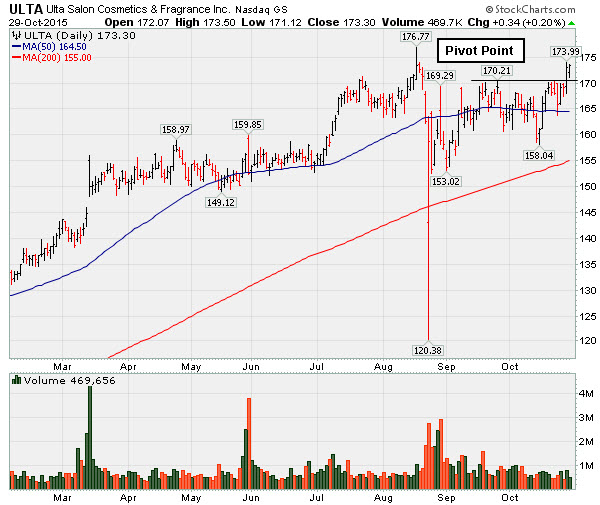
Recent Gains Lacked Volume Indicative of Institutional Buying Demand - Thursday, October 29, 2015
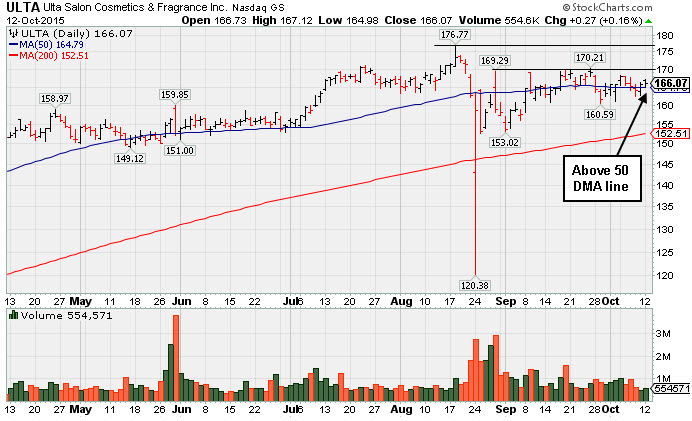
Consolidating Above 50-Day Moving Average Line - Monday, October 12, 2015
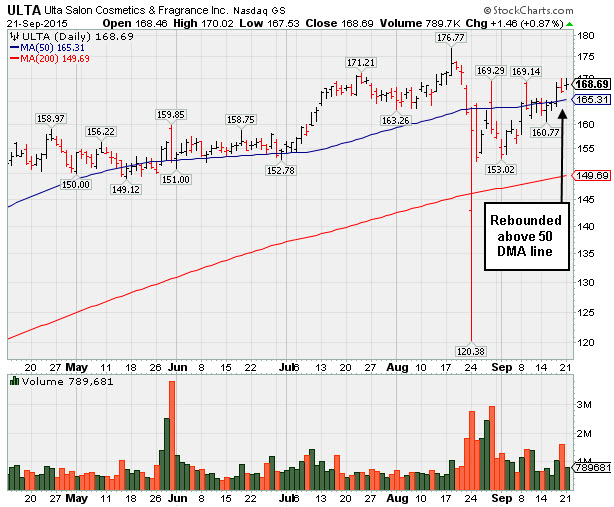
Consolidating Above 50-Day Moving Average Line - Monday, September 21, 2015
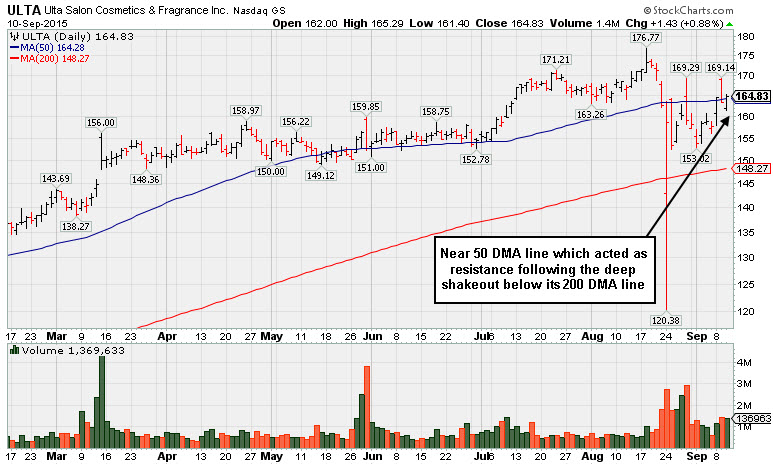
Rebound Near 50-Day Moving Average Following Deep Shakeout - Thursday, September 10, 2015
Ulta Salon Cosmetics & Fragrance, Inc. (ULTA +$1.43 or +0.88% to $164.83) is trading near its 50-day moving average (DMA) line following an impressive rebound indicative of institutional support. That important short-term average has acted as resistance after a deep shakeout below its 200 DMA line. It has not formed a sound base pattern. It also reported earnings +22% on +19^ sales revenues for the Jul '15 quarter, below the +25% minimum earnings guideline (C criteria), raising fundamental concerns.
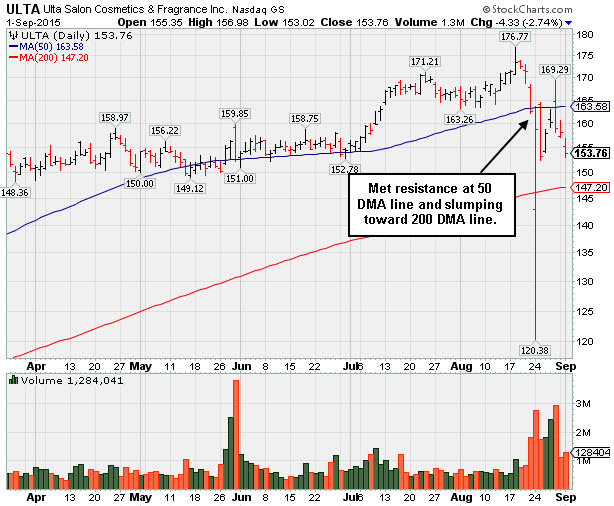
Needs Rebound Above 50-Day Average For Outlook to Improve - Tuesday, September 1, 2015
Ulta Salon Cosmetics & Fragrance, Inc. (ULTA -$4.33 or -2.74% to $153.76) found prompt support after undercutting its 200-day moving average (DMA) line on 8/24/15 amid broad market (M criteria) weakness, however it is slumping back toward that important long-term average. It met resistance at its 50 DMA line ($163.58) in the interim. A rebound above the 50 DMA line is needed for its outlook to improve.
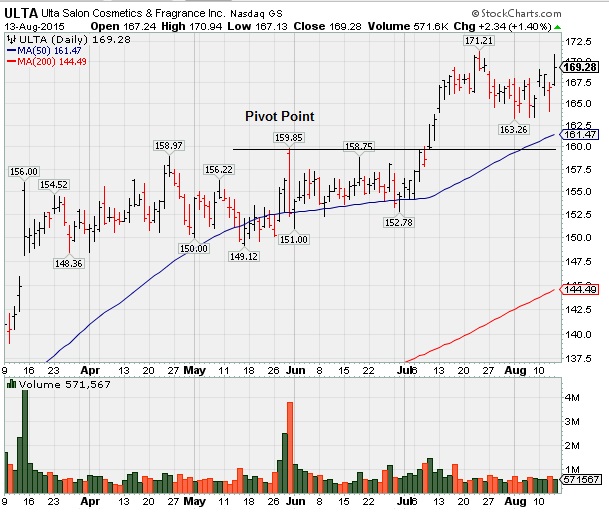
Recent Gains Have Still Lacked Substantial Volume Conviction - Thursday, August 13, 2015
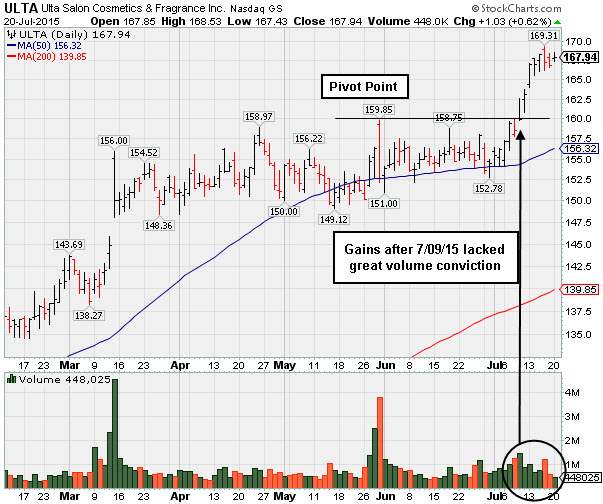
Near "Max Buy" Level, But Recent Gains Lacked Great Volume Conviction - Monday, July 20, 2015
Still Consolidating Above 50-Day Moving Average Line - Monday, June 22, 2015
Charts courtesy www.stockcharts.com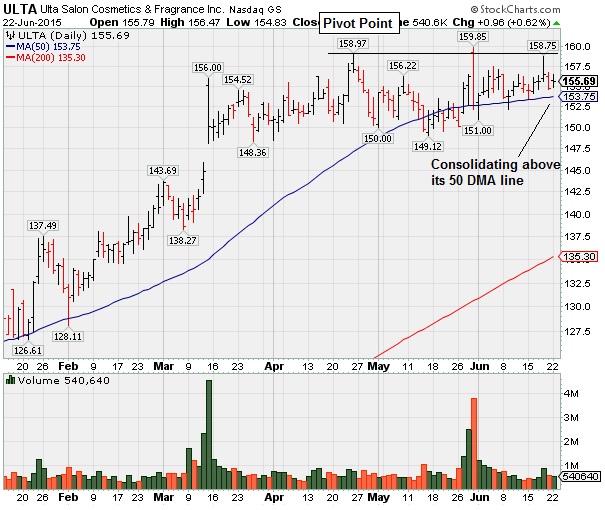
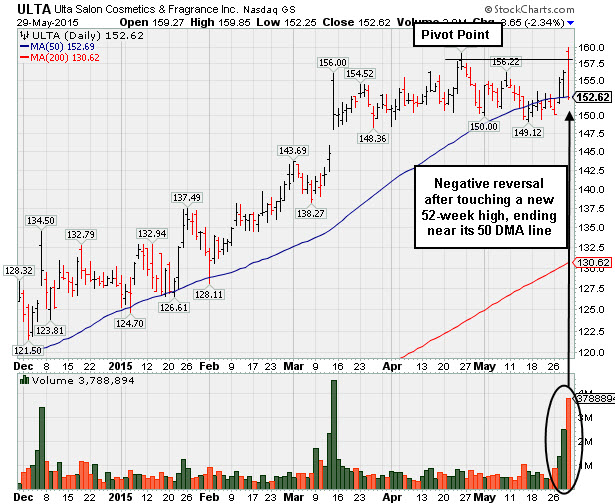
Negative Reversal Today After Touching New Highs - Friday, May 29, 2015
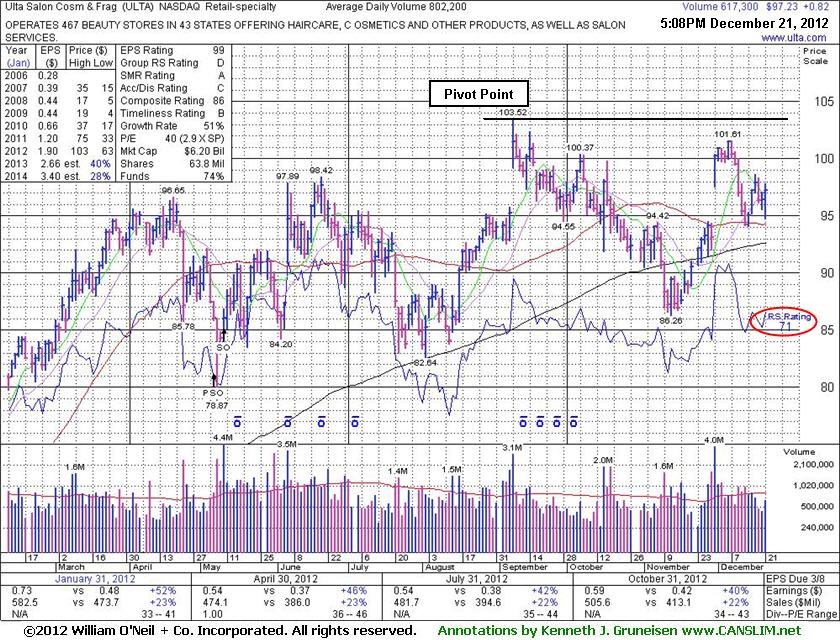
Relative Strength Rating Sub Par For Buy Candidates After Retreat - Friday, December 21, 2012
Ulta Salon Cosmetics & Fragrance, Inc. (ULTA +$0.82 or +0.85% to $97.23) is consolidating above its 50-day moving average (DMA) line which recently acted as support. Subsequent deterioration below its 50 DMA or 200 DMA line would raise more serious concerns and trigger technical sell signals. Its Relative Strength rating has slumped below the 80+ minimum guideline for buy candidates to a 71 (see red circle), down from an 83 rating when last shown in this FSU section on 12/04/12 with an annotated graph under the headline, "Recent Resilience and Strength Creates New Set-Up". Subsequent volume-driven gains failed to materialize to lift it above the new pivot point cited based on its 9/07/12 high plus 10 cents after highlighted in yellow in the 12/04/12 mid-day report (read here). Prior reports cautioned members - "Disciplined investors will watch for volume-driven gains above the pivot point to trigger a new technical buy signal, as it could spend a lot more time basing. Meanwhile, other stocks that have broken out but are not too extended from sound bases could be better choices to consider." Resistance still remains due to overhead supply up through the $101-103 range.
ULTA reported earnings +40% on +22% sales for the Oct '12 quarter. Its strong quarterly earnings increases above the +25% guideline in the 10 latest comparisons satisfies the C criteria, and its solid annual earnings (A criteria) history is also very reassuring. The number of top-rated funds with an ownership interest has grown from 515 funds in Dec '11 to 618 funds as of Sep '12, which is a very encouraging sign of increasing institutional interest (the I criteria). Based on weak action it was dropped from the Featured Stocks list on 11/08/12, yet it had rebounded impressively after the recent consolidation undercut its 200 DMA line. It gapped up above its 50-day moving average (DMA) line on 11/30/12, and the rebound above its 50 DMA line helped its technical stance improve.
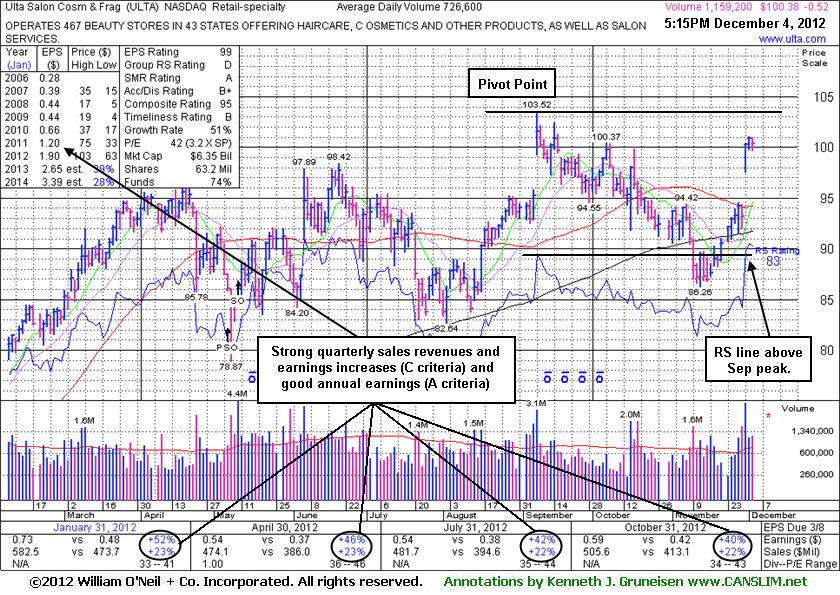
Recent Resilience and Strength Creates New Set-Up - Tuesday, December 04, 2012
Ulta Salon Cosmetics & Fragrance, Inc. (ULTA -$0.52 or -0.52% to $100.38) was highlighted in yellow with new pivot point based on its 9/07/12 high plus 10 cents in the earlier mid-day report (read here). Disciplined investors will watch for volume-driven gains above the pivot point to trigger a new technical buy signal, as it could spend a lot more time basing. Meanwhile, other stocks that have broken out but are not too extended from sound bases could be better choices to consider.
ULTA reported earnings +40% on +22% sales for the Oct '12 quarter. Its strong quarterly earnings increases above the +25% guideline in the 10 latest comparisons satisfies the C criteria, and its solid annual earnings (A criteria) history is also very reassuring. The number of top-rated funds with an ownership interest has grown from 515 funds in Dec '11 to 606 funds as of Sep '12, which is a very encouraging sign of increasing institutional interest (the I criteria).
It sputtered after last shown in this FSU section on 11/05/12 with an annotated graph under the headline, "Relative Strength Rating Has Slipped Under Minimum Guideline". Based on weak action it was dropped from the Featured Stocks list on 11/08/12, yet it has rebounded impressively after the recent consolidation undercut its 200 DMA line. Now it faces very little resistance due to overhead supply in the $100-103 range.
It gapped up above its 50-day moving average (DMA) line on 11/30/12, and the rebound above that important short-term average quickly helped its technical stance improve. Meanwhile, its Relative Strength Rating has improved to 83, above the 80+ minimum guideline for buy candidates under the fact-based investment system. I
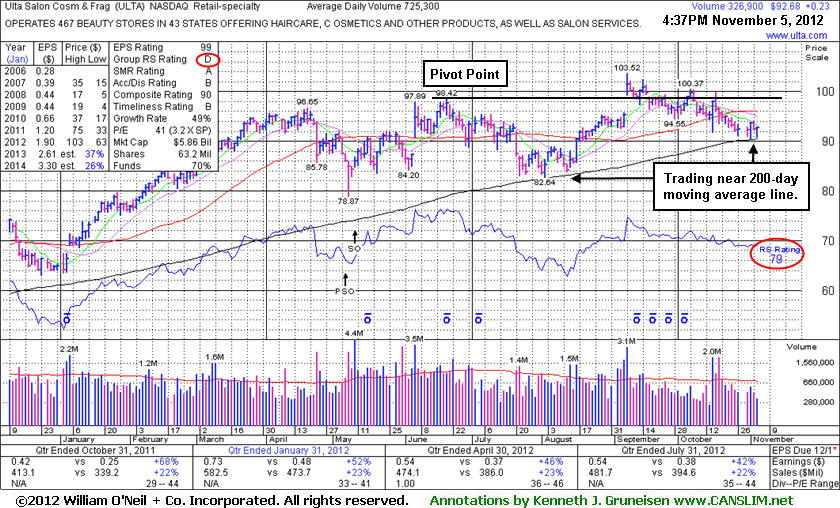
Relative Strength Rating Has Slipped Under Minimum Guideline - Monday, November 05, 2012
Ulta Salon Cosmetics & Fragrance, Inc. (ULTA +$0.23 or +0.25% to $92.68) is still sputtering below its 50-day moving average (DMA) line, and a rebound above that important short-term average is needed for its outlook to improve. Its 200 DMA line ($90.46 now) defines near-term support to watch. Meanwhile, its Relative Strength Rating (see red circles) has slumped to 79, just below the 80+ minimum guideline for buy candidates under the fact-based investment system, and the Group RS Rating fell from C to a D since it was last shown in this FSU section on 10/05/12 with an annotated graph under the headline, "Relative Strength Line Did Not Provide Confirmation". That review illustrated how its RS line (the jagged blue line) was plotted higher earlier this year while we observed - "Big market winners the fact-based investment system has identified in the past more often saw their Relative Strength lines lead the way into new high territory first, before the stock's price technically broke into new high territory. In this case, it is fair to say that the stock's RS line did not confirm the move into new high territory. For now, that gives investors a reason to be cautious until more convincing signs of fresh institutional accumulation emerge. Disciplined investors always limit losses if ever any stock falls -7% or more from their purchase price."Following its bullish gap up on 9/07/12 it stalled. It reported earnings +42% on +22% sales revenues for the quarter ended July 30, 2012 versus the year ago period. Its strong quarterly earnings increases above the +25% guideline in the 9 latest comparisons satisfies the C criteria, and its solid annual earnings (A criteria) history is also very reassuring. The number of top-rated funds with an ownership interest has grown from 376 funds in Dec '10 to 587 funds as of Sep '12, which is a very encouraging sign of increasing institutional interest (the I criteria).
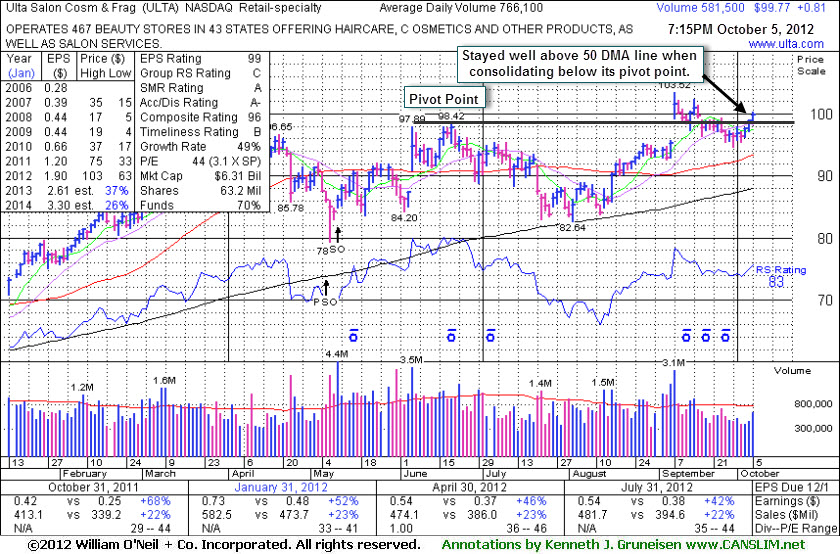
Relative Strength Line Did Not Provide Confirmation - Friday, October 05, 2012
Ulta Salon Cosmetics & Fragrance, Inc. (ULTA +$0.82 or +0.82% to $99.77) stayed well above its 50-day moving average (DMA) line while consolidating and it traded back above its previously cited pivot point today. Volume totals have been cooling and below average in recent weeks following its 9/07/12 breakaway gap. That is a sign that few investors have been anxious to exit. However, its Relative Strength line (the jagged blue line by RS Rating 83) was plotted higher earlier this year. Big market winners the fact-based investment system has identified in the past more often saw their Relative Strength lines lead the way into new high territory first, before the stock's price technically broke into new high territory. In this case, it is fair to say that the stock's RS line did not confirm the move into new high territory. For now, that gives investors a reason to be cautious until more convincing signs of fresh institutional accumulation emerge. Disciplined investors always limit losses if ever any stock falls -7% or more from their purchase price.
It was last shown in this FSU section on 9/04/12 with an annotated graph under the headline, "Earnings News Pending While Perched Near New Pivot Point". That report cautioned members - "Keep in mind that it is due to report earnings on Thursday, September 6th after the market closes, and volume and volatility often increase near earnings news." Following its bullish gap up on 9/07/12 it stalled. It reported earnings +42% on +22% sales revenues for the quarter ended July 30, 2012 versus the year ago period. Its strong quarterly earnings increases above the +25% guideline in the 9 latest comparisons satisfies the C criteria, and its solid annual earnings (A criteria) history is also very reassuring.
The number of top-rated funds with an ownership interest has grown from 376 funds in Dec '10 to 571 funds as of Jun '12, which is a very encouraging sign of increasing institutional interest (the I criteria). Its current Up/Down Volume ratio of 1.6 is an unbiased indication that its shares have been under accumulation over the past 50 days.
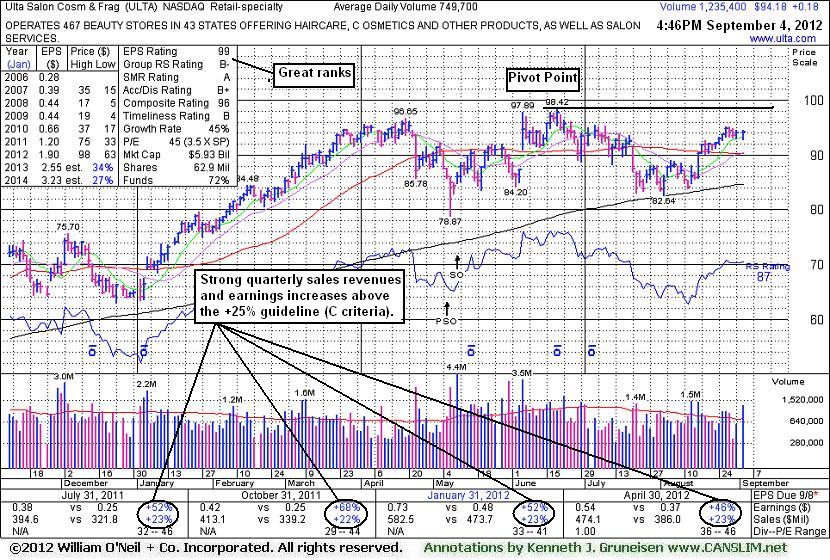
Earnings News Pending While Perched Near New Pivot Point - Tuesday, September 04, 2012
Often, when a leading stock is setting up to breakout of a solid base it is highlighted in CANSLIM.net's Mid-Day Breakouts Report. The most relevant factors are noted in the report which alerts prudent CANSLIM oriented investors to place the issue in their watch list. After doing any necessary backup research, the investor is prepared to act after the stock triggers a technical buy signal (breaks above its pivot point on more than +50% average turnover) but before it gets too extended from a sound base. In the event the stock fails to trigger a technical buy signal and its price declines then it will simply be removed from the watch list. Disciplined investors know to buy as near as possible to the pivot point and avoid chasing stocks after they have rallied more than +5% above their pivot point. It is crucial to always limit losses whenever any stock heads the wrong direction, and disciplined investors sell if a struggling stock ever falls more than -7% from their purchase price.Ulta Salon Cosmetics & Fragrance, Inc. (ULTA +$0.18 or +0.19% to $94.18) was highlighted in yellow in the earlier mid-day report (read here) while building on the current 11-week base during which it found support at its 200-day moving average (DMA) line. The new pivot point cited is based on its 6/20/12 high plus 10 cents. Little resistance remains due to overhead supply while consolidating -4.3% off its 52-week high, however volume-driven gains above its pivot point are needed to trigger a technical buy signal. Disciplined investors know that there is no advantage to getting in "early". Waiting for proof of fresh institutional buying demand is crucial to investors' success with the fact-based investment system. Keep in mind that it is due to report earnings on Thursday, September 6th after the market closes, and volume and volatility often increase near earnings news.
The high-ranked Retail - Specialty firm completed a Secondary Offering on 5/10/12. Its last appearance in the FSU section on 4/23/12 included an annotated weekly graph under the headline, "New Late Stage Base Formed; Deteriorating Market Conditions". The choppy consolidation that followed included a brief rally to new highs and then a slump to its 200 DMA line before rebounding. It reported earnings +46% on +23% sales revenues for the quarter ended April 30, 2012 versus the year ago period. Its strong quarterly earnings increases above the +25% guideline in the 8 latest comparisons satisfies the C criteria, and its solid annual earnings (A criteria) history is also very reassuring. The number of top-rated funds with an ownership interest has grown from 376 funds in Dec '10 to 561 funds as of Jun '12, which is a very encouraging sign of increasing institutional interest (the I criteria).
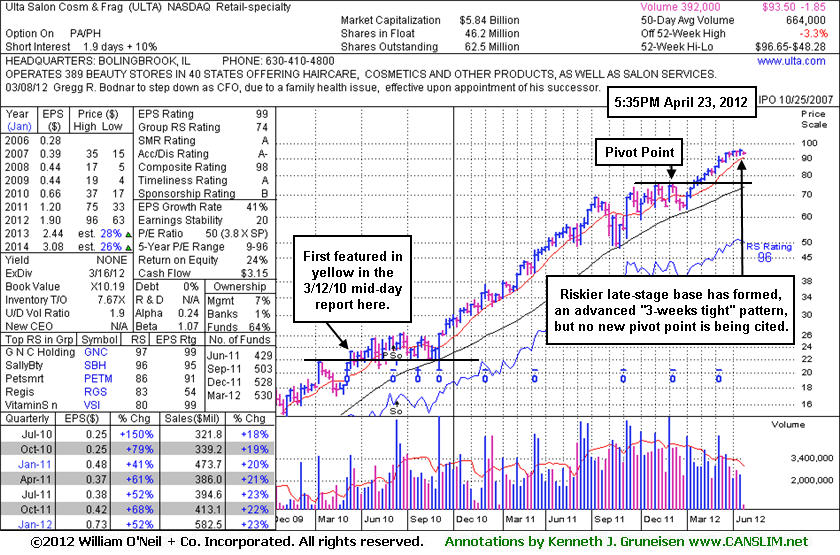
New Late Stage Base Formed; Deteriorating Market Conditions - Monday, April 23, 2012
Ulta Salon Cosmetics & Fragrance, Inc. (ULTA -$1.82 or -1.91% to $93.53) has been consolidating in a tight range near its all-time high. It may go on to produce more climactic gains. Recent notes suggested that it may be considered a riskier late-stage base, an advanced "3-weeks tight" pattern, but no new pivot point has been cited. Its 50-day moving average (DMA) line ($89.52 now) defines support to watch well above its prior highs in the $75 area. Keep in mind that the M criteria argues that 3 out of 4 stocks generally tend to follow along with the direction of the major averages. Recently the market has been encountering damaging distributional pressure while leadership (stocks hitting new 52-week highs) has been waning.
Its last appearance in the FSU section on 2/28/12 included an annotated graph under the headline, "Salon Firm Quietly Consolidating; Possibly Forming Advanced Base". It did not pause there, but continued higher, and it has not spent much time basing since its last "Featured Date" when a pivot point of $75.70 was highlighted in yellow on 1/11/12.
Its strong quarterly earnings increases above the +25% guideline in the 8 latest comparisons satisfies the C criteria, and its solid annual earnings (A criteria) history is also very reassuring. The number of top-rated funds with an ownership interest has grown from 376 funds in Dec '10 to 530 funds as of Mar '12, which is a very encouraging sign of increasing institutional interest (the I criteria).
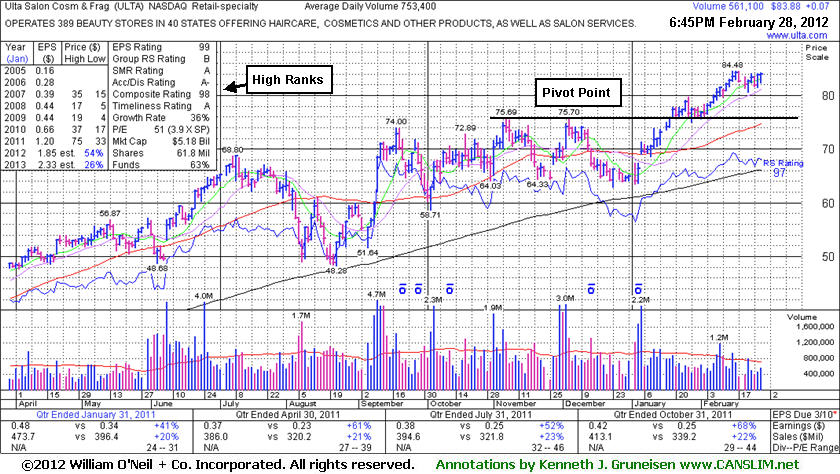
Salon Firm Quietly Consolidating; Possibly Forming Advanced Base - Tuesday, February 28, 2012
Ulta Salon Cosmetics & Fragrance, Inc. (ULTA +$0.07 or +0.08% to $83.88) posted a small gain today with light volume. It has been quietly hovering near its all-time high, extended from any sound base pattern, yet it may go on to produce more climactic gains. Prior highs near $75 define initial chart support above its 50-day moving average (DMA) line. It returned to the Featured Stocks list as it was highlighted in yellow in the 1/11/12 mid-day report (read here), and an annotated graph was included that evening in the FSU section under the headline, "Recent Rally Above 50-Day Average Improved Technical Stance." It then wedged to new high territory without great volume conviction until it had already gotten extended from the prior sound base.
It is too early to say, but it may now be on its way to forming an advanced "3-weeks tight" type base from which volume-driven gains might be considered a secondary or add-on buy point. That advanced base pattern requires 3 very tight closes on a stock's weekly chart. Time will tell, and future notes will key on whether or not it finishes the week near the prior 2 weekly closes.
Its strong quarterly earnings increases above the +25% guideline in the 8 latest comparisons satisfies the C criteria, and its solid annual earnings (A criteria) history is also very reassuring. The number of top-rated funds with an ownership interest has grown from 376 funds in Dec '10 to 523 funds as of Dec '11, which is a very encouraging sign of increasing institutional interest (the I criteria).
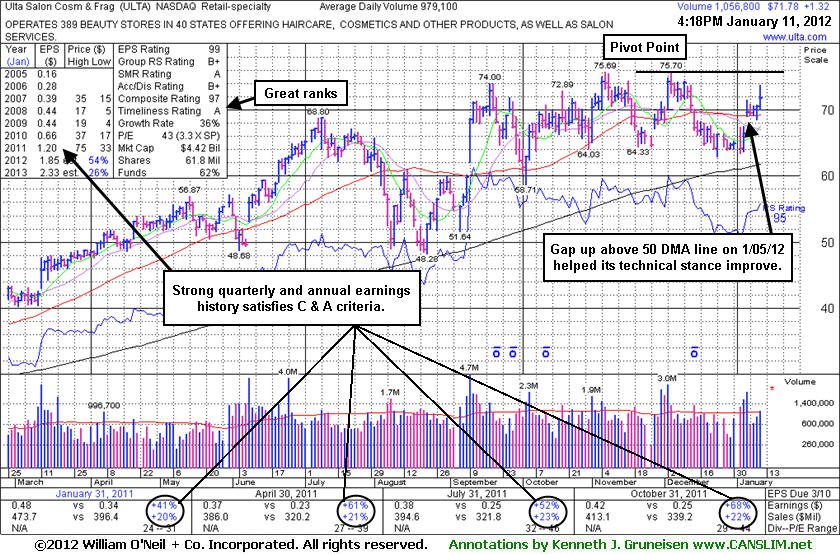
Recent Rally Above 50-Day Average Improved Technical Stance - Wednesday, January 11, 2012
Ulta Salon Cosmetics & Fragrance, Inc. (ULTA +$1.32 or +1.87% to $71.78) returned to the Featured Stocks list and was highlighted in yellow in the earlier mid-day report (read here). A gap up above its 50-day moving average (DMA) line on 1/05/12 helped its technical stance improve. A new pivot point was cited based on its 52-week high plus 10 cents while building on a riskier late-stage base. Disciplined investors would watch for a convincing breakout to provide confirmation that fresh institutional accumulation is driving it higher. Prior lows near $64 define important chart support above its 200 DMA line.Its last appearance in this FSU section was on 12/02/11 with analysis and an annotated graph under the headline, "Late Stage Set-Up For Previous Big Gainer." After making little progress and then slumping below its 50 DMA and below prior chart lows ULTA was dropped from the Featured Stocks list on 12/22/11.
Its strong quarterly earnings increases above the +25% guideline in the 8 latest comparisons satisfies the C criteria, and its solid annual earnings (A criteria) history is also very reassuring. The number of top-rated funds with an ownership interest has grown from 376 funds in Dec '10 to 508 funds as of Dec '11 which is an encouraging sign of increasing institutional interest (the I criteria).
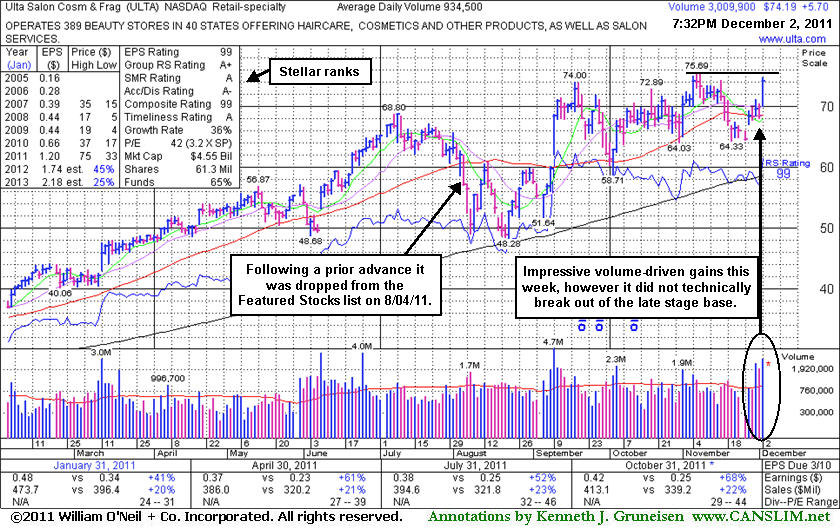
Late Stage Set-Up For Previous Big Gainer - Friday, December 02, 2011
Ulta Salon Cosmetics & Fragrance, Inc. (ULTA +$5.70 or +8.32% to $74.19) gapped up today was highlighted in yellow in the mid-day report with a pivot point based on its 52-week high plus ten cents. It rallied within close striking distance of a new 52-week high. The recent volume-driven gains are impressive, but it did not trigger a new technical buy signal. No resistance remains due to overhead supply and it may be working on a late-stage "square box" type base pattern. Recent lows in the $64 area define near term support below its 50 DMA line.
Its fundamentals (C and A criteria) remain strong. Its last appearance in this FSU section was on 8/04/11 with analysis and an annotated graph under the headline, "Profit Should Be Protected After Featured Stock Produced Great Gains." The damaging loss on 8/04/11 violated its 50-day moving average (DMA) line, raising concerns and triggering a technical sell signal. It was be dropped from the Featured Stocks list. Since first featured in yellow in the 3/12/10 mid-day report, in just over 16 months it had traded up as much as +200%.
The number of top-rated funds with an ownership interest has grown from 376 funds in Dec '10 to 504 funds as of Sep '11 which is an encouraging sign of increasing institutional interest (the I criteria). Management's reported 7% ownership stake is down considerably after the latest offering and since last noted. Its strong quarterly earnings increases above the +25% guideline in the 8 latest comparisons satisfies the C criteria, and its solid annual earnings (A criteria) history is also very reassuring.
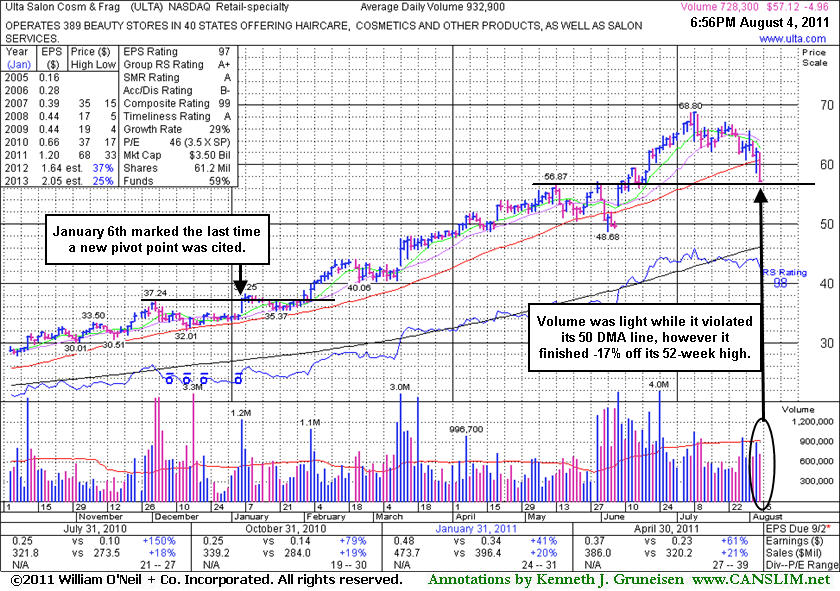
Profit Should Be Protected After Featured Stock Produced Great Gains - Thursday, August 04, 2011
Ulta Salon Cosmetics & Fragrance, Inc. (ULTA -$4.96 or -7.99% to $57.12) closed near the session low today with a loss on below average volume. The damaging loss violated its 50-day moving average (DMA) line, raising concerns and triggering a technical sell signal. It will be dropped from the Featured Stocks list tonight. Typically after any Featured Stock has slumped -16% or more off its high it is dropped from the Featured Stocks list because technical damage has occurred. If a subsequent base forms they may be featured again in the future with a new pivot point cited. Its last appearance in this FSU section was on 7/14/11 with analysis and an annotated graph under the headline, "Quietly Pulling Back, But Extended From Any Sound Base".
Since first featured in yellow in the 3/12/10 mid-day report at $22.81 and (read here) and in a more detailed Stock Bulletin later that afternoon under the headline "Strong Earnings Increases Help Leader Meet Key Criteria", in just over 16 months it traded up as much as +200%. Its choppy ascent did not allow a sound base to be noted since the last time a pivot point was cited when it was rallying on January 6, 2011. Recent highs that were a resistance level may act as support, however the overwhelmingly negative market (M criteria) is an urgent call for investors to protect profits rather than ride it out. The number of top-rated funds with an ownership interest has grown from 274 funds in Mar '10 to 472 funds as of Jun '11 which is an encouraging sign of increasing institutional interest (the I criteria). Management's 25% ownership stake (after the latest offering) still keeps the company's directors very motivated to look after and build shareholder value. Its strong quarterly earnings increases above the +25% guideline in the 8 latest comparisons satisfies the C criteria, and its solid annual earnings (A criteria) history is also very reassuring.
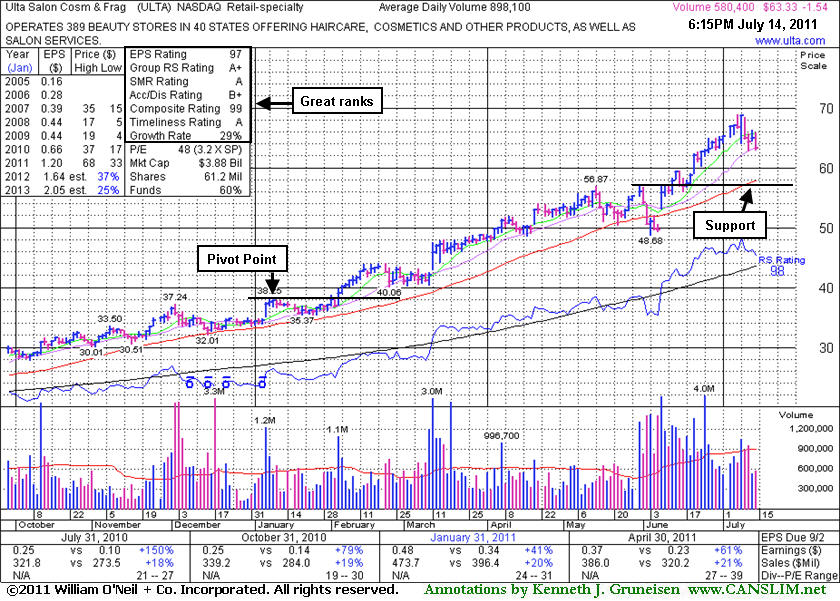
Quietly Pulling Back, But Extended From Any Sound Base - Thursday, July 14, 2011
Ulta Salon Cosmetics & Fragrance, Inc. (ULTA -$1.54 or -2.37% to $63.33) is quietly pulling back from its all-time high this week. It is extended from any sound base pattern and well above its 50-day moving average (DMA) line. Any subsequent violation would raise more serious concerns and trigger more worrisome sell signals. Meanwhile, it may produce more climactic gains, but disciplined investors avoid chasing extended stocks. Since its last appearance in this FSU section on 6/20/11 with analysis and an annotated graph under the headline, "Following Choppy Consolidation New Base Not Yet Formed", it stubbornly held its ground and rallied to new all-time highs.
Prior reports noted - "Disciplined investors may watch for another sound base to possibly be formed and noted." It has been repeatedly noted as extended from any sound base, having steadily climbed, hardly pausing for any sufficient new base to form since its breakout early this year cleared the last pivot point cited. Since first featured in yellow in the 3/12/10 mid-day report at $22.81 and (read here) and in a more detailed Stock Bulletin later that afternoon under the headline "Strong Earnings Increases Help Leader Meet Key Criteria", in just over 16 months it has traded up as much as +200%. The number of top-rated funds with an ownership interest has grown from 274 funds in Mar '10 to 475 funds as of Mar '11 which is an encouraging sign of increasing institutional interest (the I criteria). Management's 25% ownership stake (after the latest offering) still keeps the company's directors very motivated to look after and build shareholder value. Its strong quarterly earnings increases above the +25% guideline in the 7 latest comparisons satisfies the C criteria, and its solid annual earnings (A criteria) history is also very reassuring.
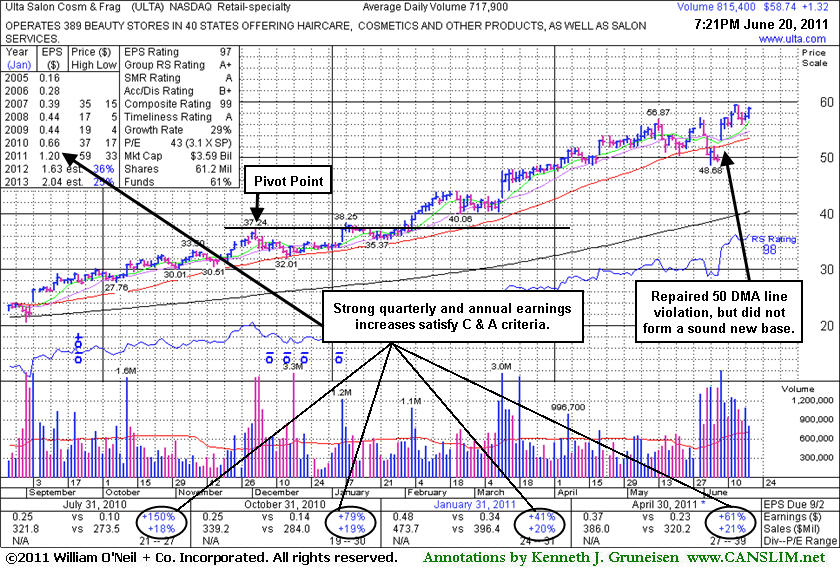
Following Choppy Consolidation New Base Not Yet Formed - Monday, June 20, 2011
Ulta Salon Cosmetics & Fragrance, Inc. (ULTA +$1.32 or +2.30% to $58.74) posted a gain today with +14% above average volume for its second-best close ever. It is perched near its all-time high, extended from any sound base pattern. Disciplined investors may watch for another sound base to possibly be formed and noted. Since its last appearance in this FSU section on 5/26/11 with analysis and an annotated graph under the headline, "Institutional Ownership Increased During Considerable Rally", it endured distributional pressure, violating its 50-day moving average (DMA) line and slumping briefly under earlier lows raising additional concerns. Its solid 6/08/11 gain with heavy volume, after gapping up, soon repaired the violation and helped its outlook, technically. Its recent low ($48.68 on 6/03/11) defines an important support level to watch now, where any subsequent violation would raise more serious concerns and trigger more worrisome sell signals.
It has been repeatedly noted as extended from any sound base, having steadily climbed, hardly pausing for any sufficient new base to form since its breakout early this year cleared the last pivot point cited. Since first featured in yellow in the 3/12/10 mid-day report at $22.81 and (read here) and in a more detailed Stock Bulletin later that afternoon under the headline "Strong Earnings Increases Help Leader Meet Key Criteria", in just over 15 months it has traded up as much as +160.4%. The number of top-rated funds with an ownership interest has grown from 274 funds in Mar '10 to 463 funds as of Mar '11 which is an encouraging sign of increasing institutional interest (the I criteria). Management's 25% ownership stake (after the latest offering) still keeps the company's directors very motivated to look after and build shareholder value. Its strong quarterly earnings increases above the +25% guideline in the 7 latest comparisons satisfies the C criteria, and its solid annual earnings (A criteria) history is also very reassuring.
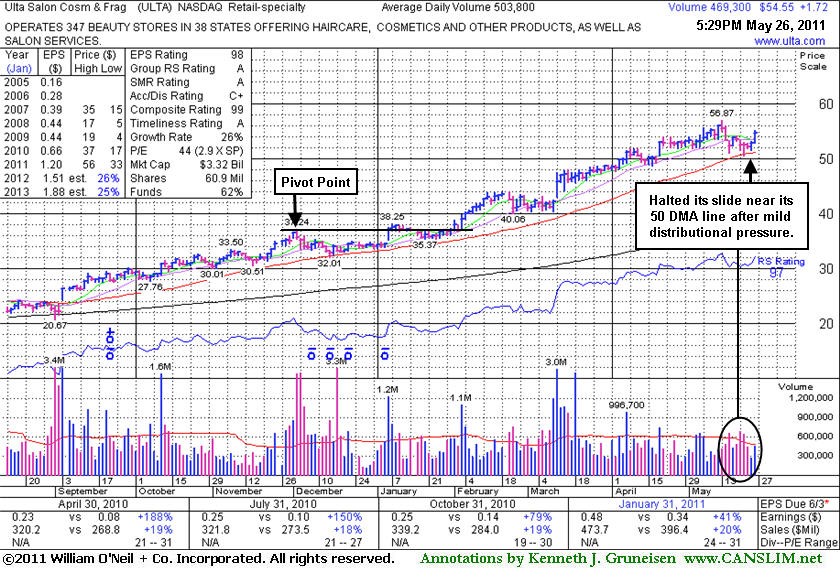
Institutional Ownership Increased During Considerable Rally - Thursday, May 26, 2011
Ulta Salon Cosmetics & Fragrance, Inc. (ULTA +$1.72 or +3.26% to $54.55) rallied within close striking distance of its all-time high today after finding support above its 50-day moving average (DMA) line this week. Since its last appearance in this FSU section on 4/28/11 with analysis and an annotated graph under the headline, "Considerable Rally For Salon Services Firm", this high-ranked Retail - Specialty firm wedged up without great volume conviction to new all-time highs. It has been noted as extended from any sound base, having steadily climbed, hardly pausing for any sufficient new base to form since its breakout early this year cleared the last pivot point cited.
On pullbacks, its 50-day moving average (DMA) line has defined chart support throughout its ongoing advance. A damaging violation may trigger a technical sell signal. Since first featured in yellow in the 3/12/10 mid-day report at $22.81 and (read here) and in a more detailed Stock Bulletin later that afternoon under the headline "Strong Earnings Increases Help Leader Meet Key Criteria", in just over 13 months it has traded up as much as +149.3%. The number of top-rated funds with an ownership interest has grown from 274 funds in Mar '10 to 460 funds as of Mar '11 which is an encouraging sign of increasing institutional interest (the I criteria). Management's 25% ownership stake (after the latest offering) still keeps the company's directors very motivated to look after and build shareholder value. Its strong quarterly earnings increases above the +25% guideline in the 7 latest comparisons (satisfies the C criteria).
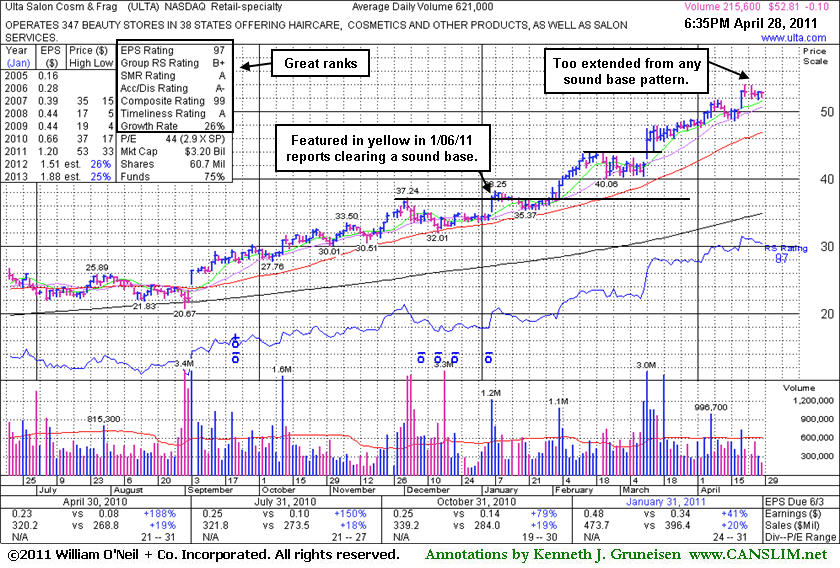
Considerable Rally For Salon Services Firm - Thursday, April 28, 2011
Ulta Salon Cosmetics & Fragrance, Inc. (ULTA -$0.10 or -0.19% to $52.81) is holding its ground stubbornly near its all-time high with volume totals cooling. It has been noted as extended from any sound base. On pullbacks, its 50-day moving average (DMA) line defines chart support to watch well above prior highs. Since its last appearance in this FSU section on 3/29/11 with analysis and an annotated graph under the headline, "Extended From Sound Base, Up +113% In Just Over One Year", it tacked on additional gains. Since first featured in yellow in the 3/12/10 mid-day report at $22.81 and (read here) and in a more detailed Stock Bulletin later that afternoon under the headline "Strong Earnings Increases Help Leader Meet Key Criteria", in just over 13 months it has traded up as much as +136.7%.
The number of top-rated funds with an ownership interest has grown from 274 funds in Mar '10 to 444 funds as of Mar '11 which is an encouraging sign of increasing institutional interest (the I criteria). Management's 36% ownership stake (after the latest offering) still keeps the company's directors very motivated to look after and build shareholder value. This high-ranked Retail - Specialty firm has strong quarterly earnings increases above the +25% guideline in the 7 latest comparisons (satisfies the C criteria).
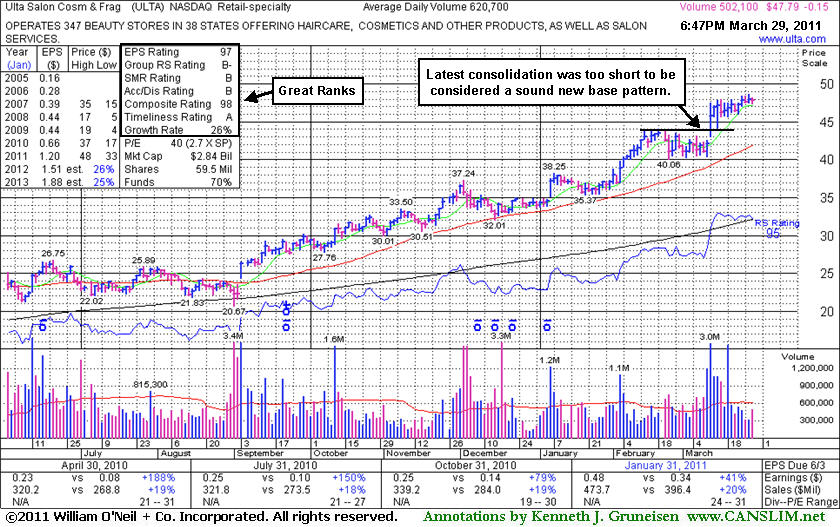
Extended From Sound Base, Up +113% In Just Over One Year - Tuesday, March 29, 2011
Ulta Salon Cosmetics & Fragrance, Inc. (ULTA -$0.15 or -0.31% to $47.79) quietly touched a new all-time high on the prior session and pulled back today. It has been stubbornly holding its ground after a spurt of volume-driven gains. Since its last appearance in this FSU section on 2/17/11 with an annotated graph and details under the headline, "Extended From Sound Base After Quiet Gains", it has not formed a sound base pattern. Disciplined investors would avoid chasing it, meanwhile it has been repeatedly noted as "extended from a sound base pattern". Initial support to watch is at recent chart highs in the $44 area, and then at its 50-day moving average (DMA) line, a classic chart support level.Since first featured in yellow in the 3/12/10 mid-day report at $22.81 and (read here) and in a more detailed Stock Bulletin later that afternoon under the headline "Strong Earnings Increases Help Leader Meet Key Criteria", it has traded up as much as +113% in just over one year.
The number of top-rated funds with an ownership interest has grown from 274 funds in Mar '10 to 422 funds as of Dec '10 which is an encouraging sign of increasing institutional interest (the I criteria). Management's 36% ownership stake (after the latest offering) still keeps the company's directors very motivated to look after and build shareholder value. This has strong quarterly earnings increases above the +25% guideline in the 7 latest comparisons (satisfies the C criteria).
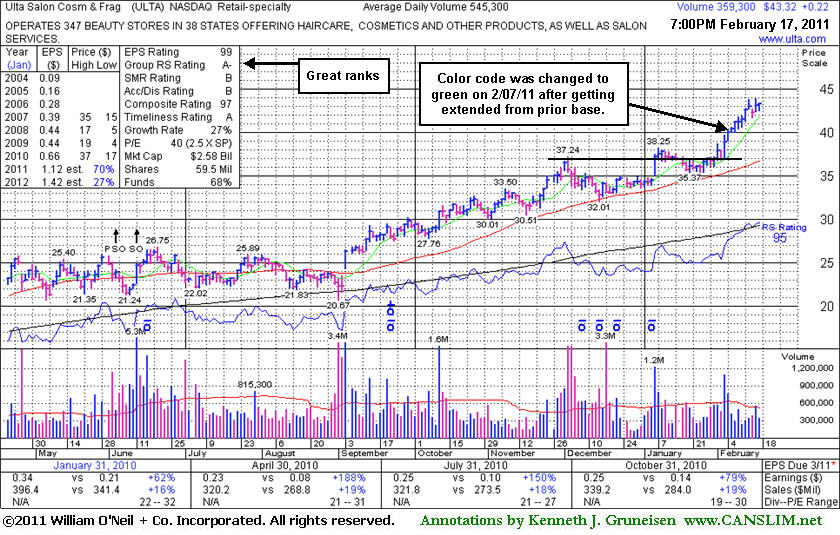
Extended From Sound Base After Quiet Gains - Thursday, February 17, 2011
Ulta Salon Cosmetics & Fragrance, Inc. (ULTA +$0.22 or +0.51% to $43.32) ended at a new all-time high close with a small gain today on average volume. It is extended from a sound base pattern, and prior highs in the $37-38 area define chart support to watch above its 50-day moving average (DMA) line. Its last appearance in this FSU section on 1/06/11 with an annotated graph under the headline "Volume Driven Gain Challenges Prior Resistance". Its color code was changed to green on 2/07/11 after getting extended.
The number of top-rated funds with an ownership interest has grown from 273 funds in Dec '09 to 397 funds as of Dec '10 which is an encouraging sign of increasing institutional interest (the I criteria). Management's 36% ownership stake (after the latest offering) still keeps the company's directors very motivated to look after and build shareholder value. This has strong quarterly earnings increases above the +25% guideline in the 6 latest comparisons (satisfies the C criteria).
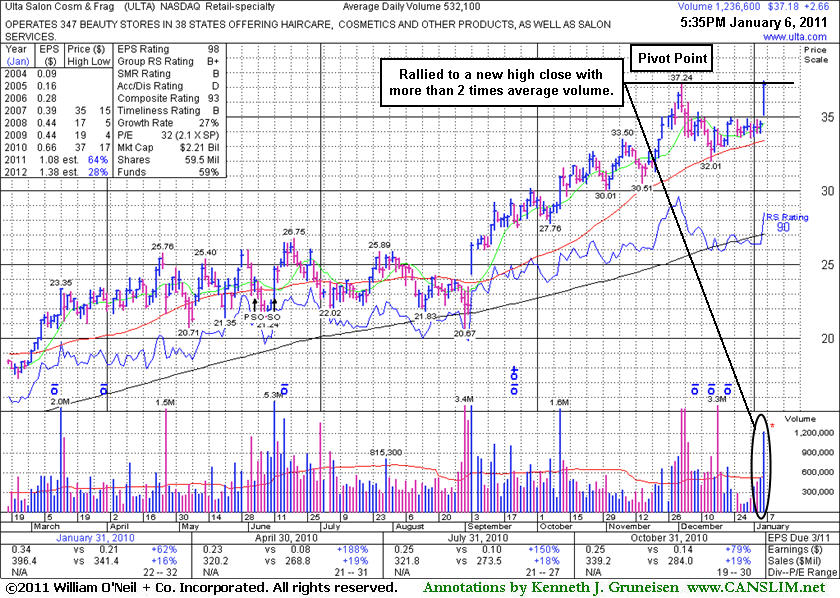
Volume Driven Gain Challenges Prior Resistance - Thursday, January 06, 2011
Ulta Salon Cosmetics & Fragrance, Inc. (ULTA +$2.66 or +7.71% to $37.18) gapped up today and touched a new 52-week high after reporting encouraging holiday sales data. Its color code was changed to yellow with new pivot point cited based on its 52-week high plus 10 cents. Disciplined investors resist the urge to get in "early" and watch for gains above the pivot point with at least +50% above average volume to trigger a new (or add-on) technical buy signal. Today's gain helped this high-ranked leader in the Retail - Specialty group rally right up to prior resistance, but confirming gains and a solid close above its pivot point would be a characteristic of a truly convincing breakout.
Since its last appearance in this FSU section on 12/22/10 with an annotated graph under the headline "Consolidating Following +43% Rally Since September Breakout" it went on consolidating in a tight range while volume totals cooled. Its 50-day moving average (DMA) acted as recent support during an orderly 6-week consolidation. The number of top-rated funds with an ownership interest has grown from 278 funds in Dec '09 to 380 funds as of Sep '10 which is an encouraging sign of increasing institutional interest (the I criteria). (NOTE: Prior notes on this and other stocks cited top-rated US funds, and now our source is including foreign funds and hedge funds in their totals reported). Management's 36% ownership stake (after the latest offering) still keeps the company's directors very motivated to look after and build shareholder value. This has strong quarterly earnings increases above the +25% guideline in the 4 latest comparisons (satisfies the C criteria). ULTA has traded up as much as +41% from $26.36 when it was featured in the 9/03/10 mid-day report (read here) and its strong close with 6 times average volume confirmed a fresh technical buy signal.
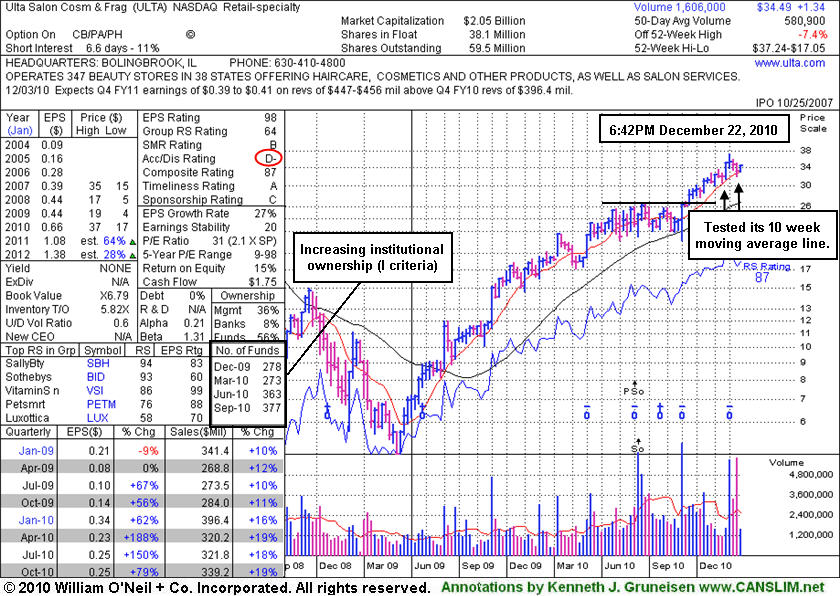
Consolidating Following +43% Rally Since September Breakout - Wednesday, December 22, 2010
Ulta Salon Cosmetics & Fragrance, Inc. (ULTA +$1.08 or +3.23% to $34.49) posted a solid gain today with above average volume, rallying up from its 50-day moving average (DMA) line - which is a classic support level chart readers always watch closely. Subsequent deterioration below it or the most recent chart low ($32.01 on 12/15/10) would raise concerns and trigger technical sell signals. Losses in recent weeks marked by heavier volume hurt its Accumulation/Distribution rating which has slumped from a B+ to a D- (see red circle) since its last appearance in this FSU section on 11/01/10 with detailed analysis and an annotated graph under the headline "Recent Lows and 50-Day Average Define Support to Watch". The number of top-rated funds with an ownership interest has grown from 278 funds in Dec '09 to 377 funds as of Sep '10 which is an encouraging sign of increasing institutional interest (the I criteria). (NOTE: Prior notes on this and other stocks cited top-rated US funds, and now our source is including foreign funds and hedge funds in their totals reported). Management's 36% ownership stake (after the latest offering) still keeps the company's directors very motivated to look after and build shareholder value.
ULTA has traded up as much as +41.27% from $26.36 when it was featured in the 9/03/10 mid-day report (read here) and its strong close with 6 times average volume confirmed a fresh technical buy signal. This high-ranked leader in the Retail - Specialty group has strong quarterly earnings increases above the +25% guideline in the 4 latest comparisons (satisfies the C criteria).
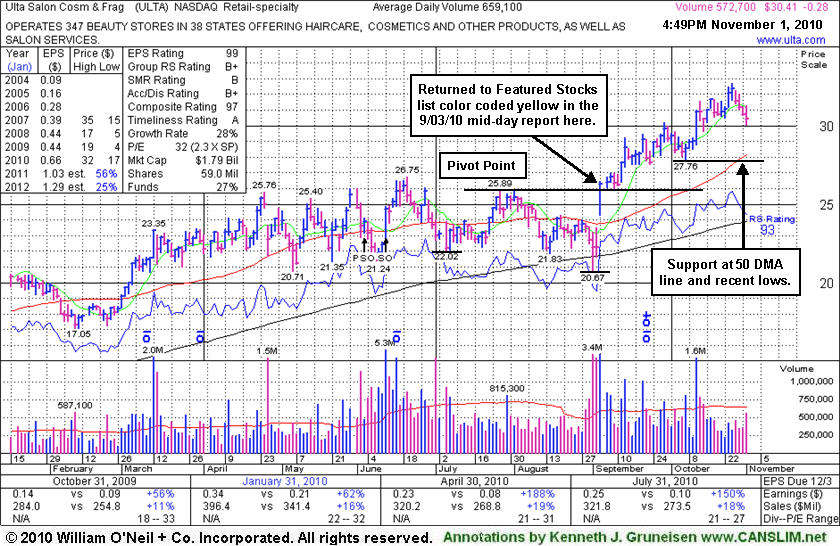
Recent Lows and 50-Day Average Define Support to Watch - Monday, November 01, 2010
Ulta Salon Cosmetics & Fragrance, Inc. (ULTA -$0.28 or -0.91% to $30.41) has no overhead supply remaining to act as resistance, but it is extended from a sound base pattern now. Its 50-day moving average (DMA) line and recent chart low defines support to watch near the $28 level.
Its color code was changed to yellow with new pivot point cited in the 9/03/10 mid-day report (read here). Its strong close with a considerable volume spike to nearly 6 times average confirmed a fresh technical buy signal. This high-ranked leader in the Retail - Specialty group has strong quarterly earnings increases above the +25% guideline in the 4 latest comparisons (satisfies the C criteria). The number of top-rated funds with an ownership interest has grown from 49 funds in March '09 to 108 funds as of Sep '10 which is an encouraging sign of increasing institutional interest (the I criteria). Management's 36% ownership stake (after the latest offering) still keeps the company's directors very motivated to look after and build shareholder value.
Earlier this year, a Stock Bulletin published on March 12, 2010 (read here) alerted members to the company with favorable characteristics based on the winning models. Based on weak action was dropped from the Featured Stocks list on 8/13/10. In the interim it found support again near its 200 DMA line and prior lows in the $21-22 area. Then returned to the Featured Stocks list again when exhibiting bullish price/volume action.
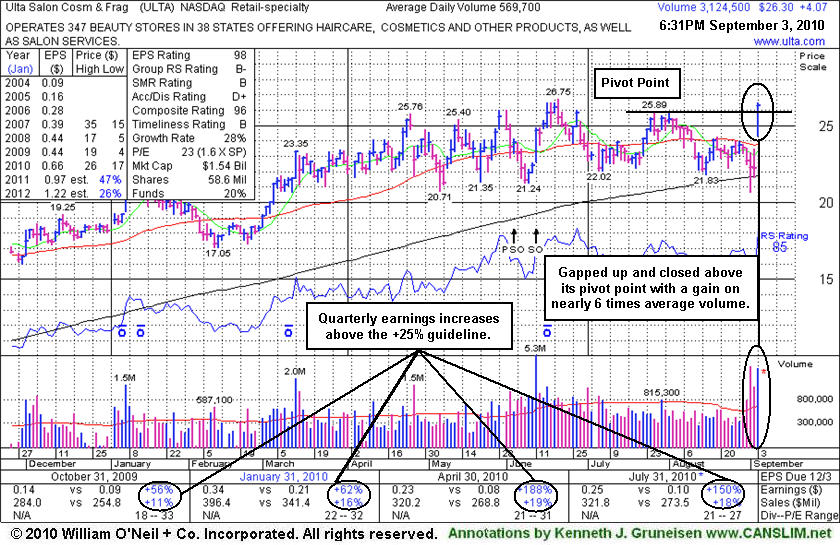
Gap Up Gain With Almost 6 Times Average Volume - Friday, September 03, 2010
Ulta Salon Cosmetics & Fragrance, Inc. (ULTA +$4.07 or +18.31% to $26.30) gapped up today, rallying above its 50-day moving average (DMA) line and nearly challenging its 52-week high. Its color code was changed to yellow with new pivot point cited in the mid-day report (read here). Based on weak action it was dropped from the Featured Stocks list on 8/13/10. In the interim it found support again near its 200 DMA line and prior lows in the $21-22 area. Its strong close today with a considerable volume spike to nearly 6 times average confirmed a fresh technical buy signal.
This high-ranked leader in the Retail - Misc group has strong quarterly earnings increases above the +25% guideline in the 4 latest comparisons (satisfies the C criteria). The number of top-rated funds with an ownership interest has grown from 49 funds in March '09 to 102 funds as of Jun '10 which is an encouraging sign of increasing institutional interest (the I criteria). Management's 36% ownership stake (after the latest offering) still keeps the company's directors very motivated to look after and build shareholder value.
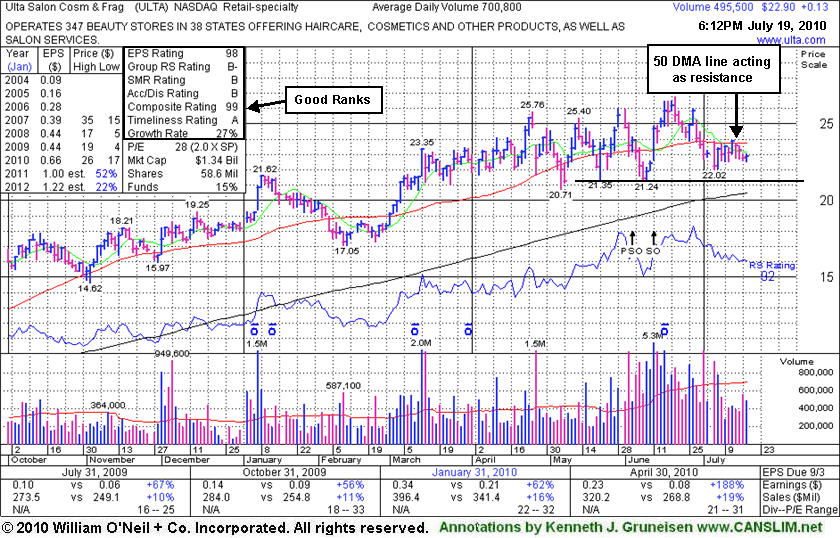
50 DMA Line Recently Acted As Resistance - Monday, July 19, 2010
Ulta Salon Cosmetics & Fragrance, Inc. (ULTA +$0.13 or +0.57% to $22.90) held its ground today after 3 consecutive losses on light volume. Its 50-day moving average (DMA) line has acted as resistance after recent distributional pressure sent it below that important short-term average. While it has been consolidating since a negative reversal from an all-time high on 6/21/10, its May - June chart lows in the $21 area define the next support level just above its 200 DMA line.
On 6/11/10 it completed a Secondary Offering which we previously noted may hinder upward price progress for the near-term. For now it remains an ideal candidate for investors' watch lists, awaiting a rebound above its 50 DMA line and confirming gains for a new high close with heavy volume for a fresh technical buy signal.
This high-ranked leader in the Retail - Misc group which has shown accelerating sales revenues increases with strong quarterly earnings increases above the +25% guideline in the 4 latest comparisons (satisfies the C criteria). The number of top-rated funds with an ownership interest has grown from 49 funds in March '09 to 81 funds as of Jun '10 which is an encouraging sign of increasing institutional interest (the I criteria). Management's 36% ownership stake (after the latest offering) still keeps the company's directors very motivated to look after and build shareholder value.
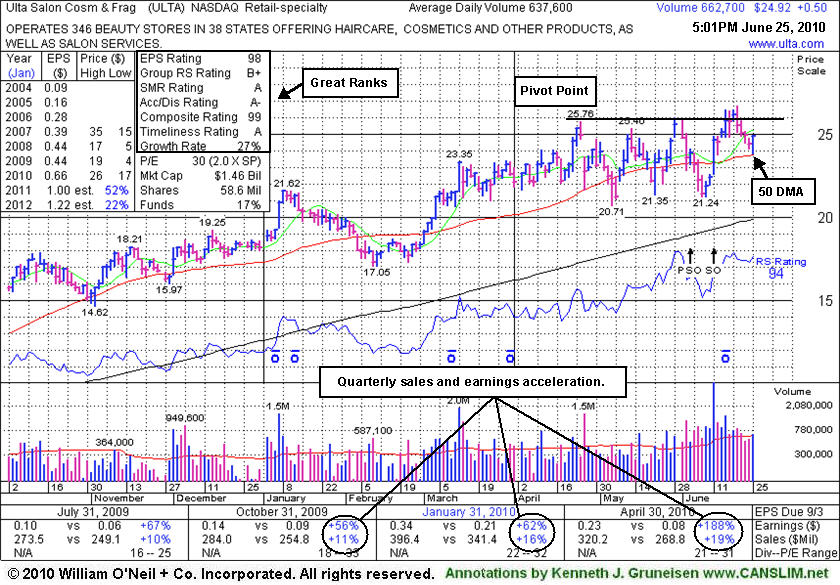
Retail - Specialty Firm Showing Resilience After Offering - Friday, June 25, 2010
Ulta Salon Cosmetics & Fragrance, Inc. (ULTA +$0.50 or +2.05% to $24.92) closed near the session high today, making a positive reversal after dipping near its 50 DMA line. It has been quietly consolidating since a negative reversal from an all-time high on 6/21/10. On 6/11/10 it completed a Secondary Offering which may hinder upward price progress for the near-term. For now it remains an ideal candidate for investors' watch lists, awaiting confirming gains for a new high close with heavy volume for a fresh technical buy signal.
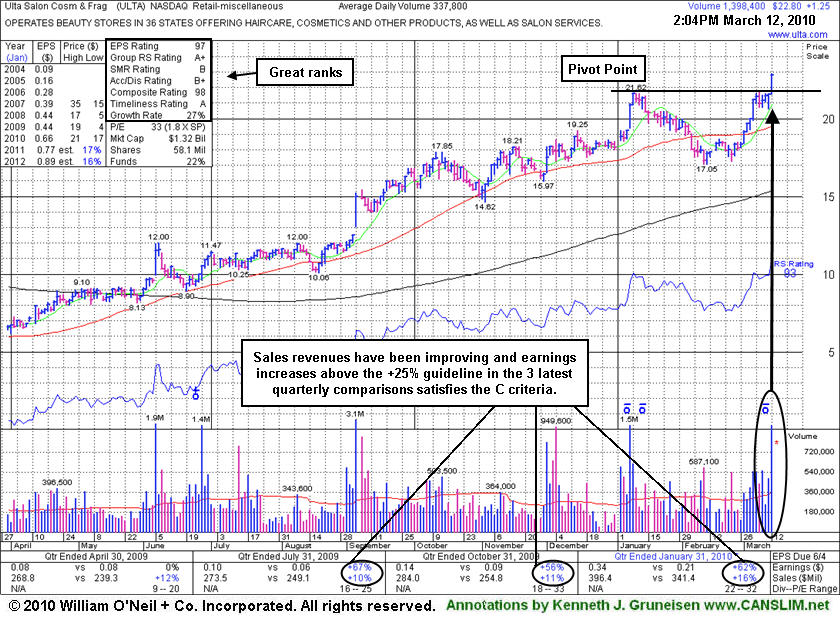
ULTA made very little headway since the detailed Stock Bulletin with annotated graph was published soon after it was featured in the 3/12/10 mid-day report (read here) as a considerable gain with heavy volume helped it reach a new 52-week high. It was then noted as it rose from an 8-week cup shaped base following stronger results for the quarter ended January 31, 2010.
This high-ranked leader in the Retail - Misc group which has shown accelerating sales revenues increases with strong quarterly earnings increases above the +25% guideline in the 3 latest comparisons (satisfies the C criteria). The number of top-rated funds with an ownership interest has grown from 49 funds in March '09 to 80 funds as of Mar '10 which is an encouraging sign of increasing institutional interest (the I criteria). Management's 36% ownership stake (after the latest offering) still keeps the company's directors very motivated to look after and build shareholder value.
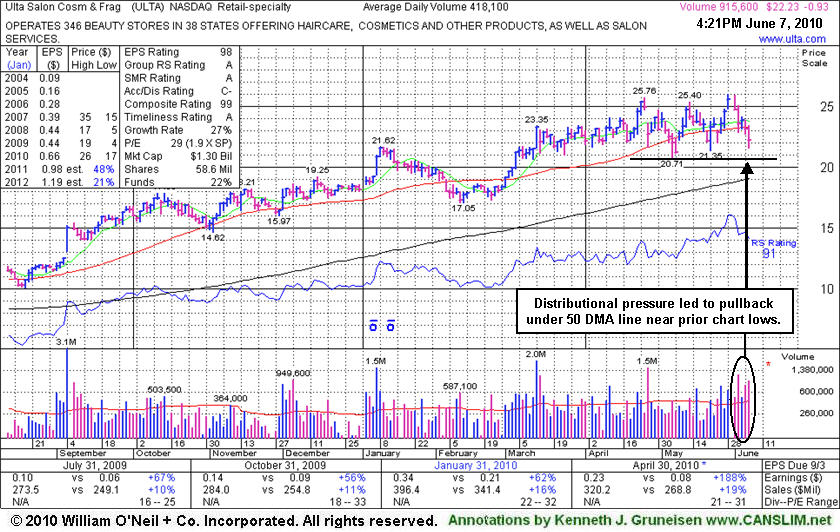
Recent Chart Lows Define Next Support Level - Monday, June 07, 2010
Ulta Salon Cosmetics & Fragrance, Inc. (ULTA -$0.93 or -4.02% to $22.23) sank below its 50-day moving average (DMA) line today, falling again with more above average volume behind the damage. For now it remains an ideal candidate for investors' watch lists, but the distributional pressure raises concerns while quickly pressuring it near prior chart lows. In the past it proved resilient and promptly rebounded above its short-term average. Meanwhile, the recent chart low ($20.71) defines the next important support level to watch, where any violations would raise more serious concerns and trigger additional technical sell signals. ULTA made very little headway since the detailed Stock Bulletin with annotated graph was published soon after it was featured in the 3/12/10 mid-day report (read here) as a considerable gain with heavy volume helped it reach a new 52-week high. It was noted as it rose from an 8-week cup shaped base following stronger results for the quarter ended January 31, 2010.
This high-ranked leader in the Retail - Misc group which has shown accelerating sales revenues increases. Strong quarterly earnings increases above the +25% guideline in the 3 latest quarterly comparisons satisfies the C criteria. The number of top-rated funds with an ownership interest has grown from 49 funds in March '09 to 78 funds as of Mar '10 which is an encouraging sign of increasing institutional interest (the I criteria). Management's 51% ownership stake keeps the company's directors very motivated to look after and build shareholder value.
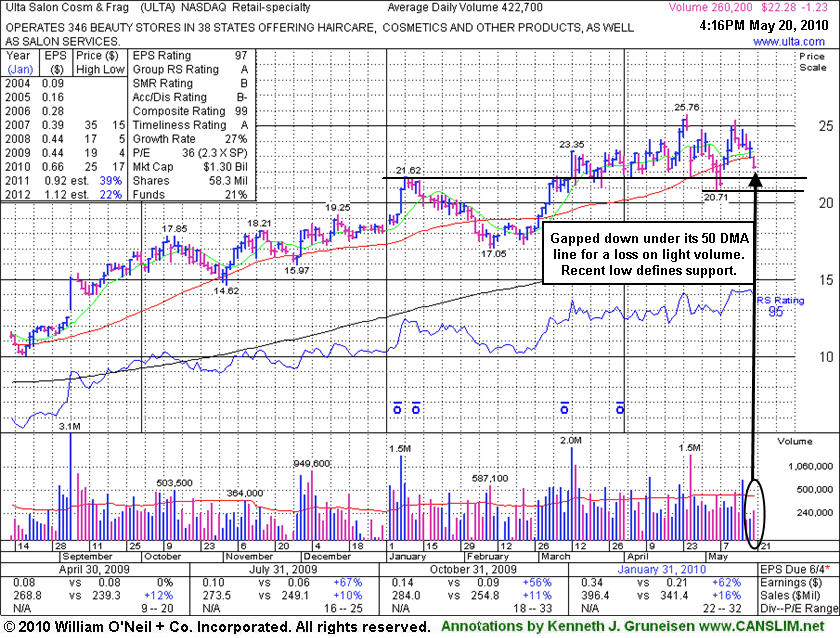
Weakness Weighs On Previously Resilient Leader - Thursday, May 20, 2010
Ulta Salon Cosmetics & Fragrance, Inc. (ULTA -$1.35 or -5.74% to $22.16) gapped down today and the considerable loss on light volume violated its 50-day moving average (DMA) line again, raising concerns. In the past it proved resilient and promptly rebounded above its short-term average. Meanwhile, the recent chart low ($20.71) defines the next important support to watch now, where any violations would raise more serious concerns and trigger additional technical sell signals. ULTA made very little headway since the detailed Stock Bulletin with annotated graph was published soon after it was featured in the 3/12/10 mid-day report (read here) as a considerable gain with heavy volume helped it reach a new 52-week high. It was noted as it rose from an 8-week cup shaped base following stronger results for the quarter ended January 31, 2010.
This high-ranked leader in the Retail - Misc group which has shown accelerating sales revenues increases. Strong quarterly earnings increases above the +25% guideline in the 3 latest quarterly comparisons satisfies the C criteria. The number of top-rated funds with an ownership interest has grown from 49 funds in March '09 to 77 funds as of Mar '10 which is an encouraging sign of increasing institutional interest (the I criteria). Management's 51% ownership stake keeps the company's directors very motivated to look after and build shareholder value. Its current Up/Down Volume Ratio of 1.3 is an unbiased bullish indication concerning its recent action. Until the major averages (M criteria) get their footing and produce a solid follow-through day, the outlook is not favorable enough for new buying efforts under the fact-based system.
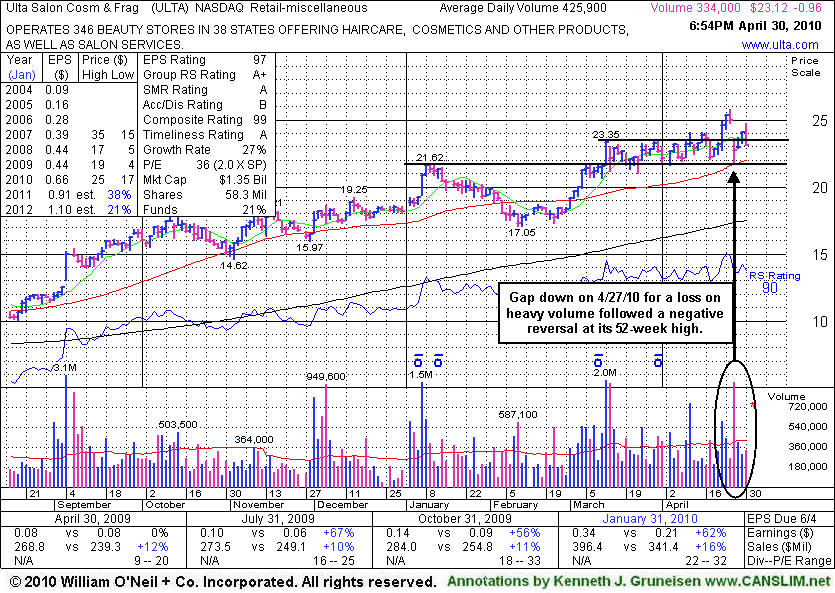
Negative Reversals And Gap Down Are Distributional Signs - Friday, April 30, 2010
Ulta Salon Cosmetics & Fragrance, Inc. (ULTA -0.96 or -3.99% to $23.12) started higher, but another "negative reversal" today led to a loss on light volume and close near the session's low. This week it rallied back on lighter volume following a gap down and heavy distributional pressure after the previously noted negative reversal at its 52-week high. A subsequent violation of its 50-day moving average (DMA) line or recent chart low $21.66 could trigger damaging technical sell signals.
ULTA made very little headway since the detailed Stock Bulletin with annotated graph was published soon after it was featured in the 3/12/10 mid-day report (read here) as a considerable gain with heavy volume helped it reach a new 52-week high. It was noted as it rose from an 8-week cup shaped base following stronger results for the quarter ended January 31, 2010.
This high-ranked leader in the Retail - Misc group which has shown accelerating sales revenues increases. Strong quarterly earnings increases above the +25% guideline in the 3 latest quarterly comparisons satisfies the C criteria. The number of top-rated funds with an ownership interest has grown from 49 funds in March '09 to 78 funds as of Mar '10 which is an encouraging sign of increasing institutional interest (the I criteria). Management's 51% ownership stake keeps the company's directors very motivated to look after and build shareholder value. Its current Up/Down Volume Ratio of 1.6 is an unbiased bullish indication concerning its recent action.
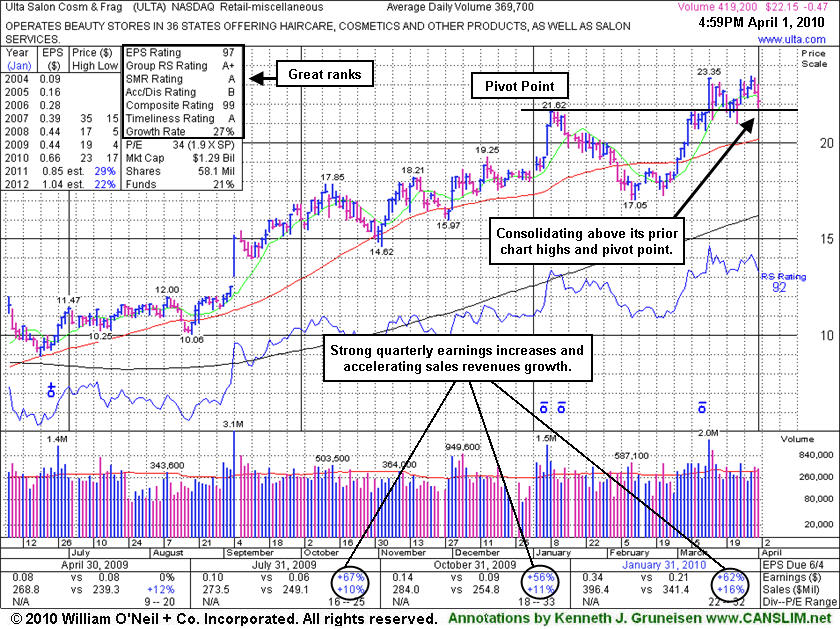
Consolidating Above Prior Chart Highs - Thursday, April 01, 2010
Ulta Salon Cosmetics & Fragrance, Inc. (ULTA -0.47 or -2.08% to $22.15) suffered a second consecutive loss today with slightly higher than average volume, a sign of mild distributional pressure this week. Its color code was changed to yellow while consolidating below its "max buy" level but staying above its pivot point. Prior chart highs are now a support level to watch, while any close below its $21.61 high close from January 8, 2010 would raise concerns by negating its latest technical breakout. A detailed Stock Bulletin with annotated graph was published soon after it was featured in the 3/12/10 mid-day report (read here) as a considerable gain with heavy volume helped it reach a new 52-week high. It was noted as it rose from an 8-week cup shaped base following stronger results for the quarter ended January 31, 2010.
This high-ranked leader in the Retail - Misc group which has shown accelerating sales revenues increases. Strong quarterly earnings increases above the +25% guideline in the 3 latest quarterly comparisons satisfies the C criteria. The number of top-rated funds with an ownership interest has grown from 49 funds in March '09 to 72 funds as of Dec '09 which is an encouraging sign of increasing institutional interest (the I criteria). Management's 51% ownership stake keeps the company's directors very motivated to look after and build shareholder value. Its current Up/Down Volume Ratio of 1.5 is an unbiased bullish indication concerning its recent action. It has rallied from March '09 lows near $4, yet it has encountered very little distributional pressure during that period. It now faces no resistance due to overhead supply.