Extended From Any Sound Bass and Wedging to New Highs - Friday, April 12, 2019
Ubiquiti Networks Inc (UBNT +$1.71 or +1.04% to $165.77) hit another new all-time high with a third consecutive gain backed by lighter volume. It has been stubbornly holding its ground but did not form a sound base of sufficient length after a big rally. Its 50-day moving average (DMA) line ($142) and prior low ($136.08 on 3/08/19) define near-term support to watch.
Fundamentals remain strong.Bullish action came after it reported earnings +75% on +23% sales revenues for the Dec '18 quarter, marking its 4th consecutive quarterly comparison above the +25% minimum earnings guideline (C criteria).
It was last shown in this FSU section on 3/05/19 with an annotated graph under the headline, "Bullish Action Came Following Another Strong Earnings Report". It was first highlighted in yellow in the 11/09/18 mid-day report with new pivot point cited based on its 9/25/18 high plus 10 cents (read here).
The number of top-rated funds owning its shares rose from 262 in Dec '17 to 332 in Mar '19, a reassuring sign concerning the I criteria. Its current Up/Down Volume ratio of 3.0 is an unbiased indication its shares have been under accumulation over the past 50 days. Its small supply of only 14.8 million shares (S criteria) in the public float can contribute to greater price volatility in the event of institutional buying or selling.
UBNT has earned an A Timeliness Rating and B Sponsorship Rating. It hails from the Telecom - Infrastructure Industry Group which has a 91 Group Relative Strength Rating, a reassuring sign concerning the L criteria. After a small downturn in FY '15 its annual earnings (A criteria) growth has been strong.
Chart courtesy of www.stockcharts.com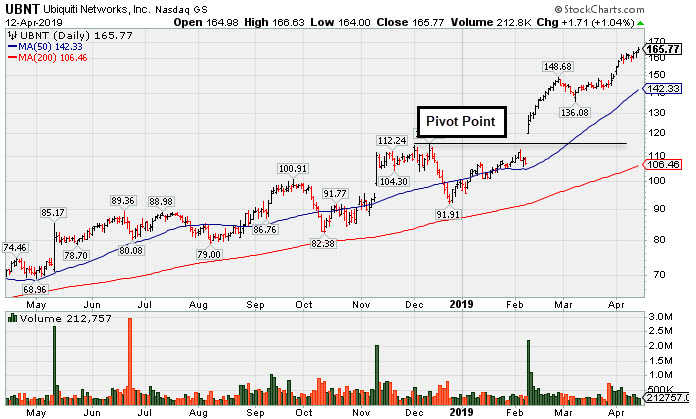
Bullish Action Came Following Another Strong Earnings Report - Tuesday, March 5, 2019
Ubiquiti Networks Inc (UBNT +$0.11 or +0.08% to $143.97) is holding its ground perched near its all-time high, very extended from the prior base. Fundamentals remain strong. Bullish action came after it reported earnings +75% on +23% sales revenues for the Dec '18 quarter, marking its 4th consecutive quarterly comparison above the +25% minimum earnings guideline (C criteria).
Its prior high ($115) defines initial support to watch on pullbacks. It was last shown in this FSU section on 1/31/19 with an annotated graph under the headline, "Consolidating Above 50-Day Moving Average". It was first highlighted in yellow in the 11/09/18 mid-day report with new pivot point cited based on its 9/25/18 high plus 10 cents (read here).
The number of top-rated funds owning its shares rose from 262 in Dec '17 to 317 in Dec '18, a reassuring sign concerning the I criteria. Its current Up/Down Volume ratio of 2.3 is an unbiased indication its shares have been under slight distributional pressure over the past 50 days. Its small supply of only 14.8 million shares (S criteria) in the public float can contribute to greater price volatility in the event of institutional buying or selling.
UBNT has earned an A Timeliness Rating and B Sponsorship Rating. It hails from the Telecom - Infrastructure Industry Group which has an A+ Group Relative Strength Rating, a reassuring sign concerning the L criteria. After a small downturn in FY '15 its annual earnings (A criteria) growth has been strong.
Chart courtesy of www.stockcharts.com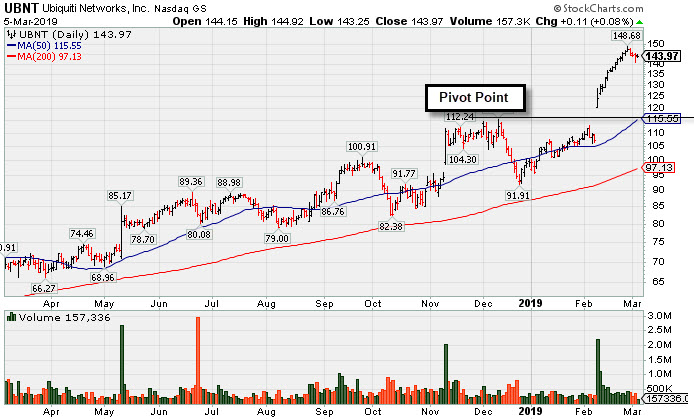
Consolidating Above 50-Day Moving Average - Thursday, January 31, 2019
Ubiquiti Networks Inc (UBNT+$0.27 or +0.25% to $108.21) is consolidating above its 50-day moving average (DMA) line. It has shown resilience since last shown in this FSU section on 1/15/19 with an annotated graph under the headline, "Sputtering Below 50-Day Moving Average Again".
It quickly got extended more than +5% above the prior high and finished strong after highlighted in yellow in the 11/09/18 mid-day report with new pivot point cited based on its 9/25/18 high plus 10 cents (read here). The big gain for a new high with nearly 4 times average volume triggered a technical buy signal.
Keep in mind that it is due to report earnings on 2/08/19. Volume and volatility often increase near earnings news. Bullish action came after it reported earnings +27% on +15% sales revenues for the Sep '18 quarter, marking its 3rd consecutive quarterly comparison above the +25% minimum earnings guideline (C criteria), helping it better match the fact-based investment system's fundamental guidelines.
The number of top-rated funds owning its shares rose from 262 in Dec '17 to 305 in Dec '18, a reassuring sign concerning the I criteria. Its current Up/Down Volume ratio of 0.9 is an unbiased indication its shares have been under slight distributional pressure over the past 50 days. Its small supply of only 14.9 million shares (S criteria) in the public float can contribute to greater price volatility in the event of institutional buying or selling. It has earned a B Timeliness Rating and B Sponsorship Rating. It hails from the Telecom - Infrastructure Industry Group which has an B+ Group Relative Strength Rating, a reassuring sign concerning the L criteria.
After a small downturn in FY '15 its annual earnings (A criteria) growth has been strong. That fundamental shortcoming had a role in limiting its appearances since UBNT was shown in this FSU section on 4/20/12 with an annotated graph under the headline, "Formed a New Ascending Base But Did Not Confirm New Buy Signal".
Chart courtesy of www.stockcharts.com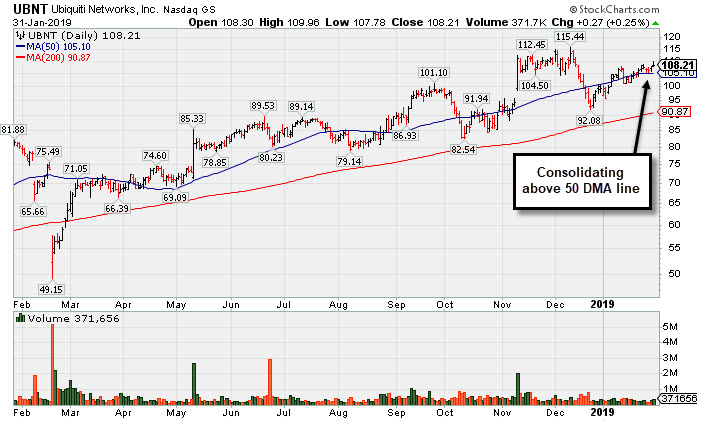
Sputtering Below 50-Day Moving Average Again - Tuesday, January 15, 2019
Ubiquiti Networks Inc (UBNT +$1.54 or 1.52% to $102.93) posted a small gain. It slumped back below its 50-day moving average (DMA) line ($103.78) on the prior session hurting its outlook. A prompt rebound is needed for its outlook to improve, Meanwhile, the prior low ($92.08 on 12/24/18) defines the next important support.
It was last shown in this FSU section on 1/02/19 with an annotated graph under the headline, "Needs Rebound Above 50-Day Average to Help Outlook". It quickly got extended more than +5% above the prior high and finished strong after highlighted in yellow in the 11/09/18 mid-day report with new pivot point cited based on its 9/25/18 high plus 10 cents (read here). The big gain for a new high with nearly 4 times average volume triggered a technical buy signal.
Fundamentals remain strong. Bullish action came after it reported earnings +27% on +15% sales revenues for the Sep '18 quarter, marking its 3rd consecutive quarterly comparison above the +25% minimum earnings guideline (C criteria), helping it better match the fact-based investment system's fundamental guidelines.
The number of top-rated funds owning its shares rose from 262 in Dec '17 to 295 in Dec '18, a reassuring sign concerning the I criteria. Its current Up/Down Volume ratio of 1.2 is an unbiased indication its shares have been under slight accumulation over the past 50 days. Its small supply of only 14.9 million shares (S criteria) in the public float can contribute to greater price volatility in the event of institutional buying or selling. It has earned an A Timeliness Rating and B Sponsorship Rating. It hails from the Telecom - Infrastructure Industry Group which has an A- Group Relative Strength Rating, a reassuring sign concerning the L criteria.
After a small downturn in FY '15 its annual earnings (A criteria) growth has been strong. That fundamental shortcoming had a role in limiting its appearances since UBNT was shown in this FSU section on 4/20/12 with an annotated graph under the headline, "Formed a New Ascending Base But Did Not Confirm New Buy Signal".
Chart courtesy of www.stockcharts.com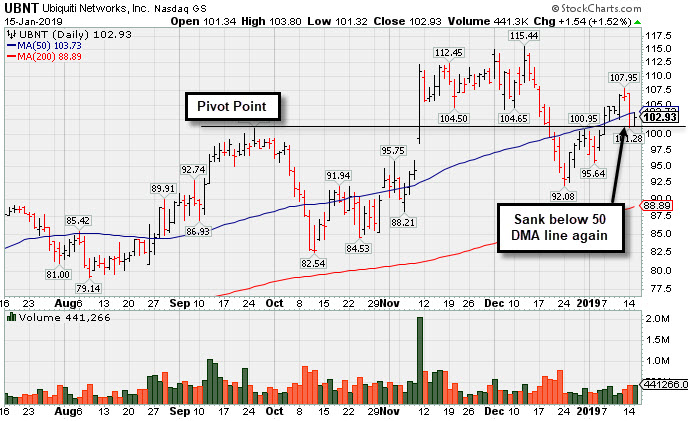
Needs Rebound Above 50-Day Average to Help Outlook - Wednesday, January 2, 2019
Ubiquiti Networks Inc (UBNT -$0.10 or -0.10% to $99.31) is still sputtering below its 50-day moving average (DMA) line. A rebound above the 50 DMA line ($101.26) is needed for its outlook to improve.
It was last shown in this FSU section on 12/11/18 with an annotated graph under the headline, "Volume Totals Cooling While Still Hovering Above "Max Buy" Level". It quickly got extended more than +5% above the prior high and finished strong after highlighted in yellow in the 11/09/18 mid-day report with new pivot point cited based on its 9/25/18 high plus 10 cents (read here). The big gain for a new high with nearly 4 times average volume triggered a technical buy signal.
Bullish action came after it reported earnings +27% on +15% sales revenues for the Sep '18 quarter, marking its 3rd consecutive quarterly comparison above the +25% minimum earnings guideline (C criteria), helping it better match the fact-based investment system's fundamental guidelines.
The number of top-rated funds owning its shares rose from 262 in Dec '17 to 298 in Sep '18, a reassuring sign concerning the I criteria. Its current Up/Down Volume ratio of 1.0 is an unbiased indication its shares have been neutral concerning accumulation/distribution over the past 50 days. Its small supply of only 14.9 million shares (S criteria) in the public float can contribute to greater price volatility in the event of institutional buying or selling. It has earned a B Timeliness Rating and B Sponsorship Rating. It hails from the Telecom - Infrastructure Industry Group which has a B+ Group Relative Strength Rating, a reassuring sign concerning the L criteria.
After a small downturn in FY '15 its annual earnings (A criteria) growth has been strong. That fundamental shortcoming had a role in limiting its appearances since UBNT was shown in this FSU section on 4/20/12 with an annotated graph under the headline, "Formed a New Ascending Base But Did Not Confirm New Buy Signal".
Chart courtesy of www.stockcharts.com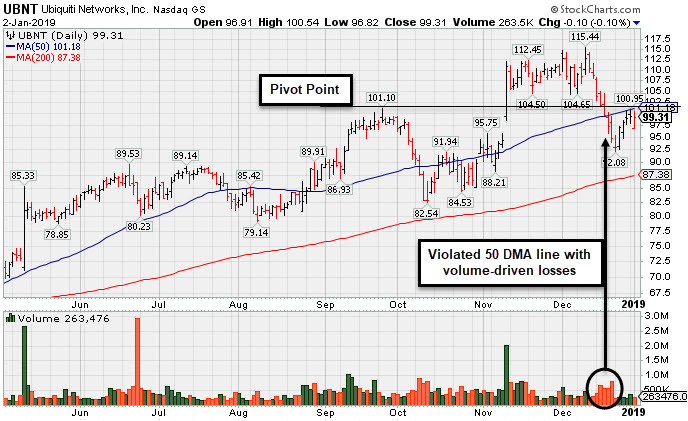
Volume Totals Cooling While Still Hovering Above "Max Buy" Level - Tuesday, December 11, 2018
Ubiquiti Networks Inc (UBNT -$0.46 or -0.42% to $108.52) retreated from its all-time high with recent losses on lighter volume. The prior high ($101.33 on 9/25/18) defines initial support to watch on pullbacks. It quickly got extended more than +5% above the prior high and finished strong after highlighted in yellow in the 11/09/18 mid-day report with new pivot point cited based on its 9/25/18 high plus 10 cents (read here). The big gain for a new high with nearly 4 times average volume triggered a technical buy signal. It was last shown in this FSU section with an annotated graph under the headline, "Pullback Following Breakout Gain on After Latest Earnings Report".
A tactical approach taught in the Certification requires investors to avoid chasing extended stocks. Disciplined investors also know to always limit losses if ever any stock falls more than 7% from their purchase price! Bullish action last week came after it reported earnings +27% on +15% sales revenues for the Sep '18 quarter, marking its 3rd consecutive quarterly comparison above the +25% minimum earnings guideline (C criteria), helping it better match the fact-based investment system's fundamental guidelines.
The number of top-rated funds owning its shares rose from 262 in Dec '17 to 294 in Sep '18, a reassuring sign concerning the I criteria. Its current Up/Down Volume ratio of 0.9 is an unbiased indication its shares have been under slight distributional pressure over the past 50 days. Its small supply of only 14.9 million shares (S criteria) in the public float can contribute to greater price volatility in the event of institutional buying or selling. It has earned a B Timeliness Rating and B Sponsorship Rating. It hails from the Telecom - Infrastructure Industry Group which has an 81 Group Relative Strength Rating, a reassuring sign concerning the L criteria.
After a small downturn in FY '15 its annual earnings (A criteria) growth has been strong. That fundamental shortcoming had a role in limiting its appearances since UBNT was shown in this FSU section on 4/20/12 with an annotated graph under the headline, "Formed a New Ascending Base But Did Not Confirm New Buy Signal".
Chart courtesy of www.stockcharts.com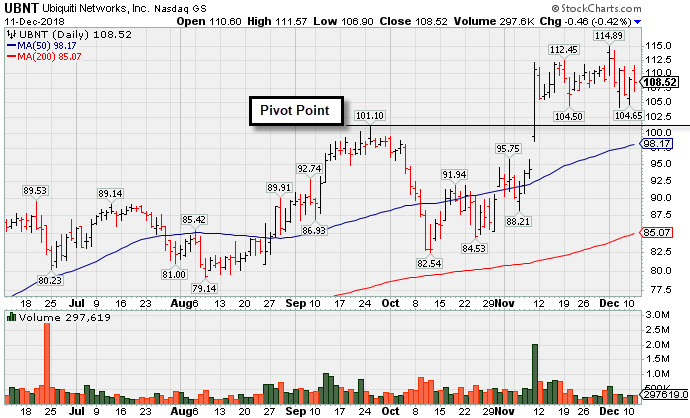
Pullback Following Breakout Gain on After Latest Earnings Report - Monday, November 12, 2018
Ubiquiti Networks Inc (UBNT -$5.17 or -4.65% to $105.96) pulled back back below its "max buy" level with above average volume behind a big loss today. It had quickly gotten extended more than +5% above the prior high and finished strong after highlighted in yellow in the 11/09/18 mid-day report with new pivot point cited based on its 9/25/18 high plus 10 cents (read here). The big gain for a new high with nearly 4 times average volume triggered a technical buy signal.
A tactical approach taught in the Certification requires investors to avoid chasing extended stocks. Disciplined investors also know to always limit losses if ever any stock falls more than 7% from their purchase price! Bullish action last week came after it reported earnings +27% on +15% sales revenues for the Sep '18 quarter, marking its 3rd consecutive quarterly comparison above the +25% minimum earnings guideline (C criteria), helping it better match the fact-based investment system's fundamental guidelines.
The number of top-rated funds owning its shares rose from 262 in Dec '17 to 293 in Sep '18, a reassuring sign concerning the I criteria. Its current Up/Down Volume ratio of 1.2 is an unbiased indication its shares have been under accumulation over the past 50 days. Its small supply of only 20 million shares (S criteria) in the public float can contribute to greater price volatility in the event of institutional buying or selling. It has earned a B Timeliness Rating and B Sponsorship Rating. It hails from the Telecom - Infrastructure Industry Group which has a 91 Group Relative Strength Rating, a reassuring sign concerning the L criteria.
After a small downturn in FY '15 its annual earnings (A criteria) growth has been strong. That fundamental shortcoming had a role in limiting its appearances since UBNT was last shown in this FSU section on 4/20/12 with an annotated graph under the headline, "Formed a New Ascending Base But Did Not Confirm New Buy Signal".
Chart courtesy of www.stockcharts.com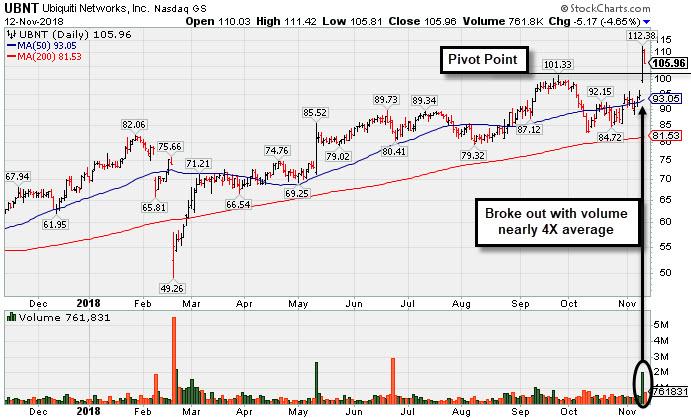
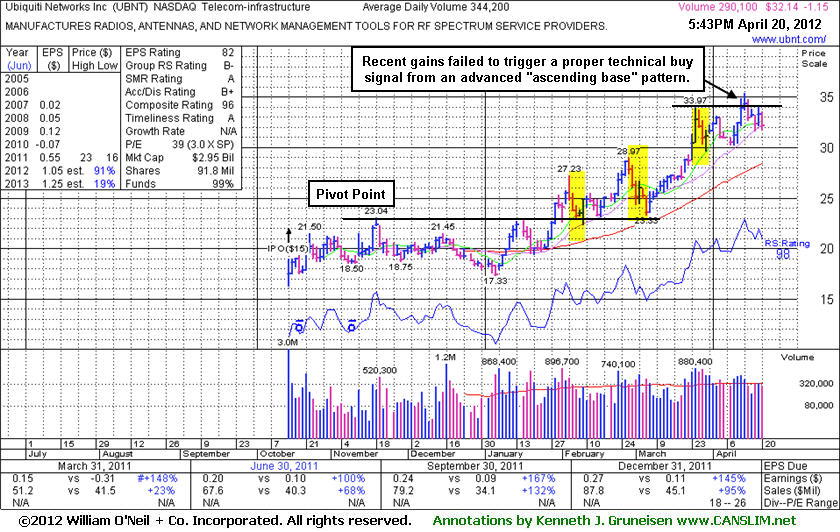
Formed a New Ascending Base But Did Not Confirm New Buy Signal - Friday, April 20, 2012
Ubiquiti Networks Inc (UBNT -$1.15 or -3.45% to $32.14) has been consolidating from an all-time high hit last week. Its color code recently was changed to yellow with new pivot point cited based on its 3/26/12 high plus 10 cents after forming an advanced "ascending base" pattern marked by 3 pullbacks of 10-20% (highlighted in yellow on the annotated graph below) following its previous breakout. A volume-driven gain did not yet trigger a proper new (or add-on) technical buy signal. If subsequent gains are produced, disciplined investors know that the further one chases any stock above its pivot point the greater the chances are than an ordinary pullback may necessitate selling. A tactical approach called pyramiding is taught in the Certification to help investors avoid chasing stocks and get the best results. Disciplined investors also know to always limit losses if ever any stock falls more than 7% from their purchase price!
Bullish action has continued since it was last shown in this FSU section on 3/21/12 with an annotated graph under the headline, "Volume-Driven Gain For Best Ever Close", as it rallied for a best-ever close and challenged its 52-week high with a solid gain backed by +58% above average volume. It was first featured in yellow at $22.25 in the 1/27/12 mid-day report (read here) when perched within close striking distance of its 52-week high which was the basis for the pivot point cited. Subsequently, a technical buy signal was triggered on 1/30/12 with a considerable volume-driven gain into new high territory. It also reported earnings +145% on +95% sales revenues for the quarter ended December 31, 2011 versus the year ago period, adding to its strong fundamental track record of solid quarterly reports.
The limited trading history of new issues is often a cause for concern, yet in this case the stock built a sound base pattern of sufficient length and its fundamental characteristics were noted as particularly strong. Strong fundamentals and bullish technical action are no guarantee a stock will go on to generate great profits for investors.
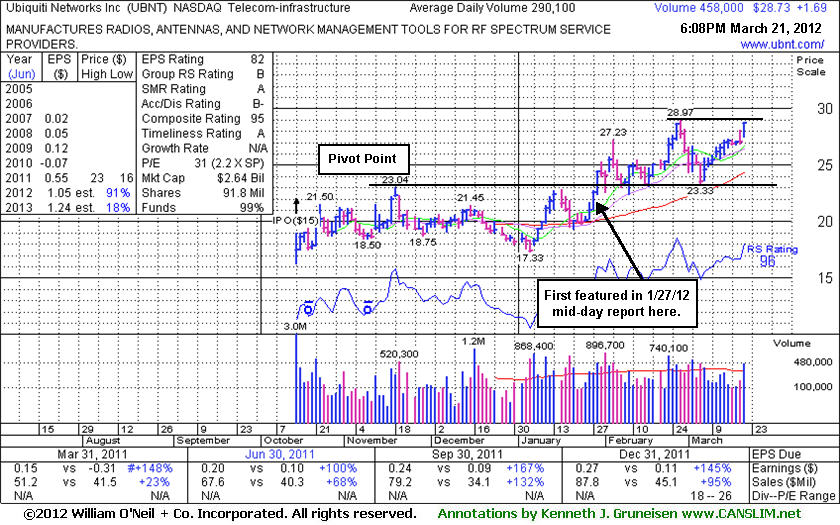
Volume-Driven Gain For Best Ever Close - Wednesday, March 21, 2012
Ubiquiti Networks Inc (UBNT +$1.69 or +6.25% to $28.73) rallied for a best-ever close and challenged its 52-week high today with a solid gain backed by +58% above average volume. Its color code is changed to green after rallying well above its previously cited "max buy" level. Recent notes explained that they teach in the Certification that a stock may be bought from its 10-week moving average (WMA) up to +5% above the latest high following an earlier technical breakout. In this case that could be $28.97 on 2/28/12 plus another 5%, however the further one chases any stock above its pivot point the greater the chances are than an ordinary pullback may necessitate selling - as disciplined investors know to always limit losses if ever any stock falls more than 7% from their purchase price!
UBNT was last shown in this FSU section on 2/01/12 with an annotated graph under the headline, "Finished in Upper Third of Intra-day Range After Deeper Dip." It was first featured in yellow at $22.25 in the 1/27/12 mid-day report (read here) when perched within close striking distance of its 52-week high which was the basis for the pivot point cited. Subsequently, a technical buy signal was triggered on 1/30/12 with a considerable volume-driven gain into new high territory. It also reported earnings +145% on +95% sales revenues for the quarter ended December 31, 2011 versus the year ago period, adding to its strong fundamental track record of solid quarterly reports.
The limited trading history of new issues is often a cause for concern, yet in this case the stock built a sound base pattern of sufficient length and its fundamental characteristics were noted as particularly strong. Strong fundamentals and bullish technical action are no guarantee a stock will go on to generate great profits for investors.
Prior lows near $23 and its 50-day moving average (DMA) line define important chart support levels to watch on pullbacks. Losses leading to deterioration and a close below those levels would raise greater concerns and trigger technical sell signals. Patient investors may watch for any secondary buy points to possibly develop and be noted.
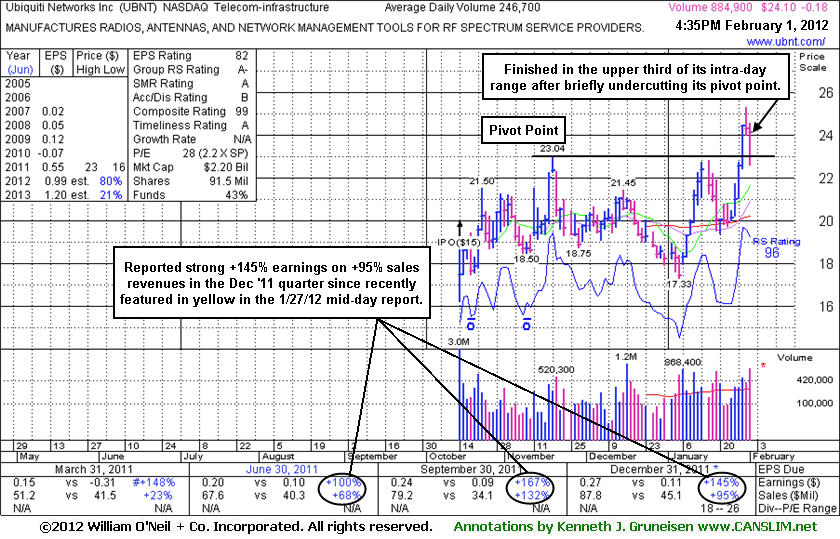
Finished in Upper Third of Intra-day Range After Deeper Dip - Wednesday, February 01, 2012
Often, when a leading stock is setting up to breakout of a solid base it is highlighted in CANSLIM.net's Mid-Day Breakouts Report. The most relevant factors are noted in the report which allows prudent CANSLIM oriented investors to place the issue in their watch list. After doing any necessary backup research, the investor is prepared to act if and when the stock triggers a technical buy signal (breaks above its pivot point on more than +50% average turnover). In the event the stock fails to trigger a technical buy signal and its price declines then it will simply be removed from the watch list. In other cases, stocks may be featured in CANSLIM.net's Mid-Day Breakouts Report.after recent action already triggered technical buy signal. Disciplined investors know to buy as near as possible to the pivot point and avoid chasing stocks after they have rallied more than +5% above their pivot point. It is crucial to always limit losses whenever any stock heads the wrong direction, and disciplined investors sell if a struggling stock ever falls more than -7% from their purchase price.
Ubiquiti Networks Inc (UBNT -$0.98 or -4.04% to $23.30) finished the session up from the morning's low after briefly undercutting its pivot point, enduring distributional pressure today. There was a "negative reversal" after reaching a new high on the prior session. It was first featured in yellow at $22.25 in the 1/27/12 mid-day report (read here) when perched within close striking distance of its 52-week high which was the basis for the pivot point cited. Subsequently, a technical buy signal was triggered on 1/30/12 with a considerable volume-driven gain into new high territory. It also reported earnings +145% on +95% sales revenues for the quarter ended December 31, 2011 versus the year ago period, adding to its strong fundamental track record of solid quarterly reports.
The limited trading history of new issues is often a cause for concern, yet in this case the stock built a sound base pattern of sufficient length and its fundamental characteristics were noted as particularly strong. Strong fundamentals and bullish technical action are no guarantee a stock will go on to generate great profits for investors, however, and disciplined investors know to always limit losses if ever any stock falls more than 7% from their purchase price. Prior highs near $23 define initial chart support to watch following the recent breakout. The finish in the upper third of its intra-day range is a sign it was finding prompt support, whereas a weak finish near the session low would bode poorly along with any damaging loss with above average volume. Any additional losses leading to deterioration and a close below its prior high closes would completely negate the breakout and raise greater concerns.