There is 1 more featured stock write-up on since to 2/19/2025
Lingering Below 50-Day Moving Average Line - Thursday, January 23, 2025
Texas Roadhouse (TXRH -$0.91 or -0.51% to $179.13) has recently been finding support at its 200 DMA line ($173.40) but lingering below its 50-day moving average (DMA) line ($188.60) in recent weeks. A rebound above the 50 DMA line is still needed for its outlook to improve. Its Relative Strength Rating has slumped to 75, below the 80+ minimum guideline for buy candidates.TXRH was highlighted in yellow with pivot point cited based on its 6/28/24 high plus 10 cents in the 7/26/24 mid-day report (read here). It was last shown in this FSU section on 11/15/24 with an annotated graph under the headline "Hovering Near High After Recent Volume-driven Gains".
The number of top-rated funds owning its shares rose from 682 in Sep '23 to 900 in Dec '24, a reassuring sign concerning the I criteria. Its current Up/Down Volume Ratio of 0.8 is an unbiased indication its shares have been under distributional pressure over the past 50 days.
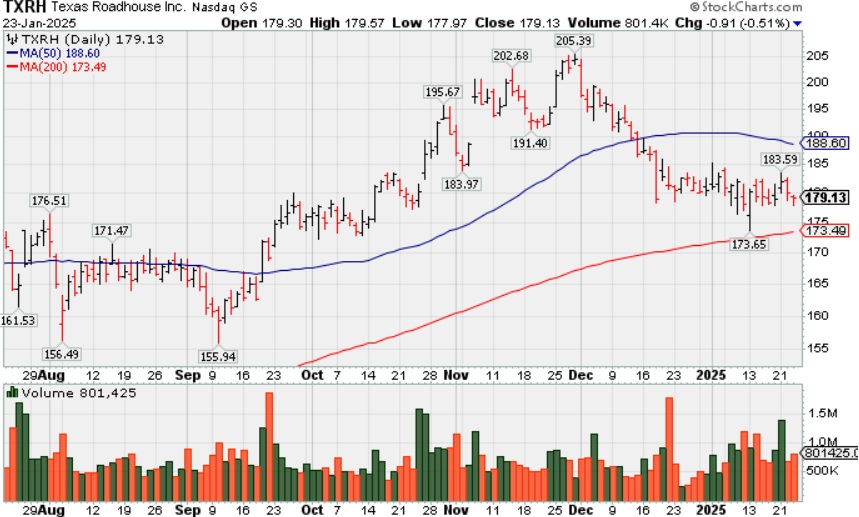
TXRH has a 97 Earnings Per Share Rating, well above the 80+ minimum guideline for buy candidates. It reported Sep '24 quarterly earnings +33% on +13% sales revenues versus the year-ago period, its 3rd consecutive quarterly comparison above the +25% earnings guideline (C criteria). Annual earnings growth has been strong since a downturn in FY '20.
Chart courtesy of www.stockcharts.com
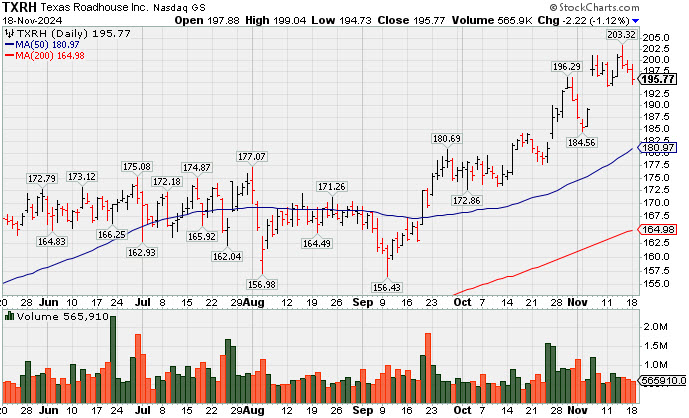
Hovering Near High After Recent Volume-driven Gains - Friday, November 15, 2024
Texas Roadhouse (TXRH) has been stubbornly holding its ground after a gap up on 11/06/24, hovering near its all-time high. Its 50-day moving average (DMA) line ($180) and prior highs in the $177-180 area define important support to watch on pullbacks. It faces no resistance due to overhead supply. TXRH was highlighted in yellow with pivot point cited based on its 6/28/24 high plus 10 cents in the 7/26/24 mid-day report (read here). It was last shown in this FSU section on 10/18/24 with an annotated graph under the headline "Gain With Light Volume for New High Close".TXRH has a 97 Earnings Per Share Rating, well above the 80+ minimum guideline for buy candidates. It reported Sep '24 quarterly earnings +33% on +13% sales revenues versus the year-ago period, its 3rd consecutive quarterly comparison above the +25% earnings guideline (C criteria). Annual earnings growth has been strong since a downturn in FY '20.
Chart courtesy of www.stockcharts.com
| Symbol/Exchange Company Name Industry Group | PRICE | CHANGE | Day High | Volume (% DAV) (% 50 day avg vol) | 52 Wk Hi | Featured Date | Price Featured | Pivot Featured |
| Max Buy | ||||||||
U.S. Lime & Minerals Bldg-Cement/Concrt/Ag | $141.21 | +0.20 0.14% | $143.18 | 56,339 50 DAV is 70,000 | $146.70 -3.74% | 9/17/2024 | $71.26 | PP = $87.23 |
| MB = $91.59 | ||||||||
| Most Recent Note - 11/12/2024 5:27:28 PM G - Pulled back from its all-time high with today''s 2nd consecutive volume-driven loss following a noted spurt of volume-driven gains. Its 50 DMA line ($100) defines important near-term support to watch on pullbacks. See the latest FSU analysis for more details and a new annotated graph. >>> FEATURED STOCK ARTICLE : Extended From Any Sound Base After Impressive Rally - 11/12/2024 | View all notes | Set NEW NOTE alert | Company Profile | SEC News | Chart | Request a new note | ||||||||
Granite Construction Bldg-Heavy Construction | $95.61 | -0.13 -0.14% | $96.02 | 321,953 50 DAV is 701,000 | $99.32 -3.74% | 6/11/2024 | $59.76 | PP = $64.33 |
| MB = $67.55 | ||||||||
| Most Recent Note - 11/13/2024 5:48:02 PM G - Perched near its all-time high, holding its ground while very extended from any sound base. Bullish action has come after it reported Sep '24 quarterly earnings +19% on +14% sales revenues versus the year-ago period, below the +25% minimum guideline (C criteria) of the fact-based investment system. >>> FEATURED STOCK ARTICLE : Extended From Base After Streak of Gains for New Highs - 11/8/2024 | View all notes | Set NEW NOTE alert | Company Profile | SEC News | Chart | Request a new note | ||||||||
Texas Roadhouse Retail-Restaurants | $197.99 | -0.92 -0.46% | $200.00 | 592,412 50 DAV is 740,000 | $203.32 -2.62% | 7/26/2024 | $173.08 | PP = $175.82 |
| MB = $184.61 | ||||||||
| Most Recent Note - 11/12/2024 2:12:20 PM G - Volume totals have been cooling while holding its ground after a gap up on 11/06/24 hitting a new all-time high. Prior highs in the $177-180 area define important support to watch coinciding with its 50 DMA line ($178). >>> FEATURED STOCK ARTICLE : Hovering Near High After Recent Volume-driven Gains - 11/15/2024 | View all notes | Set NEW NOTE alert | Company Profile | SEC News | Chart | Request a new note | ||||||||
Howmet Aerospace Aerospace/Defense | $112.01 | -1.21 -1.07% | $113.08 | 2,221,703 50 DAV is 2,275,000 | $116.74 -4.05% | 7/30/2024 | $93.95 | PP = $85.52 |
| MB = $89.80 | ||||||||
| Most Recent Note - 11/12/2024 2:18:39 PM G - Stubbornly holding its ground perched at its all-time high, extended from any sound base. Its prior high ($106.93 on 10/21/24) and 50 DMA line ($101) define near-term support levels to watch on pullbacks. Reported Sep ''24 quarterly earnings +54% on +11% sales revenues versus the year-ago period. >>> FEATURED STOCK ARTICLE : Found Support at 50-Day Moving Average Line Before Earnings Report - 11/5/2024 | View all notes | Set NEW NOTE alert | Company Profile | SEC News | Chart | Request a new note | ||||||||
Natural Grocers Retail-Super/Mini Mkts | $32.84 | +0.04 0.12% | $33.24 | 77,966 50 DAV is 88,000 | $34.76 -5.52% | 11/5/2024 | $30.57 | PP = $30.42 |
| MB = $31.94 | ||||||||
| Most Recent Note - 11/13/2024 5:50:00 PM G - Pulled back from its all-time high with today''s loss on lighter volume breaking a streak of 6 consecutive gains marked by higher volume. Prior high in the $30 area defines initial support to watch above its 50 DMA line ($28.18). >>> FEATURED STOCK ARTICLE : New High After 6th Consecutive Gain - 11/11/2024 | View all notes | Set NEW NOTE alert | Company Profile | SEC News | Chart | Request a new note | ||||||||
| Symbol/Exchange Company Name Industry Group | PRICE | CHANGE | Day High | Volume (% DAV) (% 50 day avg vol) | 52 Wk Hi | Featured Date | Price Featured | Pivot Featured |
| Max Buy | ||||||||
Celestica Elec-Contract Mfg | $82.18 | +1.70 2.11% | $82.44 | 3,182,154 50 DAV is 2,312,000 | $87.99 -6.60% | 10/11/2024 | $57.62 | PP = $63.59 |
| MB = $66.77 | ||||||||
| Most Recent Note - 11/13/2024 5:46:44 PM G - Pulled back from its all-time high with today''s 3rd consecutive loss backed by average volume. It is very extended from any sound base. The prior highs in the $63 area define initial support to watch on pullbacks. See the latest FSU analysis for more details and a new annotated graph. >>> FEATURED STOCK ARTICLE : Pulling Back After Considerable Rally - 11/13/2024 | View all notes | Set NEW NOTE alert | Company Profile | SEC News | Chart | Request a new note | ||||||||
Paymentus Holdings Finance-CrdtCard/PmtPr | $33.50 | +0.95 2.92% | $33.57 | 538,689 50 DAV is 296,000 | $37.00 -9.46% | 10/17/2024 | $26.15 | PP = $25.31 |
| MB = $26.58 | ||||||||
G - Holding its ground after spiking higher on 11/13/24 after it reported Sep '24 quarterly earnings +67% on +52% sales revenues versus the year ago period. It found support near prior highs in the $24-25 area during the recent consolidation. See the latest FSU analysis for more details and an annotated graph. >>> FEATURED STOCK ARTICLE : Extended From Prior Base After Considerable Spike Higher - 11/14/2024 | View all notes | Set NEW NOTE alert | Company Profile | SEC News | Chart | Request a new note | ||||||||
Resmed Inc HEALTH SERVICES - Medical Appliances and Equipment | $234.74 | +3.31 1.43% | $235.09 | 1,116,942 50 DAV is 1,060,700 | $260.49 -9.89% | 10/25/2024 | $256.64 | PP = $255.28 |
| MB = $268.04 | ||||||||
| Most Recent Note - 11/13/2024 5:52:09 PM G - Color code is changed to green after today''s big loss violated its 50 DMA line ($243) triggering a technical sell signal and it closed near the session low. A prompt rebound above the 50 DMA line is needed for its outlook to improve. >>> FEATURED STOCK ARTICLE : ResMed Negated Friday''s Breakout Raising Concerns - 10/28/2024 | View all notes | Set NEW NOTE alert | Company Profile | SEC News | Chart | Request a new note | ||||||||
Adtalem Global Education Consumer Svcs-Education | $87.20 | +2.38 2.81% | $88.42 | 751,836 50 DAV is 371,000 | $92.93 -6.17% | 10/30/2024 | $83.34 | PP = $80.28 |
| MB = $84.29 | ||||||||
| Most Recent Note - 11/14/2024 5:09:13 PM G - Pulled back today with +28% above average volume, retreating toward its "max buy" level. It quickly got extended from the previously noted base with a noted spurt of volume-driven gains. Prior highs in the $80 area define initial support to watch. Fundamentals remain strong. >>> FEATURED STOCK ARTICLE : Holding Ground Following Recent Technical Breakout - 11/4/2024 | View all notes | Set NEW NOTE alert | Company Profile | SEC News | Chart | Request a new note | ||||||||
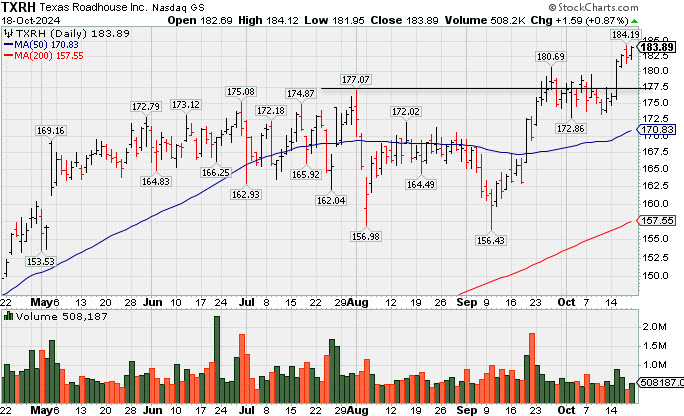
Gain With Light Volume for New High Close - Friday, October 18, 2024
Texas Roadhouse (TXRH +$1.59 or +0.87% to $183.89) rose to a new all-time high close with today's gain backed by below-average volume. It faces no resistance due to overhead supply. TXRH was highlighted in yellow with pivot point cited based on its 6/28/24 high plus 10 cents in the 7/26/24 mid-day report (read here). It was last shown in this FSU section on 9/26/24 with an annotated graph under the headline "Wedging to New Highs With Quiet Volume Behind Gains".TXRH has a 96 Earnings Per Share Rating, well above the 80+ minimum guideline for buy candidates. It reported Jun '24 quarterly earnings +47% on +15% sales revenues versus the year-ago period. Sequential quarterly comparisons show impressive earnings growth rate acceleration. Annual earnings growth has been strong since a downturn in FY '20.
Chart courtesy of www.stockcharts.com
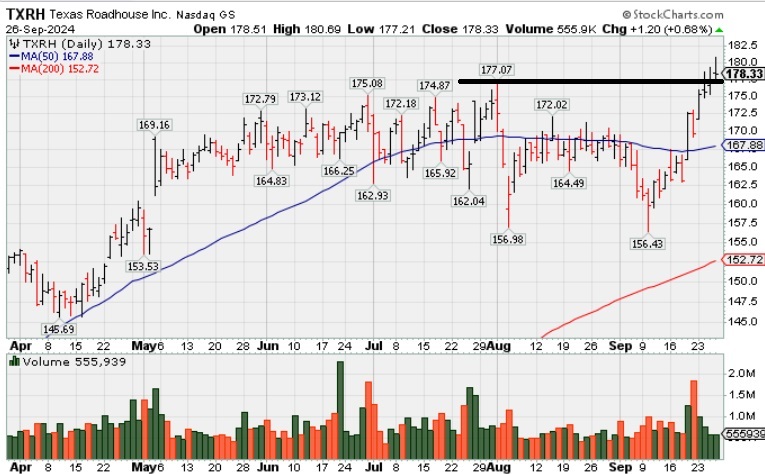
Wedging to New Highs With Quiet Volume Behind Gains - Thursday, September 26, 2024
Texas Roadhouse (TXRH +$1.20 or +0.68% to $178.33) hit a new high with lighter volume behind today's 4th consecutive gain. The recently noted rebound above its 50-day moving average (DMA) line ($168) helped its outlook to improve. It now faces no resistance due to overhead supply. Subsequent gains for new highs backed by at least +40% above average may help to confirm a proper technical buy signal.TXRH was highlighted in yellow with pivot point cited based on its 6/28/24 high plus 10 cents in the 7/26/24 mid-day report (read here). It was last shown in this FSU section on 8/27/24 with an annotated graph under the headline "Meeting Stubborn Resistance at 50-Day Moving Average".
TXRH has a 96 Earnings Per Share Rating, well above the 80+ minimum guideline for buy candidates. It reported Jun '24 quarterly earnings +47% on +15% sales revenues versus the year-ago period. Sequential quarterly comparisons show impressive earnings growth rate acceleration. Annual earnings growth has been strong since a downturn in FY '20.
Chart courtesy of www.stockcharts.com
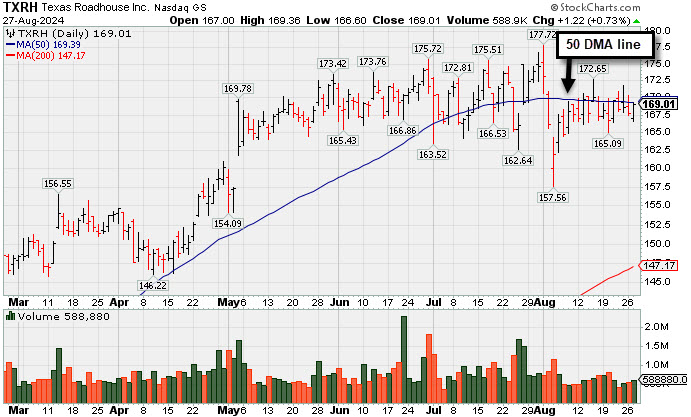
Meeting Stubborn Resistance at 50-Day Moving Average - Tuesday, August 27, 2024
Texas Roadhouse (TXRH +$1.22 or +0.73% to $169.01) posted a gain today with below-average volume and closed just below its 50-day moving average (DMA) line ($169.39) which is now downward sloping and has acted as resistance. Gains above the 50 DMA line are needed for its outlook to improve. A subsequent breakout to new highs backed byt at least +40% above average is needed to signal a technical buy signal. was highlighted in yellow with pivot point cited based on its 6/28/24 high plus 10 cents in the 7/26/24 mid-day report (read here). It was shown in greater detail that evening with an annotated graph iunder the headline "Encountered Distributional Pressure When Poised to Break Out".
TXRH has a 97 Earnings Per Share Rating, well above the 80+ minimum guideline for buy candidates. It reported Jun '24 quarterly earnings +47% on +15% sales revenues versus the year-ago period. Sequential quarterly comparisons show impressive earnings growth rate acceleration. Annual earnings growth has been strong since a downturn in FY '20.
Chart courtesy of www.stockcharts.com
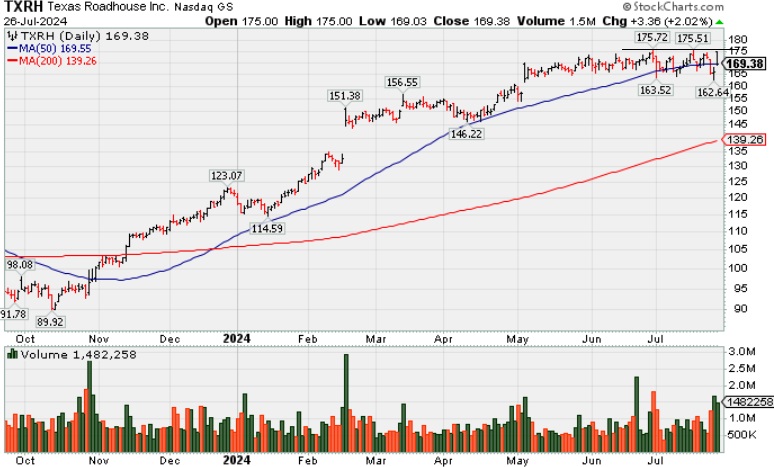
Encountered Distributional Pressure When Poised to Break Out - Friday, July 26, 2024
Texas Roadhouse (TXRH +$3.36 or +2.02% to $169.38) was highlighted in yellow with pivot point cited based on its 6/28/24 high plus 10 cents in the earlier mid-day report. It gapped up rebounding from below its 50-day moving average (DMA) line and rose within close striking distance of its all-time high, however it finished near the session low, action indicative of distributional pressure. Subsequent gains and a close above the pivot point backed by at least +40% above average volume may trigger a proper technical buy signal.
TXRH has a 96 Earnings Per Share Rating, well above the 80+ minimum guideline for buy candidates. It reported Jun '24 quarterly earnings +47% on +15% sales revenues versus the year-ago period. Sequential quarterly comparisons show impressive earnings growth rate acceleration. Annual earnings growth has been strong since a downturn in FY '20.