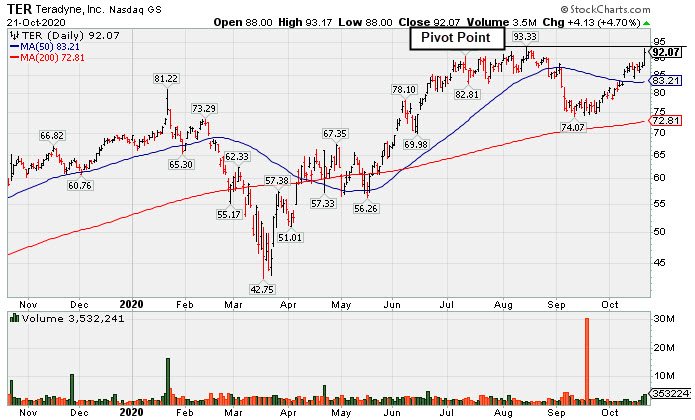
Traded +55.5% Higher in 3 Months Since Featured - Monday, January 25, 2021
Teradyne Inc (TER +$2.16 or +1.57% to $140.11) is quietly hovering near its all-time high after today's gain backed by below average volume, very extended from any sound base. Support to watch on pullbacks is its 50-day moving average (DMA) line ($119.48).
Recently it reported earnings +53% on +41% sales revenues for the Sep '20 quarter versus the year ago period, its 4th consecutive quarterly comparison with earnings above the +25% minimum earnings guideline (C criteria). Sequential comparisons show encouraging acceleration in its sales revenues growth rate. Its annual earnings (A criteria) history has been strong.
TER has traded up as much as +55.5% since it was highlighted in yellow with pivot point cited based on its 8/14/20 high plus 10 cents in the 10/21/20 mid-day report (read here). It was last shown in this FSU section on 12/30/20 with an annotated graph under the headline, "Perched Near Record High Very Extended From Any Sound Base".
Chart courtesy of www.stockcharts.com
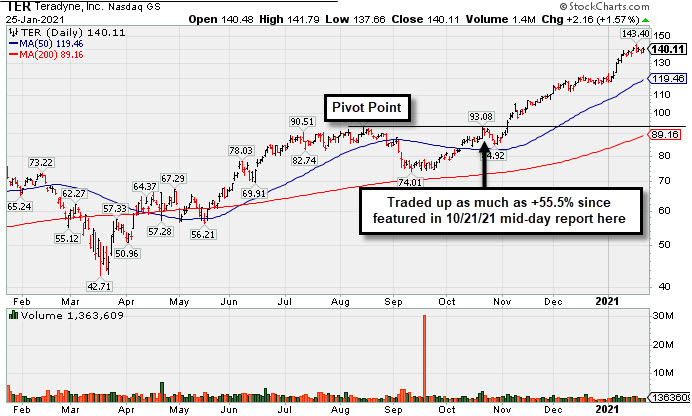
Perched Near Record High Very Extended From Any Sound Base - Wednesday, December 30, 2020
Teradyne Inc (TER +$3.09 or +2.64% to $120.29) is still perched near its all-time high, extended from any sound base and stubbornly holding its ground with volume totals cooling. Initial support to watch on pullbacks is its 50-day moving average (DMA) line ($106.47). Recently it reported earnings +53% on +41% sales revenues for the Sep '20 quarter versus the year ago period, its 4th consecutive quarterly comparison with earnings above the +25% minimum earnings guideline (C criteria). Sequential comparisons show encouraging acceleration in its sales revenues growth rate. Its annual earnings (A criteria) history has been strong.
TER has traded up as much as +32.7% since it was highlighted in yellow with pivot point cited based on its 8/14/20 high plus 10 cents in the 10/21/20 mid-day report (read here). It was last shown in this FSU section on 12/07/20 with an annotated graph under the headline, "Stubbornly Holding Ground and Rising for a New High".
Chart courtesy of www.stockcharts.com
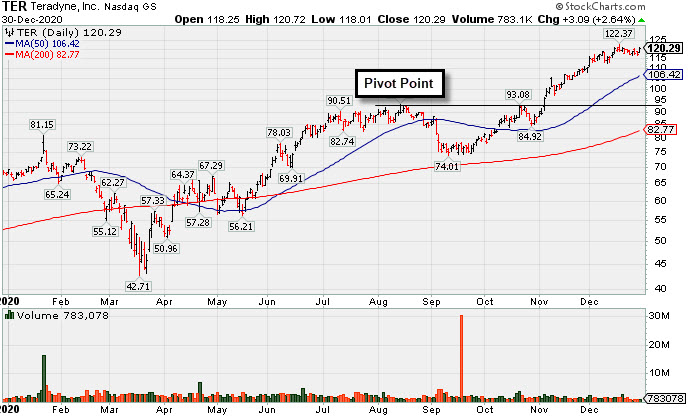
Stubbornly Holding Ground and Rising for a New High - Monday, December 7, 2020
Teradyne Inc (TER +$1.13 or +0.97% to $117.16) has been stubbornly holding its ground while rising, and it posted a small gain today with below average volume for another new all-time high close. Recently it reported earnings +53% on +41% sales revenues for the Sep '20 quarter versus the year ago period, its 4th consecutive quarterly comparison with earnings above the +25% minimum earnings guideline (C criteria). Sequential comparisons show encouraging acceleration in its sales revenues growth rate. Its annual earnings (A criteria) history has been strong.
TER was highlighted in yellow with pivot point cited based on its 8/14/20 high plus 10 cents in the 10/21/20 mid-day report (read here). Subsequent gains above the pivot point lacked the necessary +40% above average volume needed to trigger a proper technical buy signal. It was last shown in this FSU section on 11/11/20 with an annotated graph under the headline, "Recent Gains for New Highs Lacked Great Volume Conviction".
Chart courtesy of www.stockcharts.com
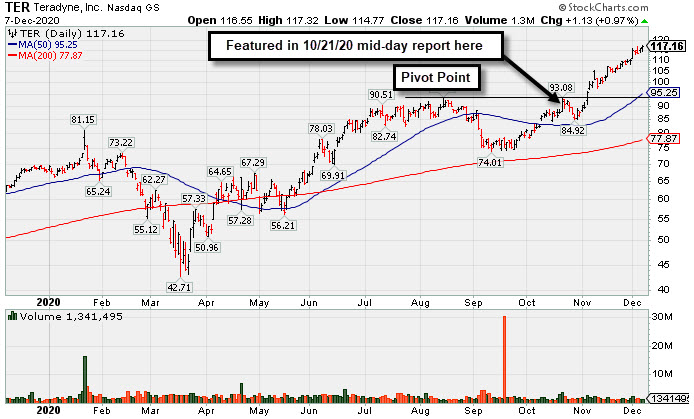
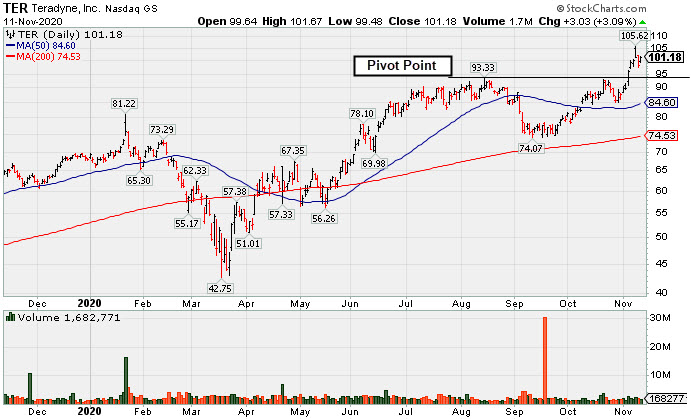
Recent Gains for New Highs Lacked Great Volume Conviction - Wednesday, November 11, 2020
Teradyne Inc (TER +$3.03 or +3.09% to $101.18) posted a gain today with below average volume for its second best ever close and its color code was changed to green after rising back above its "max buy" level. TER was highlighted in yellow with pivot point cited based on its 8/14/20 high plus 10 cents in the 10/21/20 mid-day report (read here). Subsequent gains above the pivot point lacked the necessary +40% above average volume needed to trigger a proper technical buy signal. It was last shown in this FSU section on 10/21/20 with an annotated graph under the headline, "Challenging All-Time High With Volume-Driven Gain".
The high-ranked ELECTRONICS - Semiconductor Equipment firm has 166 million shares outstanding (S criteria). The number of top-rated funds owning its shares rise from 1,149 in Dec '19 to 1,425 in Sep '20, a reassuring sign concerning the I criteria. Its current Up/Down Volume ratio of 0.8 is an unbiased indication its shares have been under distributional pressure over the past 50 days.
Chart courtesy of www.stockcharts.com
Challenging All-Time High With Volume-Drive Gain - Wednesday, October 21, 2020
Teradyne Inc (TER +$4.13 or +4.70% to $92.07) was highlighted in yellow with pivot point cited based on its 8/14/20 high plus 10 cents in the earlier mid-day report (read here) . It challenged its all-time high with today's 3rd consecutive gain backed by ever-increasing volume. A subsequent gain above the pivot point backed by at least +40% above average volume may trigger a technical buy signal.
It reported earnings +53% on +41% sales revenues for the Sep '20 quarter versus the year ago period, the company's 4th consecutive quarterly comparison with earnings above the +25% minimum earnings guideline (C criteria). Sequential comparisons recently showed encouraging acceleration in its sales revenues growth rate. Its annual earnings (A criteria) history has been strong.
It reported earnings +53% on +41% sales revenues for the Sep '20 quarter versus the year ago period, the company's 4th consecutive quarterly comparison with earnings above the +25% minimum earnings guideline (C criteria). Sequential comparisons recently showed encouraging acceleration in its sales revenues growth rate. Its annual earnings (A criteria) history has been strong.
Chart courtesy of www.stockcharts.com
