Met Resistance at 50-Day Moving Average - Tuesday, July 24, 2018
Extended From Prior Base After Spiking Higher - Wednesday, June 6, 2018
Pharmaceutical Firm Perched Near Record High - Tuesday, April 24, 2018
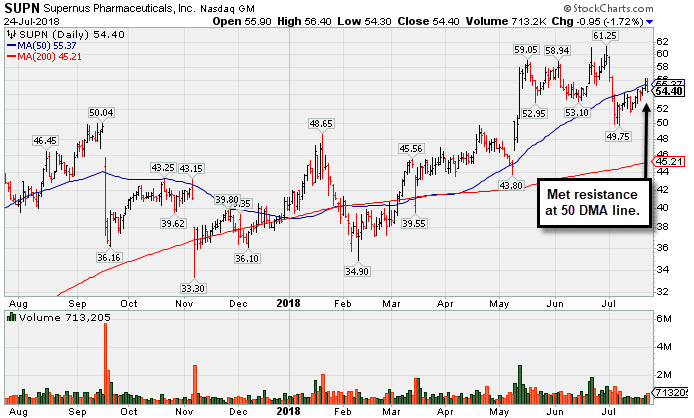
Met Resistance at 50-Day Moving Average - Tuesday, July 24, 2018
Supernus Pharmaceuticals (SUPN -$0.95 or -1.72% to $54.40) has met resistance near its 50-day moving average (DMA) line ($55.37). Deterioration below the recent low ($49.75 on 7/09/18) would raise more serious concerns.
The Rockville, MD based company was last shown in this FSU section on 6/06/18 with an annotated graph under the headline, "Extended From Prior Base After Spiking Higher". It was highlighted in yellow with pivot point cited based on its 9/18/17 high plus 10 cents in the 4/24/18 mid-day report (read here).
Sales revenues increases were in the +30-47% range while three of the past 5 quarterly earnings comparisons through Mar '18 were above the +25% minimum guideline (C criteria). Showed strong annual earnings (A criteria) growth since FY '15 after years of losses. The Medical - Biomed/Biotech industry group currently has an 93 Group Relative Strength Rating which indicates there has been additional leadership (L criteria) in the group.
The number of top-rated funds owning its shares rose from 412 in Jun '17 to 455 in Jun '18, a reassuring sign concerning the I criteria. Its current Up/Down Volume ratio of 1.5 is an unbiased indication its shares have been under accumulation over the past 50 days. Its small supply of only 51.8 million shares outstanding (S criteria) can contribute to greater volatility in the event of institutional buying or selling.
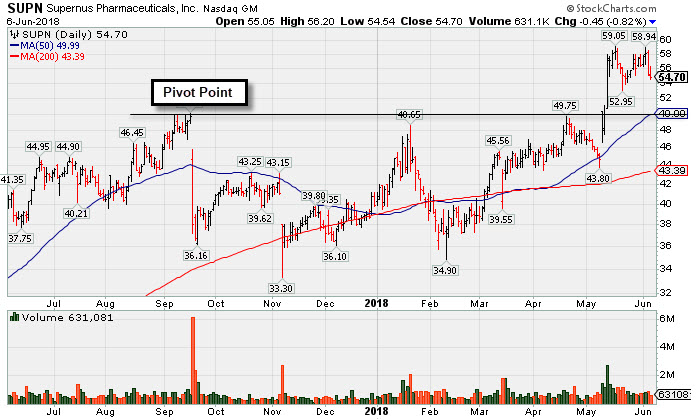
Extended From Prior Base After Spiking Higher - Wednesday, June 6, 2018
Supernus Pharmaceuticals (SUPN -$0.45 or -0.82% to $54.70) has been holding its ground near its all-time high, extended from the previously noted base. Prior highs in the $49-50 area define support to watch along with its 50-day moving average (DMA) line ($49.99).
The Rockville, MD based company was highlighted in yellow with pivot point cited based on its 9/18/17 high plus 10 cents in the 4/24/18 mid-day report (read here). It was last shown in this FSU section on 4/24/18 with an annotated graph under the headline, "Pharmaceutical Firm Perched Near Record High". It found support near its 50 DMA line during the consolidation afterward, and subsequent volume-driven gains for new highs (N criteria) above the pivot point triggered a technical buy signal
Sales revenues increases were in the +30-47% range while three of the past 5 quarterly earnings comparisons through Mar '18 were above the +25% minimum guideline (C criteria). Showed strong annual earnings (A criteria) growth since FY '15 after years of losses. The Medical - Biomed/Biotech industry group currently has an 87 Group Relative Strength Rating which indicates there has been additional leadership (L criteria) in the group.
The number of top-rated funds owning its shares rose from 412 in Jun '17 to 457 in Mar '18, a reassuring sign concerning the I criteria. Its current Up/Down Volume ratio of 1.6 is an unbiased indication its shares have been under accumulation over the past 50 days. Its small supply of only 51.8 million shares outstanding (S criteria) can contribute to greater volatility in the event of institutional buying or selling.
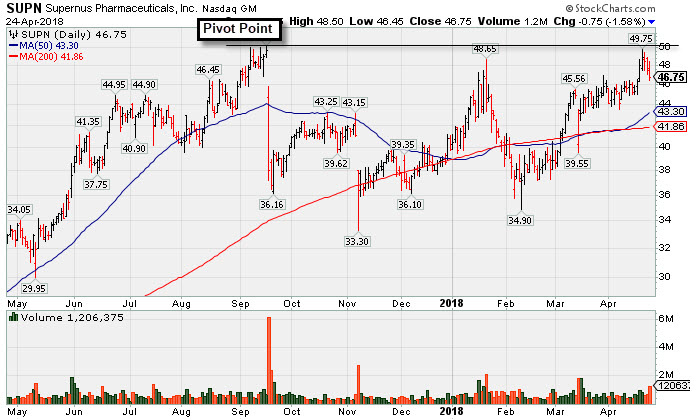
Pharmaceutical Firm Perched Near Record High - Tuesday, April 24, 2018
Supernus Pharmaceuticals (SUPN -$0.75 or -1.58% to $46.75) finished the session with a loss on above average volume, action indicative of distributional pressure. The Rockville, MD based company was highlighted in yellow with pivot point cited based on its 9/18/17 high plus 10 cents in the earlier mid-day report (read here). It is hovering within close striking distance of its all-time high. Subsequent gains for new highs (N criteria) above the pivot point backed by at least +40% above average volume are needed to trigger a technical buy signal.
Sales revenues increases were in the +30-47% range while three of the past 4 quarterly earnings comparisons through Dec '17 were above the +25% minimum guideline (C criteria). Showed strong annual earnings (A criteria) growth since FY '15 after years of losses. The Medical - Biomed/Biotech industry group currently has an 89 Group Relative Strength Rating which indicates there has been additional leadership (L criteria) in the group.
The number of top-rated funds owning its shares rose from 412 in Jun '17 to 441 in Mar '18, a reassuring sign concerning the I criteria. Its current Up/Down Volume ratio of 1./9 is an unbiased indication its shares have been under accumulation over the past 50 days. Its small supply of only 51.5 million shares outstanding (S criteria) can contribute to greater volatility in the event of institutional buying or selling.