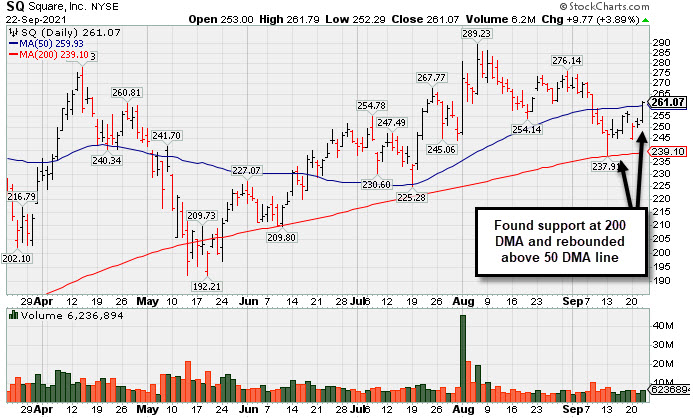
Found Support at 200-Day and Climbed Above 50-Day Moving Average - Wednesday, September 22, 2021
Square Inc Cl A (SQ +$9.77 or +3.89% to $261.07) rebounded above its 50-day moving average (DMA) line ($259.93) helping its outlook improve. It recently halted its slide at its 200-day moving average (DMA) line ($239) after damaging volume-driven losses. It is 9.7% off its high, and some resistance remains due to overhead supply. Subsequent volume-driven gains above the pivot point may trigger a technical buy signal.
SQ was highlighted in yellow with pivot point cited based on its high plus 10 cents in the 8/02/21 mid-day report (read here). It was last shown in this FSU section on 8/03/21 with an annotated graph under the headline "Pullback Following Big Gain on Strong Earnings and M&A News".
Fundamentals remain strong. Bullish action came after it reported Jun '21 quarterly earnings +267% on +143% sales revenues versus the year ago period. That marked its 4th strong comparison well above the +25% minimum guideline (C criteria). Its annual earnings (A criteria) history has been strong, and it has the highest possible Earnings Per Share Rating of 99.
The number of top-rated funds owning its shares rose from 1,542 in Sep '20 to 1,695 in Jun '21, a reassuring sign concerning the I criteria. Its current Up/Down Volume Ratio of 0.8 is an unbiased indication its shares have been under distributional pressure over the past 50 days. It has a Timeliness Rating of B and Sponsorship Rating of A. SQ completed its $9 IPO in Nov '15.
Charts courtesy www.stockcharts.com
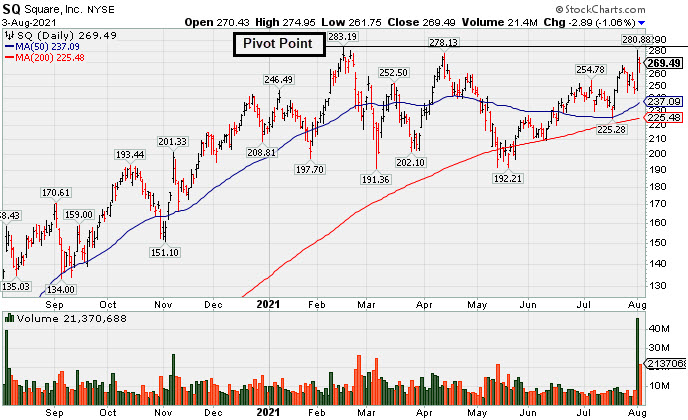
Pullback Following Big Gain on Strong Earnings and M&A News - Tuesday, August 3, 2021
Square Inc Cl A (SQ -$2.89 or -1.06% to $269.49) pulled back today after a big volume-driven gain on the prior session challenging its all-time high. Little resistance remains due to overhead supply. Subsequent volume-driven gains above the pivot point may trigger a technical buy signal. SQ was highlighted in yellow with pivot point cited based on its high plus 10 cents in the 8/02/21 mid-day report (read here).
Bullish action came following M&A news it will acquire Afterpay as it also reported Jun '21 quarterly earnings +267% on +143% sales revenues versus the year ago period. That marked its 4th strong comparison well above the +25% minimum guideline (C criteria). Its annual earnings (A criteria) history has been strong, and it has the highest possible Earnings Per Share Rating of 99.
The number of top-rated funds owning its shares rose from 1,542 in Sep '20 to 1,922 in Jun '21, a reassuring sign concerning the I criteria. Its current Up/Down Volume Ratio of 1.5 is also an unbiased indication its shares have been under accumulation over the past 50 days. It has a Timeliness Rating of A and Sponsorship Rating of A. SQ completed its $9 IPO in Nov '15.
Charts courtesy www.stockcharts.com
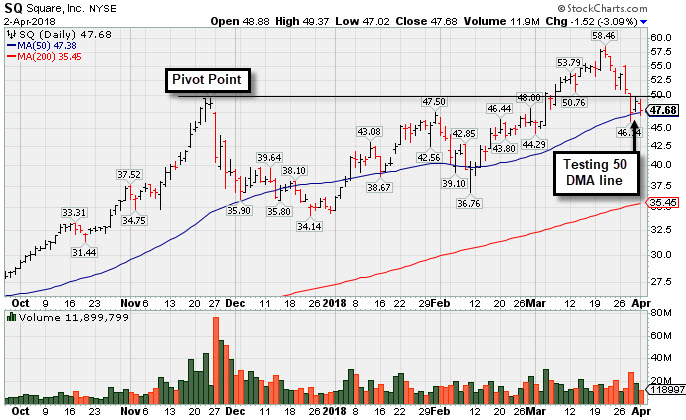
Slumped Back Into Prior Base Testing 50-Day Average - Monday, April 2, 2018
Square Inc Cl A (SQ -$1.52 or -3.09% to $47.68) suffered another big loss today but with lighter volume. More damaging losses would raise greater concerns. On 3/28/18 it was noted as it fell back into the prior base with a big loss on heavy volume, testing its 50-day moving average (DMA) line ($47.38) and prior highs in the $47-49 area defining important support.
It finished strong after highlighted in yellow with pivot point cited based on its 11/24/17 high plus 10 cents in the 3/05/18 mid-day report (read here). It hit a new all-time high and triggered a technical buy signal with +108% above average volume while rising from a choppy "late-stage" base.
Fundamentals remain strong. Recent quarterly comparisons through Dec '17 showed strong sales revenues growth acceleration and solid earnings increases versus the year-ago periods. Sales revenues rose by +21%, +22%, +26%, +33%, and +36% in the Dec 16, Mar, Jun, Sep and Dec '17 quarterly comparisons versus the year ago periods, respectively. Its limited annual earnings (A criteria) history remains a concern, yet it had a profitable FY '16 and bigger FY '17 following its $9 IPO in Nov '15.
The number of top-rated funds owning its shares rose from 314 in Mar '17 to 619 in Dec '17, a reassuring sign concerning the I criteria. Its current Up/Down Volume Ratio of 1.4 is also an unbiased indication its shares have been under accumulation over the past 50 days. It has a Timeliness Rating of A and Sponsorship rating of B.
Charts courtesy www.stockcharts.com
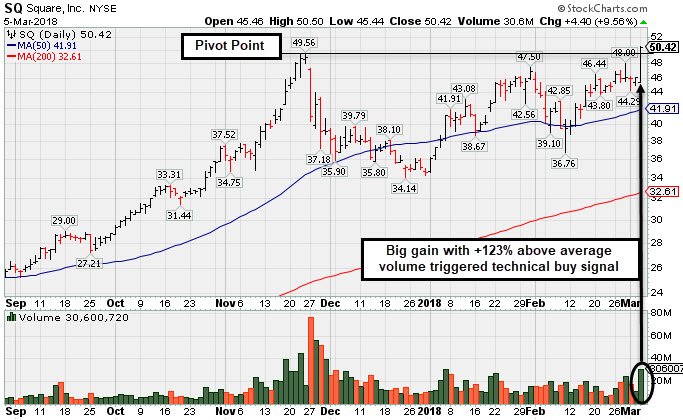
New High & Considerable Gain Backed By Twice Average Volume - Monday, March 5, 2018
Square Inc Cl A (SQ +$4.40 or +9.56% to $50.42) finished strong after highlighted in yellow with pivot point cited based on its 11/24/17 high plus 10 cents in the earlier mid-day report (read here). It hit a new all-time high today and triggered a technical buy signal with +108% above average volume while rising from a choppy "late-stage" base.
Recent quarterly comparisons through Dec '17 showed strong sales revenues growth acceleration and solid earnings increases versus the year-ago periods. Sales revenues rose by +21%, +22%, +26%, +33%, and +36% in the Dec 16, Mar, Jun, Sep and Dec '17 quarterly comparisons versus the year ago periods, respectively. Its limited annual earnings (A criteria) history remains a concern, yet it had a profitable FY '16 and bigger FY '17 following its $9 IPO in Nov '15.
The number of top-rated funds owning its shares rose from 314 in Mar '17 to 609 in Dec '17, a reassuring sign concerning the I criteria. Its current Up/Down Volume Ratio of 1.3 is also an unbiased indication its shares have been under accumulation over the past 50 days. It has a Timeliness Rating of A and Sponsorship rating of B.