Sputtering Below 50 Day Moving Average Hurts Outlook - Thursday, January 13, 2022
Pulling Back From All-Time High After Recent Rally - Tuesday, December 14, 2021
Breakaway Gap After 10-Week Flat Base - Wednesday, November 3, 2021
Sputtering Below 50 Day Moving Average Hurts Outlook - Thursday, January 13, 2022
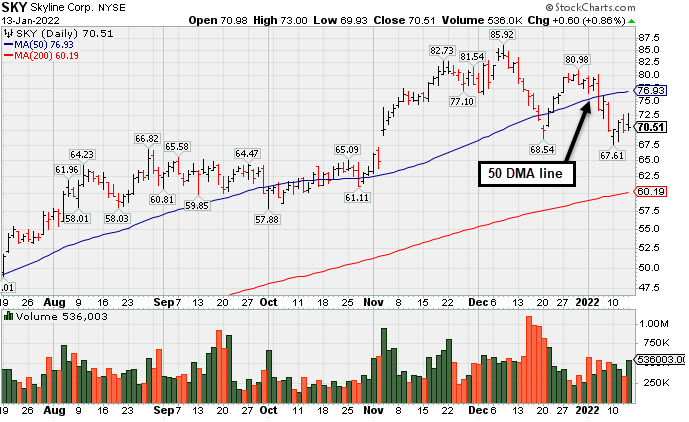
Skyline Corp (SKY +$0.60 or +0.86% to $70.51) has been sputtering and concerns only grow worse the longer it lingers below its 50-day moving average (DMA) line ($76.93). A rebound above the 50 DMA line is needed for its outlook to improve. Fundamentals remain strong.
SKY was first highlighted in yellow with pivot point cited based on its 8/27/21 high plus 10 cents in the 11/03/21 mid-day report (read here). It was last shown in this FSU section in greater detail on 12/14/21 with an annotated graph under the headline, "Breakaway Gap After 10-Week Flat Base".
Sep '21 quarterly earnings rose +187% on +63% sales revenues versus the year ago period. That marked its 3rd consecutive quarterly comparison well above the +25% minimum earnings guideline (C criteria). Its annual earnings (A criteria) history has been strong. It has the highest possible Earnings Per Share Rating of 99.
The number of top-rated funds owning its shares rose from 382 in Dec '20 to 464 in Dec '21,a reassuring sign concerning the I criteria. Its current Up/Down Volume Ratio of 1.2 is an unbiased indication its shares have been under accumulation over the past 50 days. It has a Timeliness Rating of A and a Sponsorship Rating of C.
Pulling Back From All-Time High After Recent Rally - Tuesday, December 14, 2021
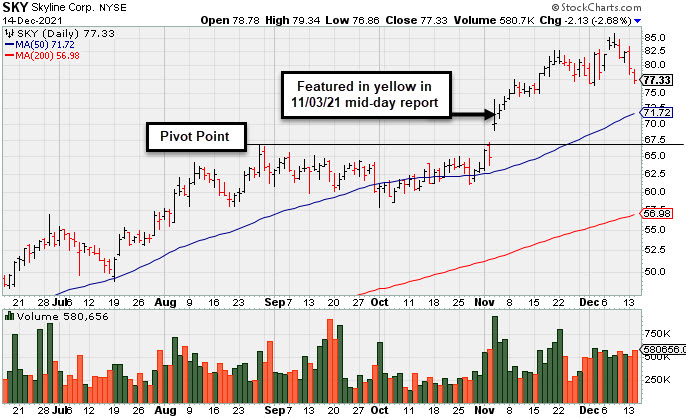
Skyline Corp (SKY -$2.13 or -2.68% to $77.33) suffered 2nd consecutive volume-driven loss today, encountering distributional pressure. Its 50-day moving average (DMA) line ($71.72) defines important near-term support to watch above prior highs in the $66 area.
SKY finished in the lower part of its intra-day range after highlighted in yellow with pivot point cited based on its 8/27/21 high plus 10 cents in the 11/03/21 mid-day report (read here). It was shown in greater detail that evening with an annotated graph under the headline, "Breakaway Gap After 10-Week Flat Base".
Bullish action came after it reported Sep '21 quarterly earnings +187% on +63% sales revenues versus the year ago period. That marked its 3rd consecutive quarterly comparison well above the +25% minimum earnings guideline (C criteria). Its annual earnings (A criteria) history has been strong. It has the highest possible Earnings Per Share Rating of 99.
The number of top-rated funds owning its shares rose from 382 in Dec '20 to 434 in Sep '21,a reassuring sign concerning the I criteria. Its current Up/Down Volume Ratio of 2.0 is an unbiased indication its shares have been under accumulation over the past 50 days. It has a Timeliness Rating of A and a Sponsorship Rating of C.
Breakaway Gap After 10-Week Flat Base - Wednesday, November 3, 2021
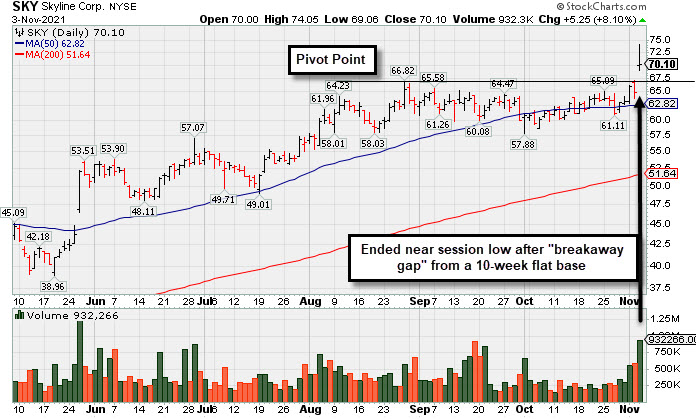
Skyline Corp (SKY +$5.25 or +8.10% to $70.10) finished in the lower part of its intra-day range after highlighted in yellow with pivot point cited based on its 8/27/21 high plus 10 cents in the earlier mid-day report (read here). It blasted to a new all-time high with today's "breakaway gap" which triggered a technical buy signal. It found support near its 50-day moving average (DMA) line ($62.82) in recent weeks while building an orderly flat base.
Bullish action came after it reported Sep '21 quarterly earnings +187% on +63% sales revenues versus the year ago period. That marked its 3rd consecutive quarterly comparison well above the +25% minimum earnings guideline (C criteria). Its annual earnings (A criteria) history has been strong. It has the highest possible Earnings Per Share Rating of 99.
The number of top-rated funds owning its shares rose from 382 in Dec '20 to 438 in Sep '21,a reassuring sign concerning the I criteria. Its current Up/Down Volume Ratio of 1.5 is an unbiased indication its shares have been under accumulation over the past 50 days. It has a Timeliness Rating of A and a Sponsorship Rating of C.