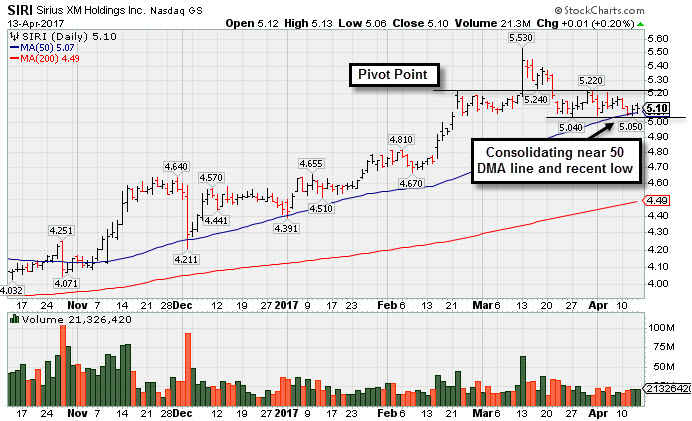
Consolidating Above Near-Term Support Level - Thursday, April 13, 2017
Sirius X M Holdings Inc (SIRI +$0.01 or +0.20% to $5.10) has been consolidating just above its 50-day moving average (DMA) line ($5.07) and recent low ($5.04 on 3/27/17). More damaging losses would raise greater concerns. Disciplined investors always limit losses by selling any stock that falls more than -7% from their purchase price.
SIRI stalled following its last appearance in this FSU section on 3/13/17 with an annotated graph under the headline "Breakout From Advanced Base Pattern Backed By Very Heavy Volume". It was highlighted in yellow with new pivot point cited based on its 2/12/16 high plus 10 cents in the earlier mid-day report (read here). It hit new multi-year highs (N criteria) with a big gain backed by nearly 3 times its average volume, well above the minimum of +40% above average volume needed to trigger a proper technical buy signal.
The Telecom Services - Cable /Satellite firm has an 89 Composite Rating. Its earnings increases have been above the +25% minimum guideline (C criteria) in 3 of the past 4 quarterly comparisons through Dec '16 while sales revenues growth was in the +9-11% range. Its annual earnings history (A criteria) has been improving since a downturn in FY '13.
It has a large supply of 4.71 billion shares outstanding. The number of top-ranted funds owning its shares rose from 628 in Mar '16 to 658 in Dec '16, a reassuring sign concerning the I criteria.
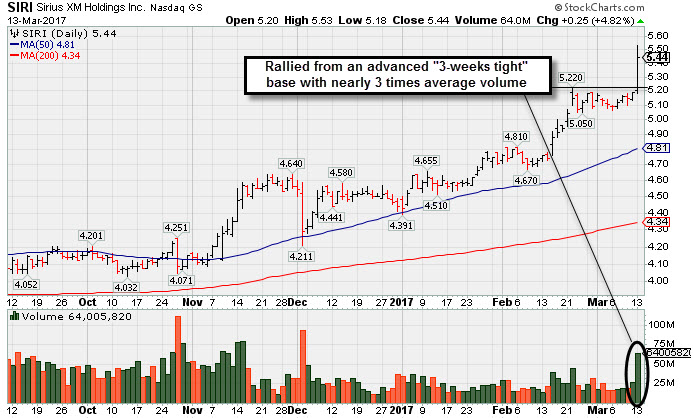
Breakout From Advanced Base Pattern Backed By Very Heavy Volume - Monday, March 13, 2017
Sirius X M Holdings Inc (SIRI +$0.25 or +4.82% to $5.44) was highlighted in yellow with new pivot point cited based on its 2/12/16 high plus 10 cents in the earlier mid-day report (read here). It hit new multi-year highs (N criteria) with a big gain backed by nearly 3 times its average volume, well above the minimum of +40% above average volume needed to trigger a proper technical buy signal. Disciplined investors avoid chasing stocks more than +5% above prior highs and always limit losses by selling any stock that falls more than -7% from their purchase price.
The high-ranked Telecom Services - Cable /Satellite firm's earnings increases have been above the +25% minimum guideline (C criteria) in 3 of the past 4 quarterly comparisons through Dec '16 while sales revenues growth was in the +9-11% range. Its annual earnings history (A criteria) has been improving since a downturn in FY '13.
It has a large supply of 4.71 billion shares outstanding. The number of top-ranted funds owning its shares rose from 628 in Mar '16 to 658 in Dec '16, a reassuring sign concerning the I criteria. Its current Up/Down Volume Ratio of 1.3 is an unbiased indication its shares have been under slight accumulation over the past 50 days.