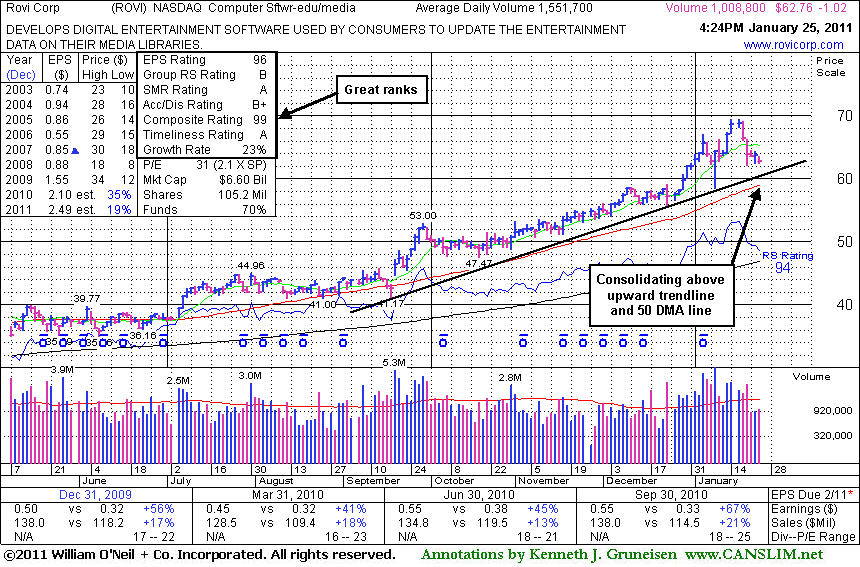
Rovi Corp (ROVI -$1.02 or -1.60% to $62.76) suffered another small loss on light volume today. Damaging distributional losses last week with above average have it now consolidating above an upward trendline connecting its September - January lows. That trendline defines initial chart support above its 50-day moving average (DMA) line and recent low near $58.50 defining more important support levels to watch. Violations may trigger technical sell signals and prompt investors to lock in profits. Meanwhile, if it continues its healthy consolidation another sound new base may form and offer another opportunity to accumulate shares without chasing it too far above prior chart highs.
Its last appearance in this FSU section with detailed analysis and an annotated graph was on 12/13/10 under the headline "Earnings Strength Underpins Digital Entertainment Firm." Strong sales revenues and earnings increases in quarterly comparisons show proof that its new (N criteria) digital entertainment software and services are in demand. It additionally confirmed the N criteria as it went on to rally to a new high of $69.50, which was +99% above the $34.87 pivot point first featured back on 2/25/10. The number of top-rated funds owning its shares rose from 671 in Dec '09 to 708 in Dec '10, a reassuring sign with respect to the I criteria.
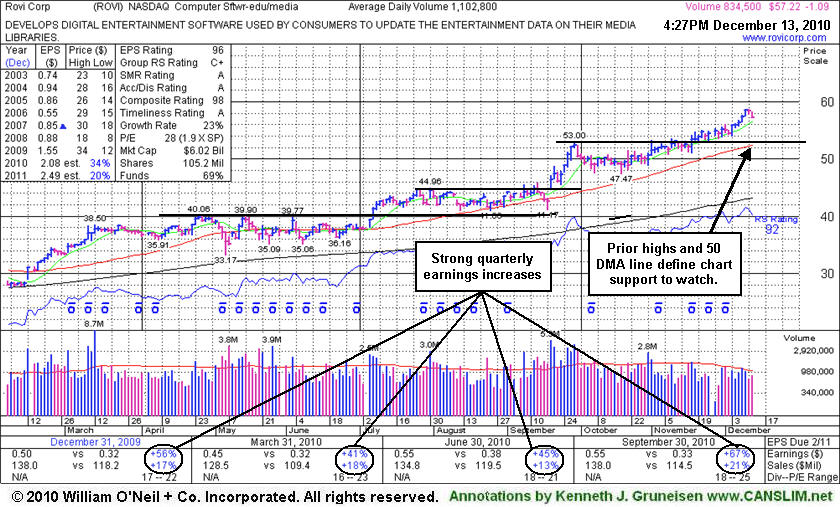
Rovi Corp (ROVI -$1.09 or -1.87% to $57.22) is perched near its 52-week high after recently wedging to new highs without great volume conviction behind its gains. Its color code was changed to green after getting extended from its latest base without enough volume behind gains in recent weeks to trigger a proper new (or add-on) technical buy signal. Meanwhile, its 50-day moving average (DMA) line and prior chart highs define important support to watch on pullbacks. Violations may trigger technical sell signals and prompt investors to lock in profits. Meanwhile, if it continues its healthy consolidation another sound new base may form and offer another opportunity to accumulate shares without chasing it too far above prior chart highs.
The number of top-rated funds owning its shares rose from 671 in Dec '09 to 717 in Sept '10, a very reassuring sign with respect to the I criteria. Its stronger (+21%) sales revenues increase in the latest quarter ended September 30, 2010 was better than prior revenue growth comparisons, which was encouraging to see while its +67% earnings increase (strong C criteria) was better than prior periods.
ROVI has traded up as much as +73.5% above its $34.87 pivot point first featured back on 2/25/10. While trading about a buck below its pivot point, it was then shown with an annotated graph under the headline "High-Ranked Computer Software - Security Firm Perched Near Highs" after building long base-on-base type patterns. In July it broke out again, then spent many weeks base building yet again. A single close below its 50-day moving average (DMA) line on 9/17/10 was promptly followed by a big gap up gain with 5.3 million shares. That "breakaway gap" was a sign of hearty buying demand from the institutional crowd (I criteria) as it blasted to a new 52-week high (N criteria) and confirmed a new technical buy signal.
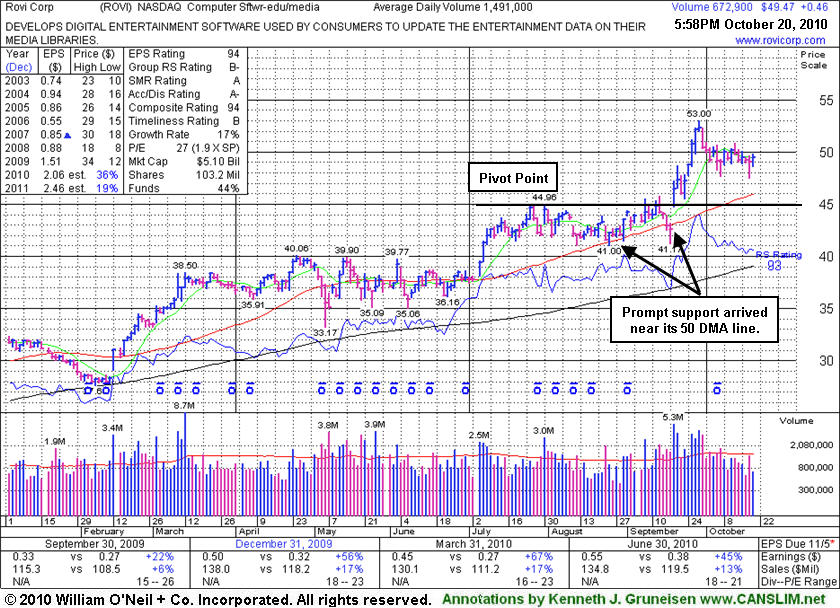
Rovi Corp (ROVI +$0.46 or +0.94% to $49.47) posted a small gain today on lighter volume. It had finished in the upper third of its intra-day range on the prior session after briefly trading under its 10/07/10 low. Its short-term average served as support since its last appearance in this FSU section on 8/24/10 under the headline "Near 50 DMA and Important Support After Loss On Heavy Volume" after sinking near its 50-day moving average (DMA) line. A single close below that important short-term average on 9/17/10 was promptly followed by a big gap up gain with 5.3 million shares. That "breakaway gap" was a sign of hearty buying demand from the institutional crowd (I criteria) as it blasted to a new 52-week high (N criteria) and confirmed a new technical buy signal.
ROVI has traded up more than +47% since first featured on 2/25/10 (read here), after building long base-on-base type patterns. Prior resistance in the $45 area and its 50 DMA line define important support to watch now. Violations may trigger technical sell signals and prompt investors to limit losses or lock in profits. Meanwhile, if it continues its healthy consolidation another sound new base may form and offer another opportunity to accumulate shares without chasing it too far above prior chart highs.
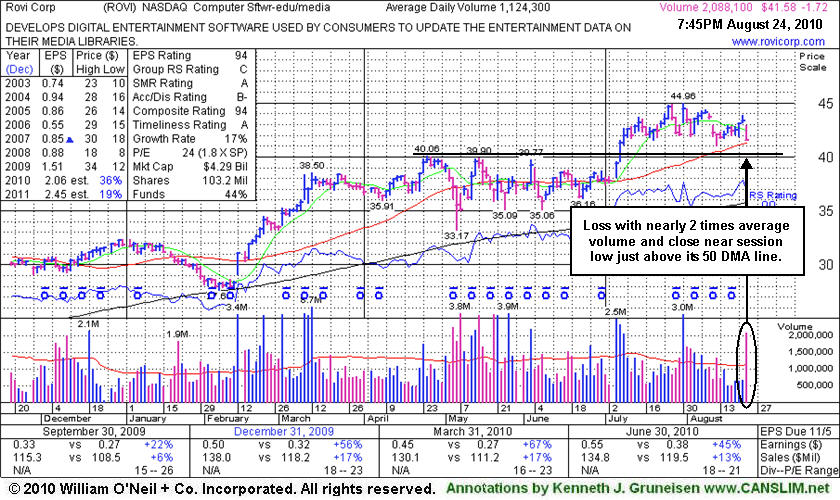
Rovi Corp (ROVI -$1.72 or -3.96% to $41.58) gapped down today for a loss with nearly 2 times average volume, sinking near its 50-day moving average line. Below that important short-term average support is defined by prior chart resistance in the $40 area. Violations may trigger technical sell signals and prompt investors to limit losses or lock in profits, especially with broader market weakness (the M criteria) recently raising concerns. Meanwhile, it is reassuring that its earnings per share increases in 3 of the past 4 quarterly comparisons versus the year ago period showed better than +25% growth and it has a decent annual earnings track record in recent years. However, the M criteria of the investment system argues that 3 out of 4 stocks will follow along with the direction of the broader market averages. Members who are following along with recently published market commentaries have seen numerous reasons cited for increased caution.
Volume and volatility often increase near earnings news, and investors should be especially watchful during earnings season. It is important to watch the market's reaction to the latest earnings news and guidance. Fundamental news of significance can lead to great and immediate impact on the price and volume of trading.
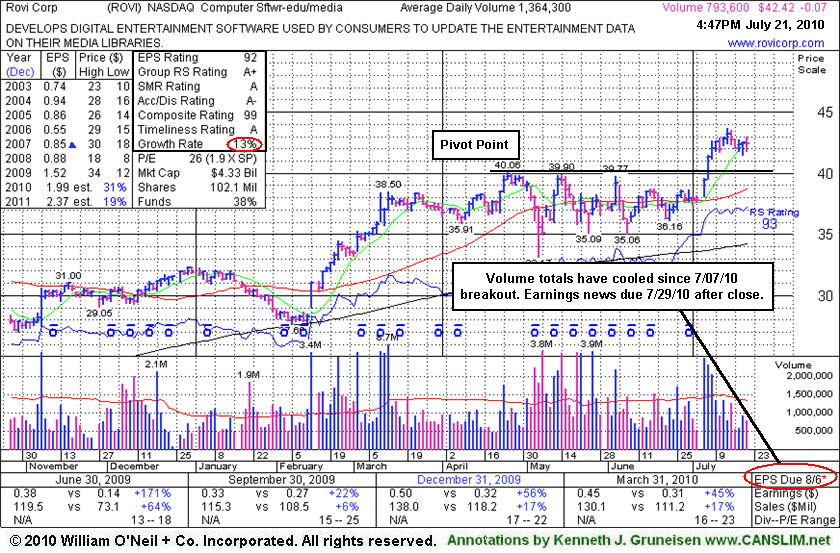
Rovi Corp (ROVI -$0.07 or -0.16% to $42.42) has announced that earnings results for the quarter ended June 30, 2010 will be released on 7/29/10 after the close, not on the date indicated on the annotated graph below. Volume totals have cooled while it has been holding its ground stubbornly just -3% off its 52-week high. Now consolidating slightly above its "max buy" level, its color code was changed to green. Support is defined by prior chart resistance in the $40 area and its 50-day moving average (DMA) line. When last shown in this FSU section under the headline "Outlook Better For High-Ranked Computer Software Firm" on 6/28/2010 we observed - "not a great deal of resistance due to overhead supply. Disciplined investors will await a convincing gain above its pivot point with heavy volume to trigger a new buy signal." A streak of powerful gains soon followed, including its 7/07/10 gain with heavy volume that triggered the latest technical buy signal. Its annual earnings growth (see red circle) has not been especially strong over a 5-year span. Earnings per share increases in 3 of the past 4 quarterly comparisons versus the year ago period showed better than +25% growth.
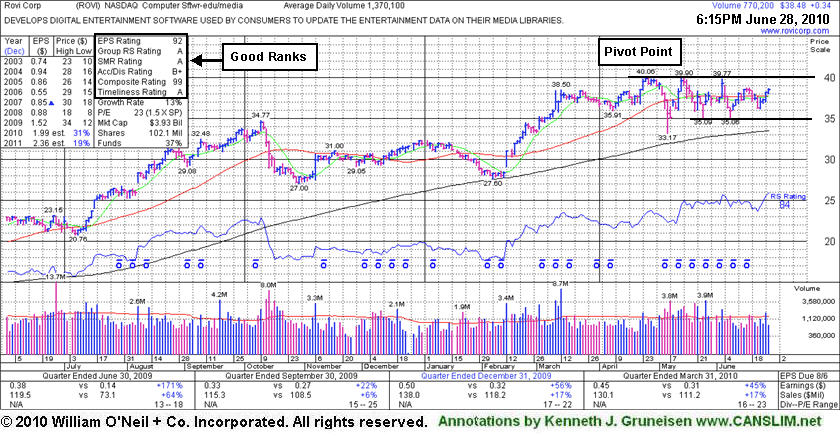
Rovi Corp (ROVI +$0.34 or +0.89% to $38.48) posted a 4th consecutive gain today that helped it climb further above its 50-day moving average (DMA) line to finish the session less than -4% off its 52-week high. Its rebound above its short-term average line helped its outlook improve, and its color code was changed to yellow again. There is not a great deal of resistance due to overhead supply. Disciplined investors will await a convincing gain above its pivot point with heavy volume to trigger a new buy signal. It makes a good candidate to have on investors' watch list, meanwhile the broader market (M criteria) action has been recently lacking leadership and enduring distributional pressure after the latest follow-through day confirmed a new rally. If the rally resumes, odds may favor this high-ranked leader continuing higher after another breakout might offer an ideal point for new or add-on buying efforts.
Its 4/23/10 gain for a new all-time high helped it clear a fresh base but was noted as it lacked sufficient volume to trigger a proper new technical buy signal. Earlier, ROVI had triggered a technical buy signal with a high-volume gain on 3/02/10 that may have signaled the beginning of a substantial advance, but thus far it made limited progress. Earnings per share increases in 3 of the past 4 quarterly comparisons versus the year ago period showed better than +25% growth.
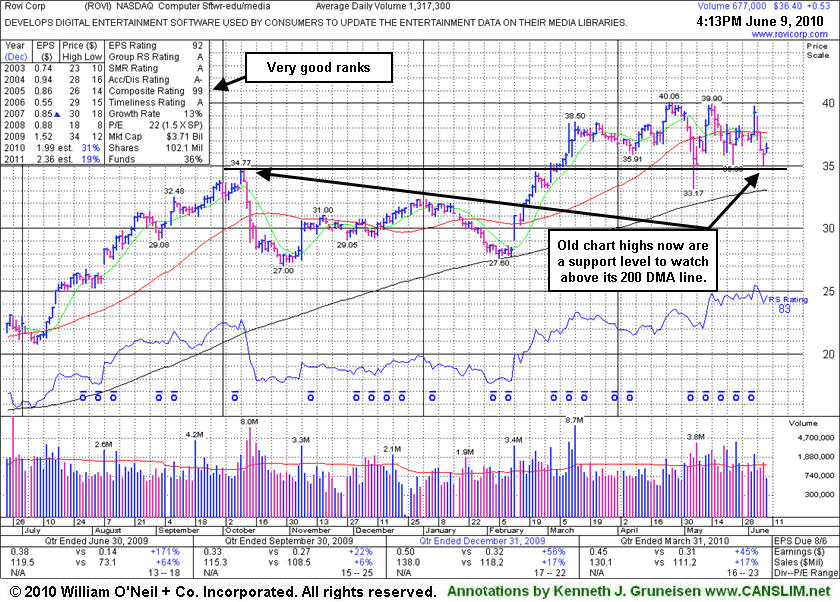
Rovi Corp (ROVI +$0.58 or +1.62% to $36.45) traded up on lighter volume today. Concerns increase the longer it continues to linger under its 50-day moving average (DMA) line. Meanwhile, its old chart high ($34.77) is now a support level to watch above its 200 DMA line. Its 50 DMA line may now act as resistance, while a convincing gain above that important short-term average line would help its outlook improve. There is not a great deal of resistance due to overhead supply while it is trading about -9% off its 52-week high. It makes a good candidate to have on investors' watch list until a new confirmed rally, meanwhile broader market action (M criteria) may be expected to adversely impact 3 out of 4 stocks.
Its 4/23/10 gain for a new all-time high helped it clear a fresh base but was noted as it lacked sufficient volume to trigger a proper new technical buy signal. Earlier, ROVI had triggered a technical buy signal with a high-volume gain on 3/02/10 that may have signaled the beginning of a substantial advance, but thus far it made limited progress. Earnings per share increases in 3 of the past 4 quarterly comparisons versus the year ago period showed better than +25% growth.
Rovi Corp (ROVI -$0.73 or -1.94% to $36.83) recently endured distributional pressure, and while it is now trading just below its 50-day moving average (DMA) line, it is also consolidating only -7% from its 52-week high without a great deal of resistance due to overhead supply. It makes a good candidate to have on investors' watch list until a new confirmed rally, meanwhile broader market action (M criteria) may be expected to adversely impact 3 out of 4 stocks. Its 50 DMA line may now act as resistance, while a convincing gain above that important short-term average line would help its outlook improve. Its recent chart low ($33.17) defines near-term chart support above its 200 DMA line. Its 4/23/10 gain for a new all-time high helped it clear a fresh base but was noted as it lacked sufficient volume to trigger a proper new technical buy signal. Earlier, ROVI had triggered a technical buy signal with a high-volume gain on 3/02/10 that may have signaled the beginning of a substantial advance, but thus far it made limited progress. Earnings per share increases in 3 of the past 4 quarterly comparisons versus the year ago period showed better than +25% growth.
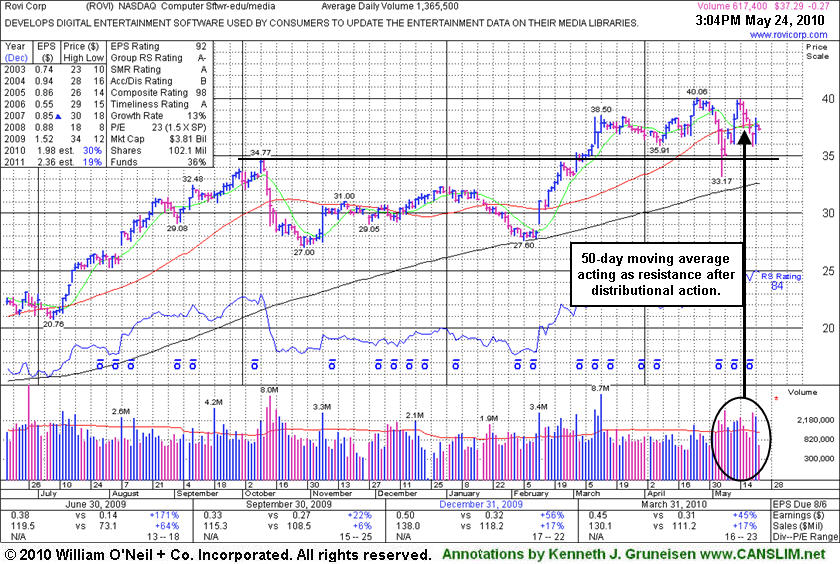
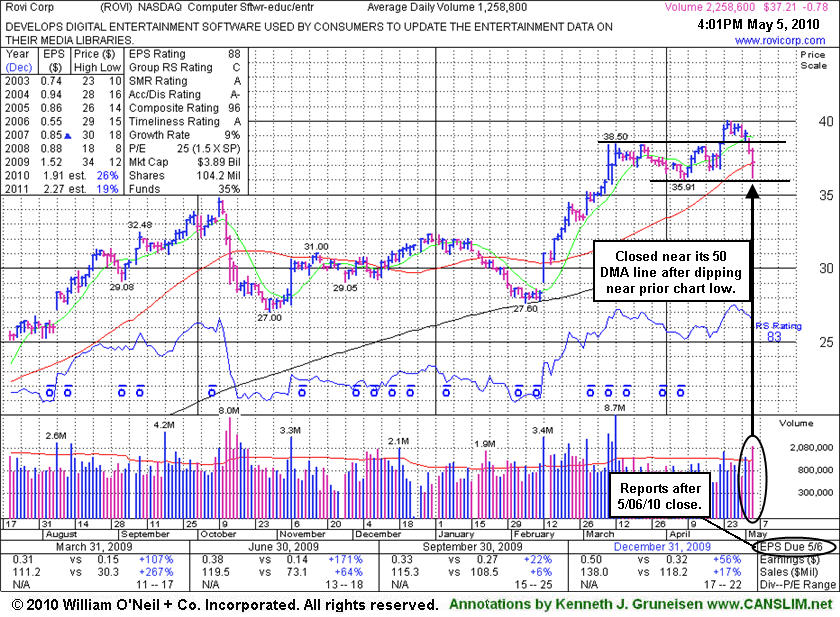
Rovi Corp (ROVI -$0.78 or -2.05% to $37.21) ended near its 50-day moving average (DMA) line, closing today's session in the middle of its intra-day range after undercutting that important short-term average earlier and dipping near its recent chart low. Its color code was changed to green based on the distributional action ahead of earnings news due Thursday, May 6th after the close. More damaging losses under its 50 DMA and recent chart lows would raise more serious concerns. Its 4/23/10 gain for a new all-time high lacked sufficient volume to trigger a proper new technical buy signal. Earlier, ROVI had triggered a technical buy signal with a high-volume gain on 3/02/10 that may have signaled the beginning of a substantial advance, but thus far it made limited progress. Broader market action (M criteria) is normally expected to impact 3 out of 4 stocks, and widespread losses are adding to concerns about the current rally's tenacity.
Volume and volatility often increase near earnings news. It is important to remain disciplined while also watching out for whipsaw-like action. Earnings per share increases in 3 of the past 4 quarterly comparisons versus the year ago period showed better than +25% growth.
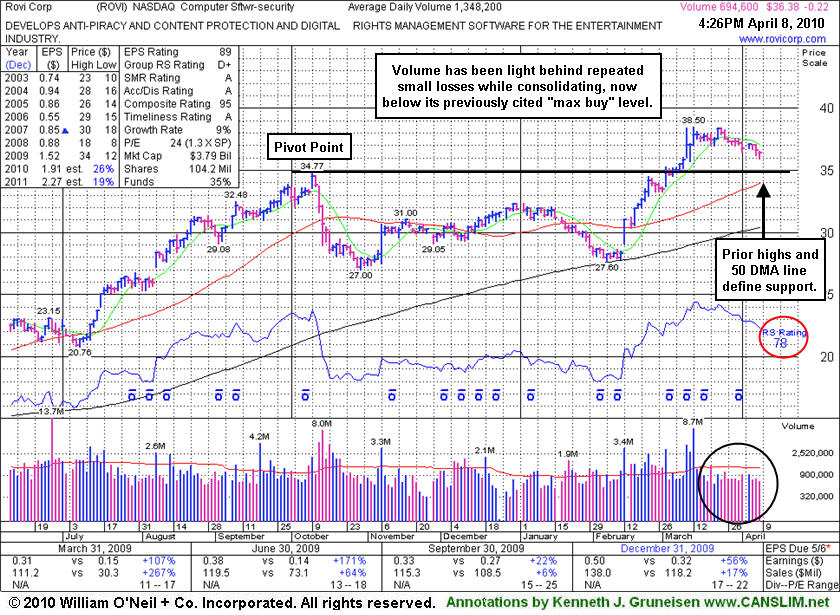
Rovi Corp (ROVI -$0.22 or -0.60% to $36.38) has been consolidating in a tight range with volume cooling for the past 4 weeks, hovering within close striking distance of its all-time high. Now it has drifted under its "max buy" level, so disciplined investors might consider it an ideal time to accumulate shares. Its color code was changed to yellow. Prior chart highs and its 50-day moving average (DMA) line coincide in the $34 area, defining an important support level to watch on pullbacks. Since its last appearance with an annotated graph in this FSU section on 3/17/10 under the headline Software - Security Firm Extended After Volume Driven Gains the high-ranked Computer Software - Security firm has been consolidating in a tight trading range.
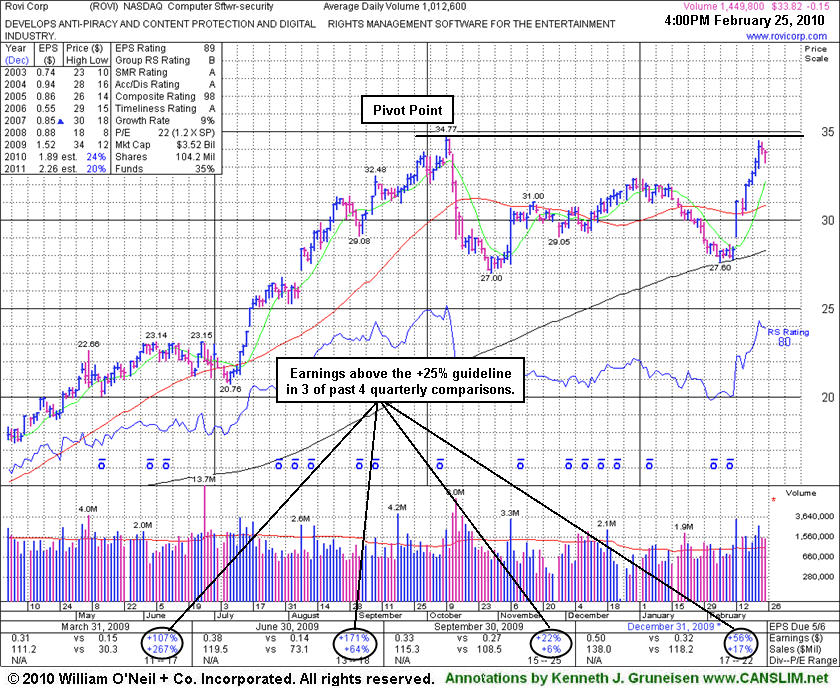
ROVI triggered a technical buy signal with a high volume gain on 3/02/10. That was followed by a streak of 8 consecutive gains that included 3 consecutive gains into new high ground on heavy volume. It was featured in yellow with pivot point based upon its 10/09/09 high noted during its 2/25/10 mid-day report appearance (read here). Its subsequent breakout and ability to rally to a new 52-week high with at least +50% above average volume behind the gain may have signaled the beginning of a substantial advance. Earnings per share increases in 3 of the past 4 quarterly comparisons versus the year ago period showed better than +25% growth.
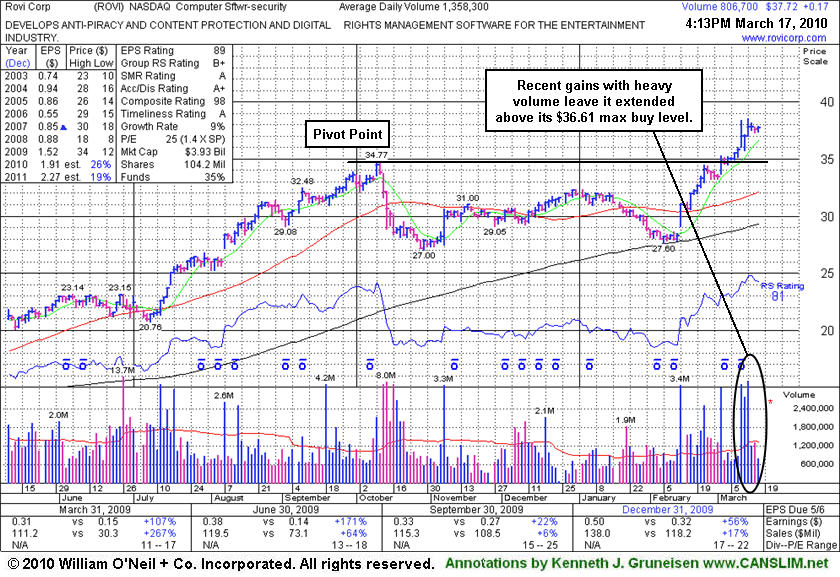
Rovi Corp (ROVI +$0.13 or +0.35% to $37.68) posted a small gain today with below average volume. Since its last appearance with an annotated graph in this FSU section on 2/25/10 under the headline "High-Ranked Computer Software - Security Firm Perched Near Highs" the high-ranked Computer Software - Security firm triggered a technical buy signal with a high volume gain on 3/02/10. That was followed by a recent streak of 8 consecutive gains that included 3 consecutive gains into new high ground on heavy volume. Now it is extended from a sound base and trading above its "max buy" level, so disciplined investors would avoid chasing it and wait for another ideal time to accumulate shares. Meanwhile, prior chart highs in the $34 area define an important support level to watch on pullbacks.
ROVI was featured in yellow with pivot point based upon its 10/09/09 high noted in the 2/25/10 mid-day report (read here). Its subsequent breakout and ability to rally to a new 52-week high with at least +50% above average volume behind the gain may have signaled the beginning of a substantial advance. Earnings per share increases in 3 of the past 4 quarterly comparisons versus the year ago period showed better than +25% growth.
Rovi Corp (ROVI -$0.15 or -0.44% to $33.82) is consolidating after gains earlier this week helped it challenge its 52-week high. Today it was featured in yellow with pivot point based upon its 10/09/09 high noted in the mid-day report (read here). Recent gains helped it rally to new 2010 highs, however its subsequent ability to rally to a new 52-week high with at least +50% above average volume behind the gain could signal the beginning of a more substantial advance. Earnings per share increases in 3 of the past 4 quarterly comparisons versus the year ago period showed better than +25% growth.
Meanwhile, as the major averages (M criteria) have yet to produce a follow-through-day to confirm the latest rally attempt, it could spend more time consolidating on the right side of its near 4-month base. Disciplined investors would be patient and not force action without the critical reassurances of heavy institutional buying demand in the market and for this specific firm's shares.