There are 3 more featured stock write-ups on since to 1/6/2025
Recent Slump Below 50-Day Moving Average Raised Concerns - Monday, November 18, 2024
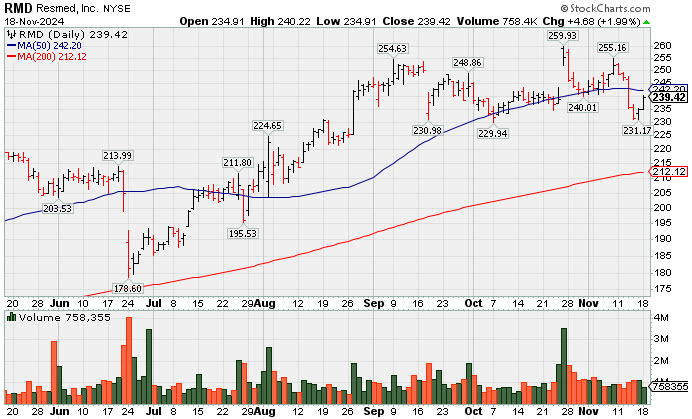
ResMed Medical-Products (RMD +$4.68 or +1.99% to $239.42) posted a gain rebounding toward its 50-day moving average ($242.64) which may now act as resistance. Losses last week violated its 50 DMA line triggering a technical sell signal. A prompt rebound above the 50 DMA line is needed for its outlook to improve.
RMD was highlighted in yellow in the 10/25/24 mid-day report (read here) with pivot point cited based on its 9/09/24 high plus 10 cents after it gapped up hitting new multi-year highs. Although it triggered a triggered a technical buy signal, the very next day's loss and close back below the pivot point promptly negated the breakout raising concerns. It was last shown in this FSU section on 10/28/24 with an annotated graph under the headline, "ResMed Negated Friday's Breakout Raising Concerns". Confirming gains for new highs would be a reassuring signing of fresh institutional buying demand that could lead to a sustained and meaningful advance.
RMD has a 96 Earnings Per Share Rating, well above the 80+ minimum guideline for buy candidates. It reported earnings +34% on +31% sales revenues for the Sep '24 quarter versus the year-ago period, marking its 3rd strong comparison above the +25% minimum earnings guideline (C criteria). Annual earnings (A criteria) growth has been steady.
The number of top-rated funds owning its shares rose from 1,739 in Dec '23 to 1,931 in Sep '24, a reassuring sign concerning the I criteria. Its current Up/Down Volume Ratio of 1.1 is an unbiased indication its shares have been under accumulation over the past 50 days.
| Symbol/Exchange Company Name Industry Group | PRICE | CHANGE | Day High | Volume (% DAV) (% 50 day avg vol) | 52 Wk Hi | Featured Date | Price Featured | Pivot Featured |
| Max Buy | ||||||||
U.S. Lime & Minerals Bldg-Cement/Concrt/Ag | $143.14 | +1.93 1.37% | $145.63 | 66,898 50 DAV is 70,000 | $146.70 -2.43% | 9/17/2024 | $71.26 | PP = $87.23 |
| MB = $91.59 | ||||||||
G - Hovering near its all-time high, holding its ground following a noted spurt of volume-driven gains. Its 50 DMA line ($105.48) defines important near-term support to watch on pullbacks. >>> FEATURED STOCK ARTICLE : Extended From Any Sound Base After Impressive Rally - 11/12/2024 | View all notes | Set NEW NOTE alert | Company Profile | SEC News | Chart | Request a new note | ||||||||
Granite Construction Bldg-Heavy Construction | $96.45 | +0.84 0.88% | $97.80 | 356,299 50 DAV is 698,000 | $99.32 -2.89% | 6/11/2024 | $59.76 | PP = $64.33 |
| MB = $67.55 | ||||||||
| Most Recent Note - 11/13/2024 5:48:02 PM G - Perched near its all-time high, holding its ground while very extended from any sound base. Bullish action has come after it reported Sep '24 quarterly earnings +19% on +14% sales revenues versus the year-ago period, below the +25% minimum guideline (C criteria) of the fact-based investment system. >>> FEATURED STOCK ARTICLE : Extended From Base After Streak of Gains for New Highs - 11/8/2024 | View all notes | Set NEW NOTE alert | Company Profile | SEC News | Chart | Request a new note | ||||||||
Texas Roadhouse Retail-Restaurants | $195.77 | -2.22 -1.12% | $199.04 | 556,909 50 DAV is 740,000 | $203.32 -3.71% | 7/26/2024 | $173.08 | PP = $175.82 |
| MB = $184.61 | ||||||||
G - Volume totals have still been cooling while hovering near its all-time high. Its 50 DMA line ($181) and prior highs in the $177-180 area define important support to watch on pullbacks. >>> FEATURED STOCK ARTICLE : Hovering Near High After Recent Volume-driven Gains - 11/15/2024 | View all notes | Set NEW NOTE alert | Company Profile | SEC News | Chart | Request a new note | ||||||||
Howmet Aerospace Aerospace/Defense | $113.17 | +1.16 1.04% | $113.44 | 1,816,734 50 DAV is 2,236,000 | $116.74 -3.06% | 7/30/2024 | $93.95 | PP = $85.52 |
| MB = $89.80 | ||||||||
G - Hovering near its all-time high, extended from any sound base. Its prior high ($106.93 on 10/21/24) and 50 DMA line ($102.75) define near-term support levels to watch on pullbacks. Fundamentals remain strong. >>> FEATURED STOCK ARTICLE : Found Support at 50-Day Moving Average Line Before Earnings Report - 11/5/2024 | View all notes | Set NEW NOTE alert | Company Profile | SEC News | Chart | Request a new note | ||||||||
Natural Grocers Retail-Super/Mini Mkts | $32.93 | +0.09 0.27% | $33.46 | 64,570 50 DAV is 88,000 | $34.76 -5.26% | 11/5/2024 | $30.57 | PP = $30.42 |
| MB = $31.94 | ||||||||
| Most Recent Note - 11/13/2024 5:50:00 PM G - Pulled back from its all-time high with today''s loss on lighter volume breaking a streak of 6 consecutive gains marked by higher volume. Prior high in the $30 area defines initial support to watch above its 50 DMA line ($28.18). >>> FEATURED STOCK ARTICLE : New High After 6th Consecutive Gain - 11/11/2024 | View all notes | Set NEW NOTE alert | Company Profile | SEC News | Chart | Request a new note | ||||||||
| Symbol/Exchange Company Name Industry Group | PRICE | CHANGE | Day High | Volume (% DAV) (% 50 day avg vol) | 52 Wk Hi | Featured Date | Price Featured | Pivot Featured |
| Max Buy | ||||||||
Celestica Elec-Contract Mfg | $83.97 | +1.79 2.18% | $86.40 | 2,385,407 50 DAV is 2,266,000 | $87.99 -4.57% | 10/11/2024 | $57.62 | PP = $63.59 |
| MB = $66.77 | ||||||||
G - Gapped up today for a gain challenging its all-time high but it ended near the session low. It is very extended from any sound base. The prior highs in the $63 area define initial support to watch on pullbacks. >>> FEATURED STOCK ARTICLE : Pulling Back After Considerable Rally - 11/13/2024 | View all notes | Set NEW NOTE alert | Company Profile | SEC News | Chart | Request a new note | ||||||||
Paymentus Holdings Finance-CrdtCard/PmtPr | $35.22 | +1.72 5.13% | $35.50 | 878,390 50 DAV is 304,000 | $37.00 -4.81% | 10/17/2024 | $26.15 | PP = $25.31 |
| MB = $26.58 | ||||||||
G - Posting another volume-driven gain today. Held its ground after spiking higher on 11/13/24 when it reported Sep '24 quarterly earnings +67% on +52% sales revenues versus the year ago period. It found support near prior highs in the $24-25 area during the recent consolidation. See the latest FSU analysis for more details and an annotated graph. >>> FEATURED STOCK ARTICLE : Extended From Prior Base After Considerable Spike Higher - 11/14/2024 | View all notes | Set NEW NOTE alert | Company Profile | SEC News | Chart | Request a new note | ||||||||
ResMed Medical-Products | $239.42 | +4.68 1.99% | $240.22 | 756,885 50 DAV is 1,071,000 | $260.49 -8.09% | 10/25/2024 | $256.64 | PP = $255.28 |
| MB = $268.04 | ||||||||
G - Rebounded toward its 50 DMA line ($242.64) which may act as resistance. Losses last week violated its 50 DMA line triggering a technical sell signal. A prompt rebound is needed for its outlook to improve. See the latest FSU analysis for more details and a new annotated graph. >>> FEATURED STOCK ARTICLE : Recent Slump Below 50-Day Moving Average Raised Concerns - 11/18/2024 | View all notes | Set NEW NOTE alert | Company Profile | SEC News | Chart | Request a new note | ||||||||
Adtalem Global Education Consumer Svcs-Education | $87.34 | +0.14 0.16% | $88.20 | 409,827 50 DAV is 376,000 | $92.93 -6.02% | 10/30/2024 | $83.34 | PP = $80.28 |
| MB = $84.29 | ||||||||
| Most Recent Note - 11/14/2024 5:09:13 PM G - Pulled back today with +28% above average volume, retreating toward its "max buy" level. It quickly got extended from the previously noted base with a noted spurt of volume-driven gains. Prior highs in the $80 area define initial support to watch. Fundamentals remain strong. >>> FEATURED STOCK ARTICLE : Holding Ground Following Recent Technical Breakout - 11/4/2024 | View all notes | Set NEW NOTE alert | Company Profile | SEC News | Chart | Request a new note | ||||||||
ResMed Negated Friday's Breakout Raising Concerns - Monday, October 28, 2024
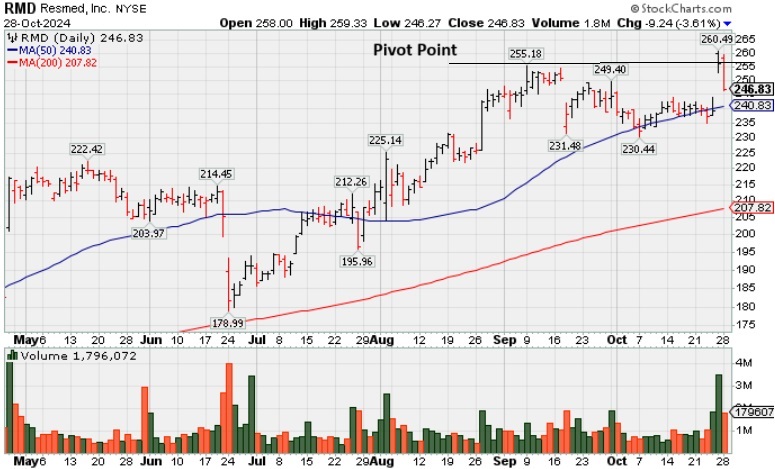
ResMed Medical-Products (RMD -$9.24 or -3.61% to $246.83) pulled back today with a loss backed by +79% above average volume. It was highlighted in yellow in the 10/25/24 mid-day report (read here) with pivot point cited based on its 9/09/24 high plus 10 cents after it gapped up hitting new multi-year highs. Although it triggered a triggered a technical buy signal on Friday, Monday's loss and close back below the pivot point promptly negated the breakout raising concerns. Confirming gains for new highs would be a reassuring signing of fresh institutional buying demand that could lead to a sustained and meaningful advance.
RMD has a 96 Earnings Per Share Rating, well above the 80+ minimum guideline for buy candidates. Bullish action came after it reported earnings +34% on +31% sales revenues for the Sep '24 quarter versus the year-ago period, marking its 3rd strong comparison above the +25% minimum earnings guideline (C criteria). Annual earnings (A criteria) growth has been steady.
The number of top-rated funds owning its shares rose from 1,739 in Dec '23 to 1,882 in Sep '24, a reassuring sign concerning the I criteria. Its current Up/Down Volume Ratio of 1.8 is an unbiased indication its shares have been under accumulation over the past 50 days.

