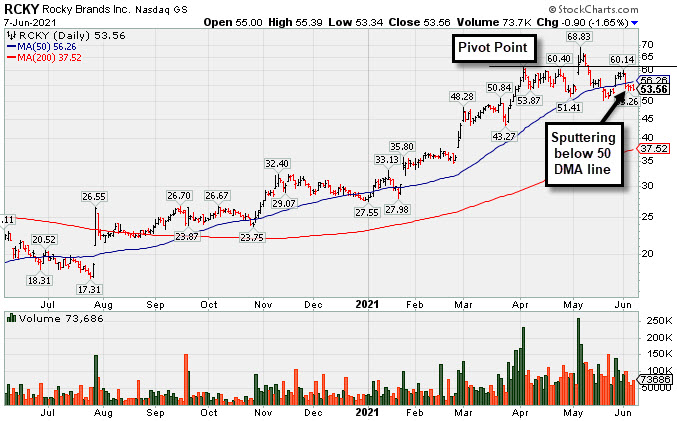
Still Sputtering After Slump Below 50-Day Moving Average - Monday, June 7, 2021
Rocky Brands Inc (RCKY -$0.90 or -1.65% to $53.56) suffered a 4th consecutive loss today. It recently violated its 50-day moving average (DMA) line ($56.38) raising concerns. A rebound above that important short-term average is needed for its outlook to improve. The prior low ($50.52 on 5/19/21) defines the next important support where any violation may trigger a more worrisome technical sell signal.RCKY rallied above the pivot point after highlighted in yellow with pivot point cited based on its 4/05/21 high following a 4-week square box base in the 5/05/21 mid-day report (read here). It was shown in the FSU that evening with an annotated graph under the headline, "Rocky Brands Powered Higher After Strong Earnings".
Fundamentals remain strong. The Apparel - Shoes & Rel Mfg firm has the highest possible Earnings Per Share Rating of 99. It reported Mar '21 quarterly earnings +341% on +57% sales revenues versus the year ago period, its 3rd strong quarterly comparison. Annual earnings (A criteria) history has been strong since a downturn in FY '16.
The number of top-rated funds owning its shares reportedly only rose from 209 in Sep '20 to 215 in Mar '21, however its current Up/Down Volume Ratio of 1.3 is an unbiased indication its shares have been under accumulation over then past 50 days. It has only 7.3 million shares outstanding (S criteria) which can contribute to greater price volatility in the event of institutional buying or selling.
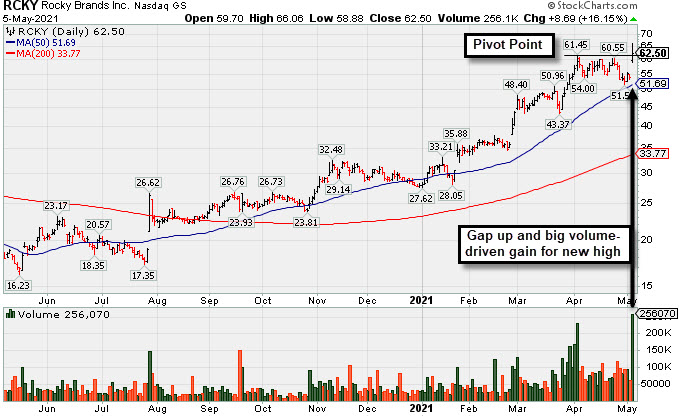
Rocky Brands Powered Higher After Strong Earnings - Wednesday, May 5, 2021
Rocky Brands Inc (RCKY +$8.69 or +16.15% to $62.50) finished in the middle of its intra-day range and above the pivot point after highlighted in yellow with pivot point cited based on its 4/05/21 high following a 4-week square box base in the earlier mid-day report (read here). It gapped up today hitting a new all-time high with a big volume-driven gain triggering a technical buy signal.Bullish action came after it reported Mar '21 quarterly earnings +341% on +57% sales revenues versus the year ago period, its 3rd strong quarterly comparison. Annual earnings (A criteria) history has been strong since a downturn in FY '16. It has the highest possible Earnings Per Share Rating of 99.
The number of top-rated funds owning its shares reportedly only rose from 209 in Sep '20 to 212 in Mar '21, however its current Up/Down Volume Ratio of 1.9 is an unbiased indication its shares have been under accumulation over then past 50 days. It has only 7.3 million shares outstanding (S criteria) which can contribute to greater price volatility in the event of institutional buying or selling.